Targeted Protein Quantification Using High-Throughput Capillary LC–MS
Special Issues
The detection limit, analytical precision, dynamic range, and robustness of a method for the targeted quantification of peptides using a capillary-flow LC–MS system were evaluated by spiking known amounts of isotopically labeled yeast peptides into a 500-ng yeast digest matrix.
Verification and validation of large numbers of low-abundance peptides or proteins in complex biological samples require sensitive and robust high-throughput quantification. To that end, a liquid chromatography–mass spectrometry (LC–MS) method was developed that uses a capillary-flow-rate ultrahigh-performance LC system coupled to a triple-quadrupole mass spectrometer. The combined use of 300-µm i.d. columns and a conventional electrospray ionization probe allowed the easy use of flow rates between 1 and 10 µL/min and limits of detection at the 10 amol level in complex matrices with great robustness and repeatability. Run times in every case were kept to less than 30 min.
Advanced genomics and proteomics discovery studies have contributed to an increase in the number of potential protein biomarkers and drug candidates. These potential biomarkers and drug candidates need to be fully characterized and validated before entering the development pipeline or going through clinical testing (1). The verification and validation of large numbers of samples require a robust, high-throughput method for the sensitive quantification of low-abundance peptides and proteins in biological matrices. These increased analytical needs in the proteomics and clinical proteomics fields have contributed to the continuous improvement of a number of analytical techniques. Although techniques such as protein arrays and two-dimensional polyacrylamide gel electrophoresis (2D-PAGE) have been very popular, their intrinsic limitations have promoted the use of liquid chromatography (LC) coupled to mass spectrometry (MS). Low-flow-rate LC–MS systems, in particular nano LC–MS systems, are nowadays the norm for the sensitive analysis of peptides in biological fluids. Contrary to other techniques (for example, capillary electrophoresis) that are limited in terms of loadability, low-flow LC–MS systems generally incorporate a trap column that enables the injection of relatively large sample volumes (up to 100 µL) in a short time. Additionally, the constant improvement and development of novel LC columns permit faster and more robust analysis to be performed.
In this study, the detection limit, analytical precision, dynamic range, and robustness for the targeted quantification of peptides using a capillary-flow LC–MS system were evaluated by spiking known amounts of isotopically labeled yeast peptides into a 500-ng yeast-digest matrix. An additional mixture of bovine serum albumin (BSA) and enolase digests was used to evaluate the throughput of the method for less-complex samples.
Experimental
Sample Preparation
Sample 1: An extract of yeast proteins (National Institute of Standards and Technology [NIST]) was used to make the yeast digest matrix. The yeast protein extract was reduced and then alkylated, followed by tryptic digestion. A mixture containing eight isotopically labeled yeast peptides (Thermo Scientific) was used in this study as well. A dilution series was prepared in which the mixture of isotopically labeled yeast peptides was spiked into 500-ng yeast digest matrix at five levels (0.005, 0.05, 0.5, 5, and 50 fmol/µL).
Sample 2: A BSA digest and an enolase digest (Waters) were mixed together and diluted in the loading solvent at a concentration of 1 fmol/µL.
Chromatography
A capillary ultrahigh-pressure liquid chromatography (UHPLC) system (Thermo Scientific Dionex UltiMate 3000 RSLCnano system) was used for peptide separation. The LC system can deliver pressures up to 800 bar and supports tool-free column connection.
Both the trap column and the separation column were packed with C18 material. The trap column (2 cm × 100 µm) was packed with 5-µm Thermo Scientific Dionex Acclaim PepMap particles and loaded at a flow rate of 20 µL/min using 0.05% trifluoroacetic acid in 98:2 water–acetonitrile as the loading solvent. Sample loading was performed for 6 min when analyzing the dilute sample series and 3 min for the mixture of BSA and enolase. The separation column (300 µm i.d.) was packed with 2-µm Acclaim PepMap RSLC particles and was 15 cm long in most experiments. A shorter column (5 cm long) was used for the analysis of simpler mixtures where chromatographic resolution was not as important. In both cases, the analysis was performed at a flow rate of 4 µL/min. The solvents were 0.1% formic acid in water for A and 0.1% formic acid in 20:80 water–acetonitrile for B. A gradient from 5% B to 55% B in 30 min was used for the separation of the dilute sample series while a shorter gradient, 5% B to 35% B in 10 min, was used for the analysis of the mixture of BSA and enolase digests. In all cases, the amount injected was 2 µL in microliter pick-up mode using 0.05% trifluoroacetic acid in 98:2 water–acetonitrile as transport liquid.
Mass Spectrometry
A Thermo Scientific TSQ Vantage triple-quadrupole mass spectrometer equipped with a conventional electrospray ionization (ESI) source was used for all experiments. A 50-µm i.d. metal needle was installed on a conventional Thermo Scientific HESI-II probe for the ionization.
A 3400-V spray voltage, six arbitrary units of sheath gas, and a 275 °C capillary temperature were used for the ionization. The selectivity for both Q1 and Q3 were set to 0.7 Da (full-width half-maximum). The collision gas pressure of Q2 was set at 1.2 mTorr of argon. The mass spectrometer was operated in selected reaction monitoring (SRM) mode.
Thermo Scientific Pinpoint software, version 1.2, was used for both assay development and data analysis. An MS-MS spectral library was developed based on previous discovery experiment data to enable transition selection per target peptide.
The two most intense fragment ions per peptide target were automatically selected for the SRM assay for quantifying eight isotopically labeled target peptides.
Three peptides that have unique peptide sequences to present the targeted protein of BSA and another three peptides that have unique peptide sequences to present the targeted protein of enolase were selected as quantitative surrogates of the two targeted proteins based on the MS-MS spectral library. The three most intense fragment ions per peptide target were automatically selected for the SRM assay.
SRM Parameters for Sample 1:
The analysis of targeting the eight peptide standards spiked in the dilute sample series was carried out in timed-SRM (tSRM) mode with 2-min scheduled time windows. The cycle time used was 1.5 s. The targeted peptides, precursor and product ions, and collision energies used are listed in Table I.

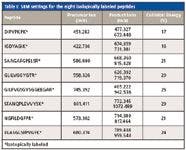

Table I: SRM settings for the eight isolopically labeled peptides
SRM Parameters for Sample 2:
The analysis of the mixture of BSA and enolase digests was carried out using an unscheduled SRM mode. Cycle time was 1 s. The targeted peptides representing BSA and enolase, precursor and product ions, and collision energies used are listed in Table II.

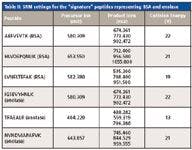
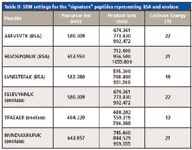
Table II: SRM settings for the "signature" peptides representing BSA and enolase
Data Analysis
Thermo Scientific Xcalibur software, version 2.1, and Pinpoint software, version 1.2, were used for data processing.
Results and Discussion
General LC–MS Considerations
LC–MS using standard reversed-phase high performance liquid chromatography (HPLC) separation conditions (4.6-mm i.d. column and 1.0 mL/min flow rate or 2.1-mm i.d. column and 0.2 mL/min flow rate) has been one of the major approaches for quantification of small molecular compounds from biological fluid samples. However, LC–MS using a standard flow rate separation does not provide the necessary sensitivity for the analysis of many low-abundance proteins and peptides in complex matrices. The intrinsic sensitivity of the applied analytical method can be greatly enhanced by reducing the column dimensions (2).
Although nano LC coupled to MS by a nano ESI interface provides the greatest sensitivity, it generally involves more training, may show limited robustness, and requires more user intervention than the conventional interface used in this study. The use of capillary columns (100–500 µm i.d.) and flow rates (1–10 µL/min) provides significant improvements in sensitivity compared to standard-flow LC–MS. Although making connections with silica capillaries can be challenging or introduce detrimental dead volumes in the sample flow path, several new types of connections have been brought to the market for finger-tight UHPLC-compatible connections of columns and capillaries. The use of capillary LC requires finding the optimum compromise between gradient delay, band broadening, and back pressure. Connection capillaries of
50 µm i.d. are generally used pre- and post-column. Capillary LC–MS also shows robustness and quantitative reproducibility that, generally, can only be achieved at more conventional flow rates (hundreds of microliters per minute). This type of pumping system typically has an extended flow range up to 50 µL/min, offering great robustness and flexibility. The stability of the flow delivery and the repeatability of the gradient formation allows for the use of timed segments in targeted MS experiments.
One of the additional benefits that capillary LC–MS provides is the capability to use the conventional electron spray source for the ionization. By sharing the same ion source with standard LC–MS, the capillary LC–MS set up is much easier and cost effective than nano LC–MS.
Optimization of Capillary LC–MS Analytical Conditions
A sample containing the eight spiked peptides at a concentration of 5 fmol/µL was used to assess the influence of the flow rate on the workflow sensitivity. Flow rates of 1, 4, and 6 µL/min were investigated. The intensities of targeted peptides were comparable at flow rates of 1 and 4 µL/min. However, the signal intensity of most targeted peptides started to decrease at flow rates greater than 4 µL/min, and at those flow rates the auxiliary gas becomes necessary to stabilize the electrospray. Therefore, a flow rate of 4 µL/min was chosen for all subsequent experiments as no significant gain in sensitivity was observed by lowering the flow rate from 4 µL/min to 1 µL/min.
Sensitivity and Linear Dynamic Range Using Capillary Flow Rates
The sensitivity and linear dynamic range of the workflow were evaluated by injecting the sample series of isotopically labeled yeast peptides spiked in a yeast digest matrix in order of increasing concentration starting with a blank and ending with the most concentrated standard. The gradient went from 5% to 55% B in 30 min. Each sample was run in triplicate. All eight peptides were clearly detected from 10 amol to 100 fmol on column. Figure 1 shows the extracted chromatograms of the peptide SAAGAFGPELSR* spiked into a 500-ng yeast-digest matrix at different concentration levels. Because the labeled peptides cover a relatively large spectrum of varying physicochemical properties, we believe that similar sensitivity could be achieved for most peptides. Naturally, the matrix plays a very important role that would influence sensitivity.

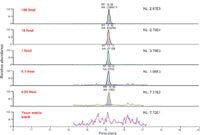
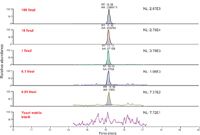
Figure 1: Extracted chromatograms of the peptide SAAGAFGPELSR* spiked into a 500-ng yeast-digest matrix at different concentration levels.
Figure 2 shows the calibration curve of the peptide ELASGLSFPVGFK* acquired from the diluted sample sequence. Over four orders of linear dynamic range were observed from 0.01 fmol to 100 fmol, which should be sufficient for many protein or peptide quantification applications.

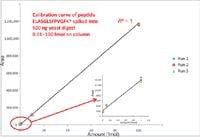
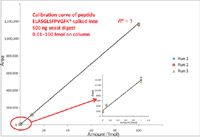
Figure 2: Calibration curve of spiked peptide ELASGLSFPVGFK*. Over four orders of linear dynamic range were observed.
The analytical precision was evaluated by calculating the coefficients of variation for triplicate runs at each concentration level. The observed analytical precision was excellent and able to provide quantitative results even for the least abundant proteins or peptides. The coefficients of variation were less than 15% for the targeted peptides even at 10 amol concentration levels. Table III shows the summary of the percent coefficient of variation (%CV) for the samples at all five concentrations.


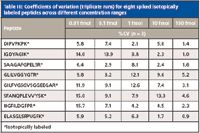
Table III: Coefficients of variation (triplicate runs) for eight spiked isotopically labeled peptides across different concentration ranges
Retention Time Repeatability and Integrated Peak Area Precision

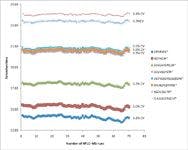
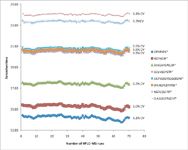
Figure 3: Retention-time repeatability over 70 consecutive LCâMS runs.
To evaluate the robustness of the capillary LC–MS workflow and test the repeatability of both retention times and integrated peak areas, the sample containing the spiked peptide mixture at a concentration of 5 fmol/µL was run 70 times consecutively using the previously described method. Both retention times and integrated peak areas showed excellent repeatability over the 70 LC–MS runs, compared to what can be achieved using a standard flow rate for separation. The %CV of the retention time for the three early-eluted peptides were 0.7–1.1%. Peptides eluted later in the gradient showed even lower variations, and the percentages of coefficient of variation were between 0.3% and 0.5% (Figure 3). Retention times proved to be even more repeatable when this workflow was applied to the analysis of simpler samples such as a mixture of BSA and enolase digests; retention times varied by no more than a second or two (Figure 4).

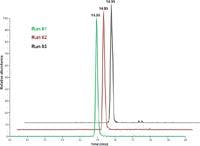
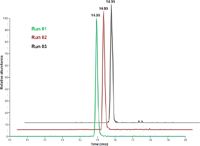
Figure 4: Retention-time repeatability of targeted peptide NYNDVIAPAFVK over three repeat runs using a 10-min gradient on a 5-cm column.
The integrated peak area for each targeted peptide was reproducible across 70 consecutive runs without signal intensity normalization. The most hydrophilic peptide showed a coefficient of variation of 12.0%, while all other peptides showed coefficient of variation of less than 7% (Figure 5).
Figure 5: Integrated-peak-area repeatability over 70 consecutive LCâMS runs.
Increased Throughput Using a 5-cm Column and a Fast Gradient for the Analysis of Samples of Lesser Complexity
For less-complex samples, throughput could be further increased by using a shorter column and a faster gradient. A mixture of BSA and enolase digests was used to evaluate throughput for simple protein digests. The concentration of both BSA and enolase was 1 fmol/µL. Three peptides from BSA and three peptides from enolase were targeted. The SRM quantitative assay was run in triplicate using a short gradient (5–35% B in 10 min) and a short column (5 cm). The total run time was 20 min including sample loading, peptide separation, column washing, and column equilibration. Figure 6 shows the extracted-ion chromatograms for all six targeted peptides. High LC efficiency was maintained with a fast gradient that yielded very sharp peaks and high sensitivity. The retention time was highly reproducible across three runs (Figure 4). Throughput could be further increased by mounting the capillary LC–MS setup in tandem, thus doubling the measurement time. Turn-around time could be as low as 2 min per run for the analysis of simple tryptic digests while still retaining excellent robustness and repeatability (data not shown).

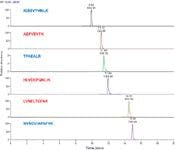
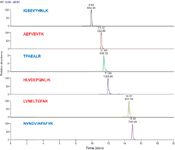
Figure 5: Integrated-peak-area repeatability over 70 consecutive LCâMS runs.
Conclusion
The capillary LC–MS workflow presented in this study was thoroughly characterized and successfully applied to the targeted quantification of multiple peptides in complex biological matrices.
The combined effects of efficient separation, analyte ionization and transmission allowed for very high sensitivity; down to 10 amol on-column. The great stability of both flow delivery and gradient formation resulted in very repeatable retention times (most analysis showed a CV of less than 0.5%) and enabled the use of timed SRM segments. The peak area in MS-MS for each of the eight isotopically labeled peptides was very repeatable; CVs for triplicate injections were always below 15% down to the lowest concentration levels investigated here.
Not only can throughput be much higher than in workflows using dedicated low-flow LC pumps, it also can be set up as easily as any standard-flow LC–MS system. It is as robust and repeatable as any conventional-flow setups and offers an environmentally friendly alternative that uses much less solvent.
The quantification of peptides in the yeast matrix presented here and the analysis of opioids in urine published elsewhere (3) demonstrate the potential this setup has for the routine and sensitive quantification of targeted analytes in large sample batches. It can be applied to any quantitative work requiring high sensitivity and robustness as well as high-throughput.
Acknowledgment
All trademarks are the property of Thermo Fisher Scientific Inc. and its subsidiaries.
References
(1) N. Rifai, M.A. Gillette, and S.A. Carr, Nat. Biotechnol. 24(8), 971–983 (2006).
(2) L. Rieux, E.-J. Sneekes, and R. Swart, LCGC North Am. 29(10), 926–934 (2011).
(3) X. He, M. Kozak, and S. Nimkar, Anal. Chem. 84(18), 7643–7647 (2012).
Laurent Rieux is a senior HPLC product support specialist with Thermo Fisher Scientific in Amsterdam, The Netherlands.
Reiko Kiyonami is a senior strategic marketing specialist with Thermo Fisher Scientific in San Jose, California.
Direct correspondence to: Reiko.kiyonami@thermofisher.com


 and Dr. Valérie Agasse (right) of the University of Rouen. Photo Credit © Pascal Cardinael and Valérie Agasse.")
Inside the Laboratory: The Chromatography Laboratory at the University of Rouen
April 18th 2024In this edition of “Inside the Laboratory,” Pascal Cardinael and Valérie Agasse of the University of Rouen in Mont‑Saint-Aignan, France, discuss their laboratory’s work with miniaturizing gas chromatography (GC) columns and systems to improve on-site air analysis of volatile organic compounds (VOCs).