Ochratoxin A Levels in Flour Measured Using Isotope Dilution Mass Spectrometry
Scientists from the National Research Council Canada and the Canadian Grain Commission in Ottawa, Canada and Winnipeg, Canada recently measured how effective different solutions are in measuring ochratoxin A levels in flour samples.


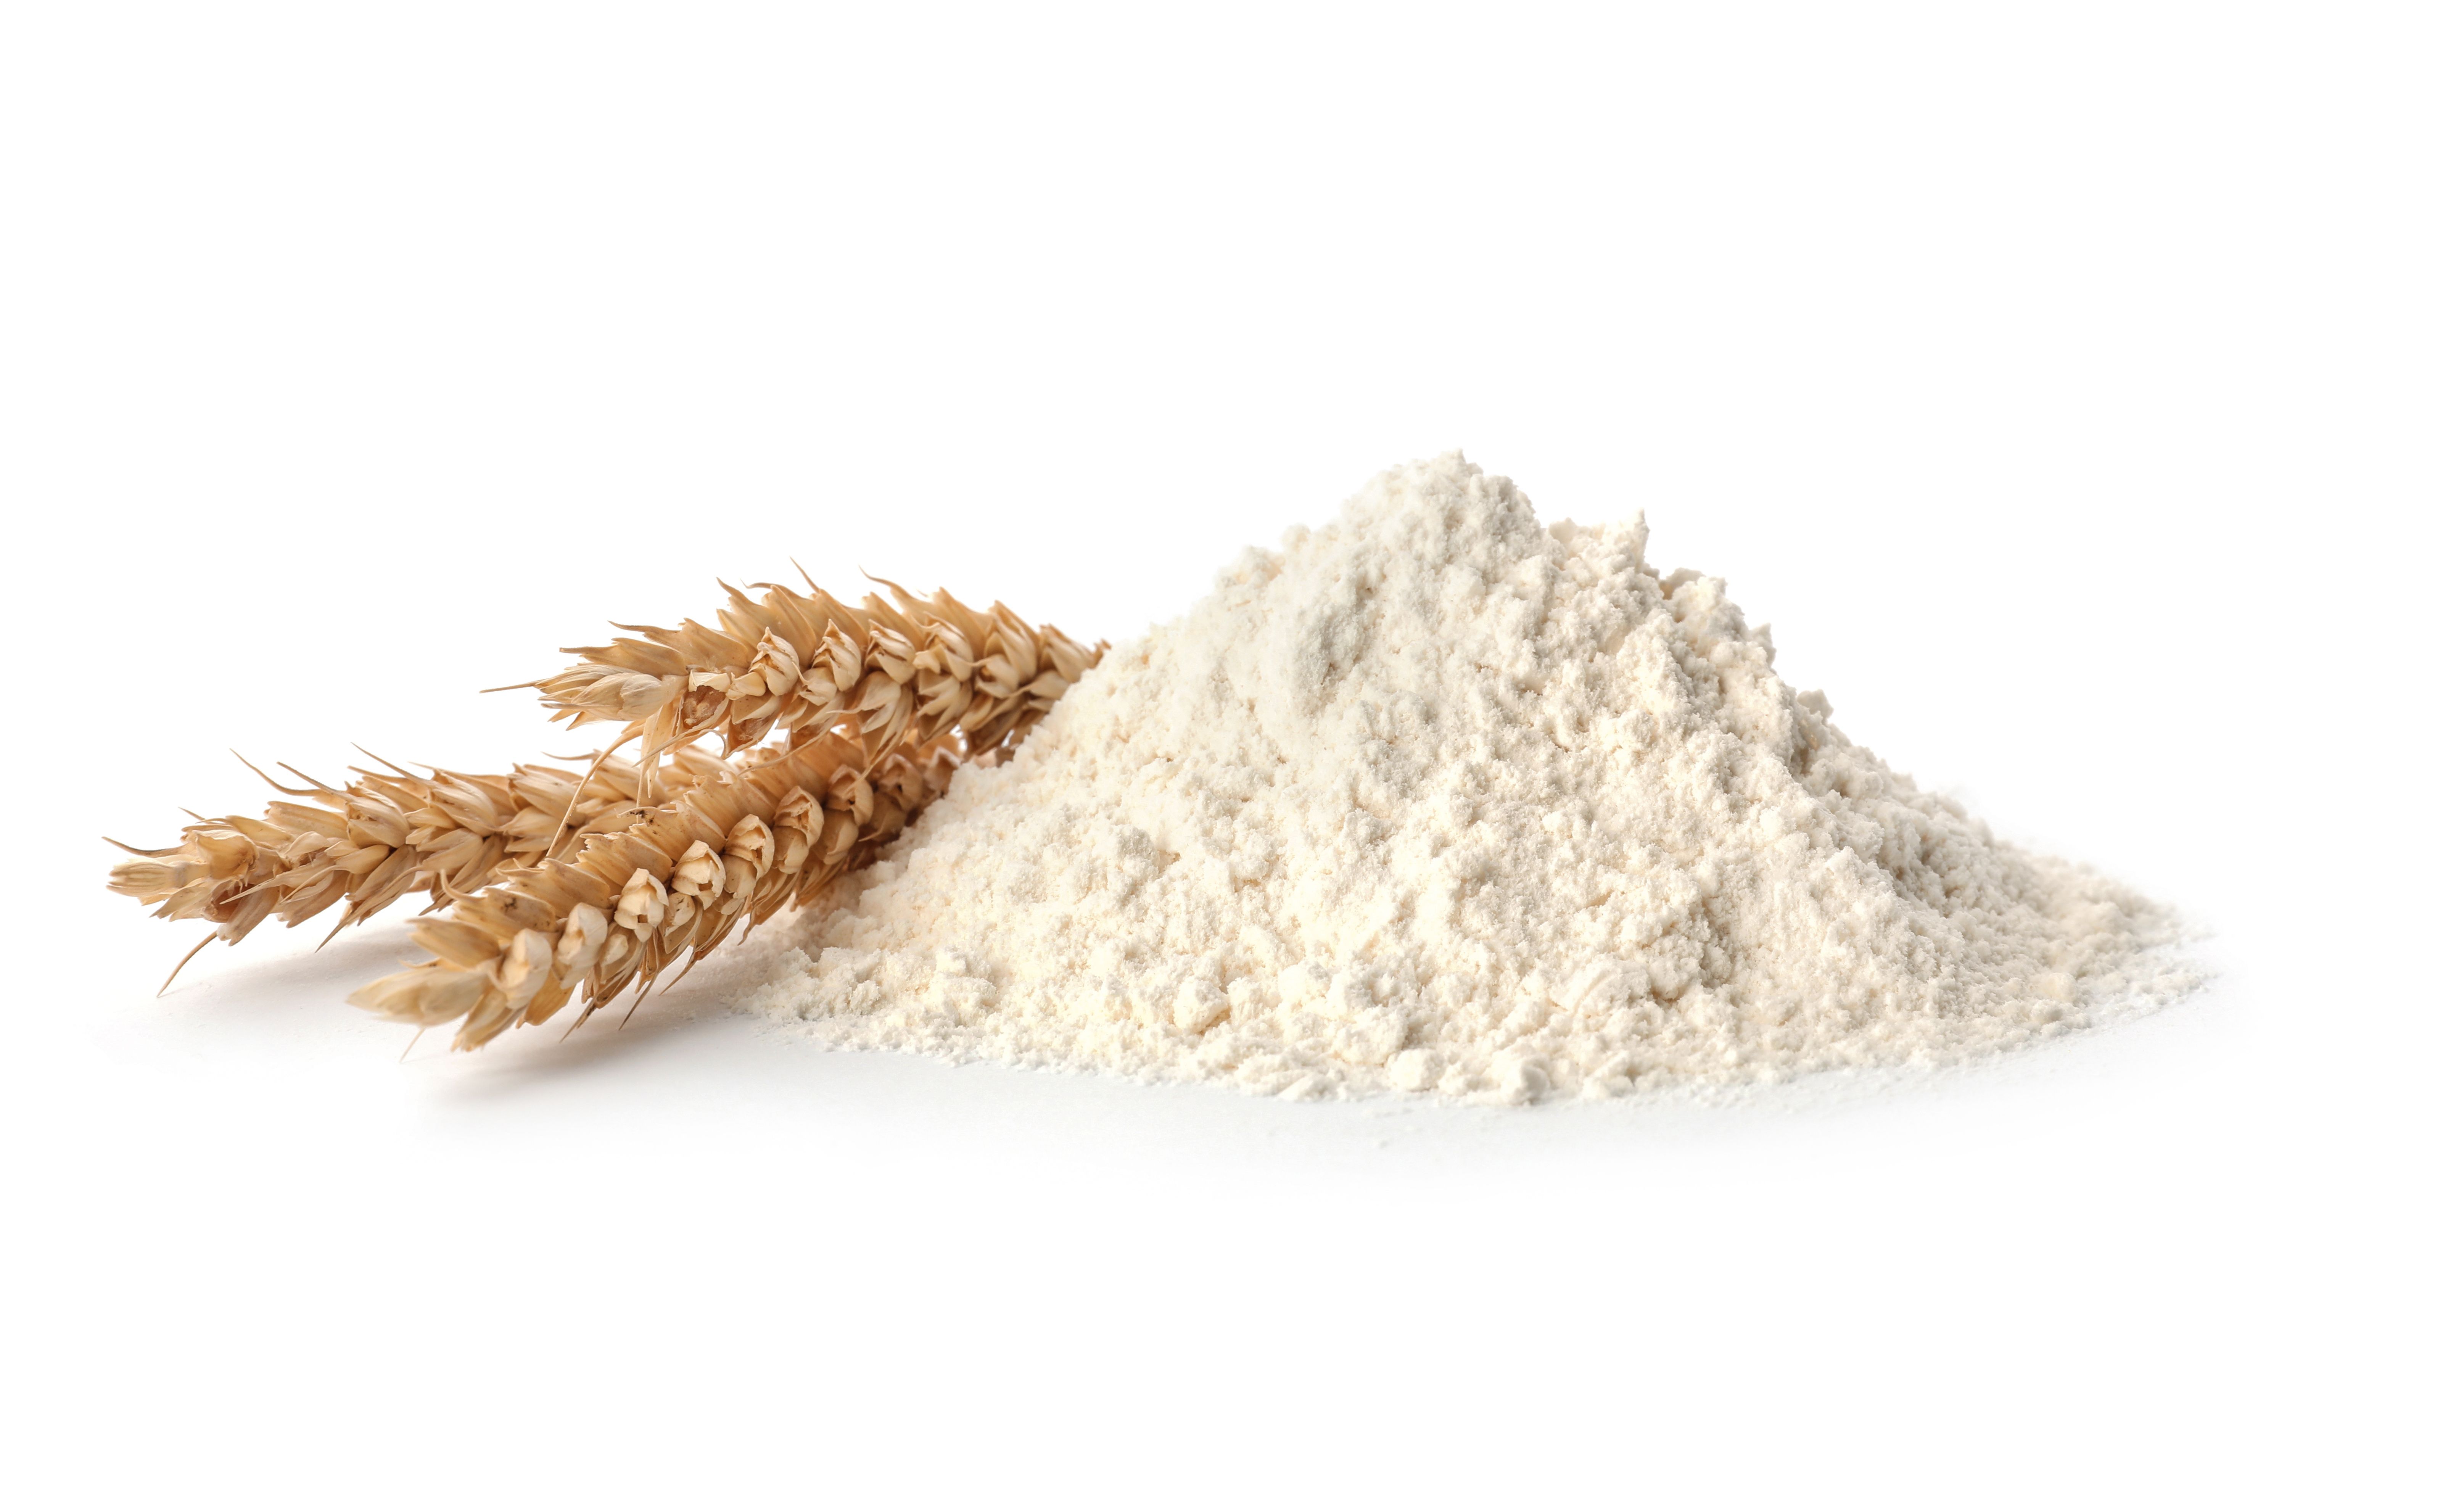
Fresh flour and ears of wheat isolated on white | Image Credit: © New Africa - stock.adobe.com
Modern liquid chromatography–mass spectrometry (LC–MS) instruments can easily detect low-level contaminants, which can help in monitoring organic contaminants; sadly, accurate quantitation can be challenging in complex matrices. Ionization suppression or enhancement of trace analytes can be done by co-eluting high-abundance matrix components, though this can bias results. As such, matrix effects that lead to ionization suppression must be measured to ensure that LC–MS methods are accurate.
Different strategies can be used to mitigate these effects, with internal standard-based methods, such as isotope dilution mass spectrometry (IDMS), being the most optimal. In this experiment, the scientists tested several internal calibration strategies for quantifying ochratoxin A (OTA) in wheat samples using LC–MS. Specifically, single (ID1MS), double (ID2MS), and quintuple (ID5MS) isotope dilution mass spectrometry, as well as external standard calibration were used and compared to each other. MYCO-1, a certified reference material (CRM) of flour, was used to evaluate each method’s accuracy.
External calibration led to results 18–38% lower than the certified value for MYCO-1, with this likely spawning from matrix suppression effects. Additionally, lower OTA mass fractions were obtained for the wheat samples via external calibration as opposed to the other methods. That said, all isotope dilution methods led to results within 3.17–4.93 µg/kg, which is the average range for MYCO-1. However, ID1MS-obtained results yielded an average 6% decrease in OTA mass fractions. Under scrutiny, these differences were attributed to an isotopic enrichment bias in the isotopically labelled internal standard [13C6]-OTA that was used for ID1MS. However, for many analytes, an appropriately labelled reference material may be unavailable; in these cases, ID2MS would be the next best approach. ID5MS, which was used to quantify OTA via multi-point calibration with internal standard, may require more sample preparation, but it proved most ideal for samples where OTA levels are unknown and differ between samples.
Reference
(1) Bates, J.; Bahadoor, A.; Tittlemier, S. A.; Melanson, J. E. Comparison of Calibration Strategies for Accurate Quantitation by Isotope Dilution Mass Spectrometry: A Case Study of Ochratoxin A in Flour. Anal. Bioanal. Chem. 2024, 416, 487–496. DOI: 10.1007/s00216-023-05053-3


Analytical Challenges in Measuring Migration from Food Contact Materials
November 2nd 2015Food contact materials contain low molecular weight additives and processing aids which can migrate into foods leading to trace levels of contamination. Food safety is ensured through regulations, comprising compositional controls and migration limits, which present a significant analytical challenge to the food industry to ensure compliance and demonstrate due diligence. Of the various analytical approaches, LC-MS/MS has proved to be an essential tool in monitoring migration of target compounds into foods, and more sophisticated approaches such as LC-high resolution MS (Orbitrap) are being increasingly used for untargeted analysis to monitor non-intentionally added substances. This podcast will provide an overview to this area, illustrated with various applications showing current approaches being employed.

LC–MS/MS-Based System Used to Profile Ceramide Reactions to Diseases
April 26th 2024Scientists from the University of Córdoba in Córdoba, Spain recently used liquid chromatography–tandem mass spectrometry (LC–MS/MS) to comprehensively profile human ceramides to determine their reactions to diseases.


High-Throughput 4D TIMS Method Accelerates Lipidomics Analysis
April 25th 2024Ultrahigh-pressure liquid chromatography coupled to high-resolution mass spectrometry (UHPLC-HRMS) had been previously proposed for untargeted lipidomics analysis, but this updated approach was reported by the authors to reduce run time to 4 min.


