Asymmetrical Flow FFF as an Analytical Tool for the Investigation of the Physical Stability of Virus-Like Particles
LCGC North America
The rational development of AF4 methods for the investigation of VLP is illustrated.
During the past few years, virus-like particles gained more and more attention as a new, safe class of vaccines, suitable for the prevention of virus induced infectious diseases (1) and for the therapeutical treatment of chronic diseases (2) and drug addiction (3).

However, for the development of pharmaceutical products based upon virus-like particles (VLPs), the application of reliable analytical tools is of great importance. For quality control purposes, the analytical methods need to be sufficiently sensitive to detect and quantify even small varieties between different active pharmaceutical ingredient (API) bulk materials, and varying formulations upon manufacture and storage. For the assessment of physical properties of viruses and VLPs, three main techniques are established: transmission electron microscopy (TEM) (4–6); dynamic light scattering (DLS), often referred to as photon correlation spectroscopy (PCS) or quasi-elastic light scattering (QELS) (7–9); and size-exclusion chromatography (SEC) (10–12). The utilization of TEM can be ascribed to the high resolution enabling accurate particle analysis. Inherent drawbacks of this technique are random sampling — instead of an overall sample analysis — and time-consuming preparation and measurement procedures.
DLS is described as a powerful, fast, nondestructive method for the determination of the average hydrodynamic radii and size distributions of particles in their natural liquid environment. Thereby, increasing average sizes and polydispersity indices indicate aggregation of the particles (13). However, the size resolution is rather low and the obtained size distribution is rather inaccurate; the particles must differ in radius by about twofold to be resolved. Furthermore, the accurate quantification of different particle fractions is not feasible (14,15). SEC represents the gold standard for the analysis of the physical stability of proteins and also is used for the characterization of large biomolecules like VLPs. The drawbacks of SEC are its limited resolution capacity of especially high molecular weight molecules and the fact that only the analysis of soluble aggregates is possible (16). Consequently, for formulation development studies, there is a strong need for a more sensitive analytical tool that allows separation, characterization, and quantification of different VLP fractions.
Field-flow fractionation (FFF) was introduced in 1966 as a new versatile technique for the separation and characterization of high molecular weight molecules and particles (17). Since then, FFF techniques such as sedimentation FFF, thermal FFF, electrical FFF, flow FFF, and asymmetrical flow FFF have been developed as reviewed recently by Fraunhofer and colleagues (18) and Reschiglian and colleagues (19). Among these, asymmetrical flow FFF is described as the most versatile and used widely. The theory and basic mechanisms of asymmetrical flow FFF are discussed in detail elsewhere (18, 20–22) and are only summarized here in brief. In Figure 1, the principle of separation is illustrated.


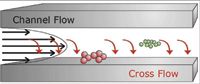
Figure 1: Separation principle of asymmetrical flow FFF.
A sample is injected into the hollow channel, which is at the downside ("accumulation wall") limited by an ultrafiltration membrane with a certain molecular weight cut-off (open for solvent, but not for species to be analyzed). After a focusing step, samples are eluted by a parabolic channel flow. At the same time, a cross-flow perpendicular to the carrier flow is applied that "pushes" the dispersed particles in the direction of the accumulation wall, where the cross-flow exits the channel via the membrane. Thereby, analytes are partitioned into regions with different flow velocities in dependence of their diffusion properties. In essence, the larger a particle, the smaller its diffusion coefficient acting in opposite direction than the convection from the cross-flow. Thus, the larger a particle, the stronger it is influenced by the cross-flow and the longer it is retained in the channel. As a consequence, smaller particles elute faster than larger ones. Due to the open architecture of the separation channel, particles in the size range of several nanometers up to a few microns are accessible for separation by field-flow fractionation (23).
During the past decades, asymmetrical flow FFF has gained more and more attention and was applied successfully for example for the analysis of the size and size distribution of monoclonal antibodies (16), liposomes (24), lipid–DNA complexes (25), nanoparticles (26,27), and viruses (28). Additionally, by coupling this technique with multiangle laser light scattering (MALLS) detection, it became possible to obtain the molecular weight distributions of the fractionated species (28–30).
In this context, it was the objective of the present work to develop an asymmetrical flow FFF method as an alternative tool for the analysis of VLP formulations and to investigate whether asymmetrical flow FFF can provide a better insight into VLP compositions than DLS and SEC.
Materials and Methods
In this study, varying VLP samples, all based upon Qb VLPs provided with different haptens, were used. The Qb VLPs, derived from the RNA bacteriophage Qb, are macromolecular assemblies formed from 180 copies of their respective coat protein monomer, which spontaneously assembles into a capsid structure. Qb VLPs were expressed recombinantly in Escherichia coli and purified, as previously described in detail by Jegerlehner and colleagues (31). All VLP samples were buffered with sodium phosphate salts at a pH of 7.2.
Asymmetrical flow FFF measurements were performed using either a Wyatt Technology standard separation channel (25 cm) or Wyatt Technology small separation channel (18 cm) both equipped with a 350-μm spacer; an Eclipse2 separation system (Wyatt Technology Europe GmbH, Dernbach, Germany); an Agilent 1100 HPLC series isocratic pump, autosampler, degasser, and UV detector (Agilent Technologies, Palo Alto, California); and a Wyatt Technology DAWN EOS multiangle light scattering detector. The VLP concentration was determined at 260 nm via UV detection. The multiangle light scattering detector was used for the determination of the average molecular weight of the VLP fractions.
The DLS measurements were performed using a Malvern Zetasizer Nano ZS system (Malvern Instruments Ltd., Worcestershire, UK). The polydispersity index (PI) and the hydrodynamic diameter were determined by using a non-negatively constrained least squares (NNLS) fitting algorithm. The size distributions by intensity and volume were calculated from the correlation function by using the multiple narrow mode of the Dispersion Technology Software version 4.00 (Malvern Instruments Ltd., Worcestershire, UK).
TEM analysis was carried out with a CM12 transmission electron microscope (Philips, Eindhoven, Netherlands) at 100 kV. Therefore, parlodion films mounted on 300 mesh/in. were carbon coated by electron gun evaporation at 10-5 mbar in a vacuum unit BAE 121 (BalTec Maschinenbau AG, Pfäfficon, Switzerland). The VLPs were adsorbed onto these coated films and negatively stained with uranylacetate (Sigma Aldrich Chemie GmbH, Buchs, Switzerland). Images were taken using a CCD low scan camera (Gatan Inc., Pleasanton, California).
SEC measurements were performed using a Summit high performance liquid chromatography (HPLC) system (Dionex GmbH, Idstein, Germany) equipped with a TSKgel G5000PWXL, 300 mm × 7.8 mm , 10-μm SEC column (Tosoh Biosience GmbH, Stuttgart, Germany). The running buffer was composed of 20 mM sodium phosphate and 150 mM sodium chloride (pH 7.2). The analyses were performed at a flow rate of 0.8 mL/min with UV detection at 260 nm.
Results and Discussion
VLP A was used for the development of the asymmetrical flow FFF method on the asymmetrical flow FFF system equipped with the "standard" channel (25 cm). The separation efficiency of an asymmetrical flow FFF method can be affected by manifold parameters like channel height, membrane material and molecular weight cut-off, eluent composition, focusing time, channel flow and cross-flow profile, and applied drug amount (21). In preliminary experiments, the following parameters were determined as fixed:
- Spacer: 350 μm
- Eluent: 20 mM sodium phosphate buffer (pH 7.0) with 150 mM sodium chloride
- Ultrafiltration membrane molecular weight cut-off: 10 kDa
- Channel flow: 1.5 mL/min
- Injection flow: 0.2 mL/min
- VLP amount: 20 μg

Figure 2: The effect of membrane material on the separation of VLP. Materials: 1 = cellulose, 2 = polyethersulfone, 3 = cellulose triacetate. All membranes had a 10-kDa cut-off.
Selection of Membrane Material
First, the impact of the membrane on the separation of VLP A was analyzed. The proper selection of the membrane material is important because during intensive focusing and during separation at high initial cross-flow rates, the analyte is accumulated at the membrane and, thus, adsorption phenomena can occur (20). In this context, regenerated cellulose, cellulose triacetate, and polyethersulfone membranes were assessed. The cross-flow was kept at 2.0 mL/min for 30 min and was reduced subsequently to 0 mL/min within 10 min. The fractograms, depicted in Figure 2, revealed that regenerated cellulose was the most suitable membrane material. The fractionation of apparently diverse VLP fractions was feasible and the recovery of VLP A, determined from the UV signal, was 96.37 ± 0.03%. Thus, it was assumed that almost no material was adsorbed onto the membrane. This might be related to the repulsion of the negatively charged VLP A by the negatively charged cellulose residues. However, cellulose acetate, which is even more negatively charged, seemed not to be useful, as the resolution of the distinctive peaks was worse and the recovery was clearly reduced (79%) in comparison to regenerated cellulose. By using polyethersulfone, two distinct VLP peaks with high resolution were obtained but a significant amount of VLP A was adsorbed to the membrane, the recovery was approximately 30%. Hence, regenerated cellulose was determined as optimal membrane material.

Figure 3: The effect of the varying cross-flow profiles on VLP separation. Flow rate: 1 = 0.5 mL/min, 2 = 1.0 mL/min, 3 = 1.5 mL/min, 4 = 2.0 mL/min, 5 = 2.5 mL/min, 6 = 3.0 mL/min.
Determination of Cross-Flow Profile
The initially applied cross-flow of 2 mL/min at a channel flow of 1.5 mL/min exhibited good separation properties for VLP A. However, in the next step, the effect of various cross-flows in the range of 0.5–3.0 mL/min on the separation of VLP A, the peak symmetry, and width was investigated. The resulting fractograms are displayed in Figure 3. It was demonstrated that increasing cross-flows led on the one hand to improved separation of apparently different VLP fractions, but on the other hand, to prolonged separation time and broadening of the specific peaks. The recovery of VLP A was higher than 95% for all samples, indicating that adsorption of VLP A to the membrane was not an issue. Finally, a cross-flow of 2.0 mL/min was chosen taking into account separation capacity and the symmetry of the particular peaks.


Figure 4: Asymmetric flow FFF cross-flow profile for method A.
The main VLP peak was detected at an elution time of about 23 min. To further optimize the separation and to improve the elution of the "larger" VLP fractions, the cross-flow profile was adjusted as follows: The cross-flow was reduced right after the elution of the main peak (26 min) from 2.0 mL/min to 0.15 mL/min within 15 min and kept at this low flow for further 5 min to enable the consecutive elution of larger VLP species. Subsequently, in a final step, the cross-flow was deactivated completely to enable the elution of high molecular weight aggregates. The final cross-flow profile is illustrated in Figure 4.
Figure 5: UV signal and molecular weights of specific VLP A fractions calculated from respective UV and MALLS data.
Figure 5 displays the resulting fractogram with the UV signal and the calculated molar masses of the specific VLP species. It could be shown that the applied asymmetrical flow FFF separation protocol was able to resolve VLP compositions in VLP fragments, monomers, dimers, and oligomers–aggregates. Furthermore, by coupling the asymmetrical flow FFF system to UV and MALLS detectors, quantification and determination of the molecular weight of the specific fractions was possible. For VLP monomers, a molecular weight of about 3.5 MDa was determined. As the recombinantly produced VLPs have a lower amount of host cell RNA (about 25%) (32) as compared to the native bacteriophage Qb (50% RNA content), the data obtained fit well with the data from literature appointing the molecular weight of the native phage to 4.2 MDa (33). Furthermore, the molecular weight of the VLP dimers and trimers could be assigned to 6.3 MDa and 9.8 MDa, respectively (Table I). Due to the high sensitivity of MALLS on high molecular weight analytes, molar masses for higher-order oligomers and high molecular weight aggregates could be calculated up to values > 108 Da. The presence of VLP monomers, dimers and trimers was confirmed by TEM analysis (Figure 5).

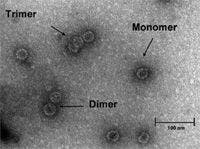

Figure 6: TEM picture of VLP A.
Investigation of Varying Cross-Flow Rates on VLP Aggregation
During the focusing step, the sample is exposed for a certain time to the cross-flow applied that "pushes" the sample in the direction of the ultrafiltration membrane and leads to the accumulation of the sample. During this focusing step, aggregation of the sample might be induced, which can lead to a change in sample composition and possibly to wrong results. Therefore, the effect of different cross-flow rates applied for different time intervals on VLP was studied. The results obtained (Table II) indicate that no significant change in sample composition occurs. Thus, it was concluded that at least at the cross-flow and focusing times tested no cross-flow induced aggregation of VLP takes place.

Table I: Molecular weights of specific VLP A fractions calculated from respective UV and MALLS signals (n = 3).
Repeatability
The intended use of asymmetrical flow FFF as a reliable tool for the quality control of VLP formulations demands high repeatability of the method. It was therefore of interest to study the repeatability of the determination of the relative amount of the different VLP species, expressed as the percentage of the total peak areas. VLP A (20 μg/injection) was, according to the instructions of the ICH guideline Q2 (R1), subjected to six independent measurements by asymmetrical flow FFF. The results, presented in Table III, prove the repeatability of the applied asymmetrical flow FFF method. Even for the VLP fractions present at low amounts (fragments and oligomers–aggregates), a relative standard deviation of less than 7% was determined.

Table II: Effect of different cross-flow rates and focusing times on VLP aggregation
Comparison of Asymmetrical Flow FFF to DLS and SEC
After successful development of an asymmetrical flow FFF method for VLP, it was essential to compare its efficiency to the commonly used DLS and SEC techniques. For a better illustration of the differences of these three techniques, three different VLP samples, one unstressed (A) and two stressed (B and C) samples, were investigated.


Table III: Repeatability of the asymmetric flow FFF analysis of VLP A (20 μg/injection)
The DLS results are shown in Figure 7. For the unstressed VLP sample (A), the mean size of the VLP was determined at 30 nm with a very narrow size distribution, as indicated by the polydispersity index of 0.10 and the width of the peak. The stressed VLP samples (B and C) revealed for increasing storage temperatures increasing mean sizes of the VLP and increasing polydispersity indexes and peak widths. Polydispersity index values of particulate systems higher than 0.1 denote the presence of several species (13), which was related in this case to the formation of VLP oligomers and aggregates. As expected, DLS was not capable to resolve the different VLP fractions.

Figure 7: DLS size distribution of VLP samples A (black line), B (dark grey line), and C (light grey line).
The chromatograms obtained from the SEC analysis are depicted in Figure 8. It was obvious that the stressed VLP samples B and C contained higher amounts of VLP oligomers and aggregates in comparison to the liquid formulation as for these samples a shoulder of the main peak appeared at a lower retention time.


Figure 8: SEC characterization of VLP samples A (black line), B (dark grey line), and C (light grey line).
For a better understanding of the chromatogram, SEC was coupled to MALLS detection, which enabled the determination of the molar mass distributions of the specific peaks Figure 9.

Figure 9: Analysis of VLP using SEC coupled to MALLS detection.
The calculated molar masses indicated that the main peak not only consists of VLP monomer (~3.5 MDa) but additionally of VLP dimers (~7 MDa) and trimers (~10 MDa). The shoulder on the left side of the main peak comprises VLP oligomers and aggregates in a range of 107 up to 108 Da. The poor resolution of the different VLP fractions by SEC arises from the large size of the VLPs, which are already as monomers in the upper separation range of the SEC column.

Figure 10: Characterization of VLP samples A (black line), B (dark grey line), and C (light grey line) by asymmetric flow FFF coupled to MALLS detection.
By contrast, asymmetrical flow FFF was capable of resolving the different VLP fractions into VLP fragments, monomer, dimers, trimers, and larger oligomers and aggregates (Figure 10). The amounts of the specific VLP fractions could be easily determined. The relative amounts of the VLP species, expressed as percentage of the total peak areas are given in Table IV and are compared to the results obtained by SEC.


Table IV: Characterization of VLP samples A, B, and C via asymmetric flow FFF and SEC. As VLP monomers, dimers, and trimers were not resolved by SEC, they are summarized in the table.
Concerning the amount of VLP fragments, both methods revealed the same values, whereas the determined amounts of VLP oligomers (larger than VLP trimers) and aggregates varied significantly. SEC analysis revealed far lower amounts of VLP oligomers and aggregates. Possible reasons for these different results include
- Deprivation of insoluble high molecular weight aggregates from analysis due to the exclusion limit of the SEC column.
- Inaccurate integration of the oligomer–aggregate peak due to the poor resolution.
- Abrasion of VLP oligomers and aggregates due to the harsher conditions (high shear forces) connected with SEC in comparison to asymmetrical flow FFF (no stationary phase).
- Generation of VLP aggregates during the focusing step of asymmetrical flow FFF analysis.
The deprivation of high molecular weight aggregates from SEC analysis was excluded because no clear decrease of the total peak area could be observed. VLP aggregation induced during asymmetrical flow FFF analysis was excluded because previous studies revealed that cross flow-induced aggregation plays no role (compare "Investigation of Varying Cross-Flow Rates on VLP Aggregation"). Hence, it was assumed that either the shearing degradation by the stationary phase of VLP aggregates or the inaccurate integration of the VLP aggregate peak might have led to these different results.
It was found that asymmetrical flow FFF exceeds the capabilities of DLS and SEC with regard to the analysis of the physical stability of VLP. Asymmetrical flow FFF can be used for the separation of VLP compositions and quantification of the single fractions, whereas DLS renders only trends. However, in terms of a fast progress in formulation development, the utilization of DLS as a fast and easily applicable method seemed to be reasonable to limit initially large numbers of formulations to the most promising ones. SEC exhibited only a poor capability of analyzing the physical stability of VLP, but it was found that it is a reliable tool for the investigation of the chemical stability of VLPs because of the proper determination of VLP fragments. However, it has to be mentioned that the currently used SEC method might be improved by using other column types, but a further optimization of the SEC method was beyond the scope of the present work. In summary, it could be stated that asymmetrical flow FFF is a very powerful tool for the accurate characterization of VLP formulations and overcomes the limitations of DLS and SEC.
Improvement of the Asymmetrical Flow FFF Method
In 2006, a small (18-cm) asymmetrical flow FFF separation channel was introduced (Wyatt Technology Europe GmbH). It was described that, in comparison to the standard 25-cm channel, the application of the small channel improves resolution, enables shorter equilibration and analysis times, and reduces eluent volumes. At the same time, increasing peak heights are obtainable, which in turn might lead to lower detection limits and, thus, enable the reduction of the injected amount. Hence, it was investigated whether the before described asymmetrical flow FFF method for VLP, developed for the standard asymmetrical flow FFF channel (25 cm), could be optimized by using the shorter asymmetrical flow FFF separation channel (18 cm). For this purpose, comparative asymmetrical flow FFF measurements were performed. VLP A were analyzed either with the standard channel according to method A (Figure 4) or with the shorter channel by applying method B (Figure 11). VLP amounts in the range of 5–20 μg and 2.5–10 μg were applied for the standard and the shorter asymmetrical flow FFF channel, respectively.
Figure 11: Asymmetric flow FFF cross-flow profile for method B.
The resulting asymmetrical flow FFF fractograms are displayed in Figure 12. The figure illustrates the advantage of the small channel in comparison to the standard channel: at the same injected amounts, sharper, higher peaks were obtained. Thus, the determination of the molecular weight of the VLP monomer and dimer was feasible even with a 2.5-μg injected VLP amount when using the small channel whereas for correct determination of the molecular weight of the VLP dimer the injected amount needed to be higher than 10 μg when the standard channel was used.

Figure 12: Asymmetric flow FFF analysis of different amounts of VLP A using the shorter 18-cm channel (1 = 2.5 μg, 2 = 5 μg, 3 = 10 μg) and the standard 25-cm channel (4 = 5 μg, 5 = 10 μg, 6 = 20 μg).
Concerning the amounts of the different VLP species (Table V), both methods revealed comparable values over the whole amount range tested. However, the lowest amount applied for the small channel (2.5 μg) was further reduced to one half of the lowest amount applied for the standard channel.

Table V: Asymmetric flow FFF analysis of VLP A using a standard 25-cm channel and a shorter 18-cm channel.
Furthermore, as indicated in Table VI, the analysis time and the eluent volume could be remarkably reduced by using the small channel. Thus, it could be stated that the shorter channel was a clear improvement for VLP characterization as compared to the standard channel. It enables a clearly increased sample throughput and the accurate characterization of VLP compositions at remarkably low VLP concentrations.

Table VI: Comparison between method A (standard channel) and B (small channel)
Summary
The successful development of asymmetrical flow FFF methods for the assessment of VLP compositions was presented. The effects of different membrane materials, cross-flow profiles, and focusing times on the separation of VLPs were evaluated. Repeatability studies were performed and the influence of varying cross-flow rates on VLP aggregation was investigated. It was illustrated that asymmetrical flow FFF enabled the proper separation of a VLP composition into VLP fragments, monomers, dimers, oligomers and aggregates. Furthermore, by coupling asymmetrical flow FFF to UV and MALLS detectors, accurate quantification of the specific fractions and the determination of the molecular weight distributions were feasible. Asymmetrical flow FFF was compared to the commonly applied DLS and SEC analytical methods. It was found that asymmetrical flow FFF exceeds the separation capacity of DLS and SEC. Thus, asymmetrical flow FFF seemed to be a valuable tool for the characterization of VLP compositions.
R. Lang, L. Vogt†, A. Zürcher†, and G. Winter*
*Department of Pharmacy, Pharmaceutical Technology and Biopharmaceutics, Ludwig-Maximilians-University, Munich, Germany, † Cytos Biotechnology AG, Schlieren, Switzerland
Please direct correspondence to rainer.lang@cup.uni-muenchen.de
References
(1) S.L. Block, T. Nolan, C. Sattler, E. Barr, E.D. Giacoletti Katherine, C.D. Marchant, X. Castellsague, S.A. Rusche, S. Lukac, J.T. Bryan, P.F. Cavanaugh, Jr.. and K.S. Reisinger, Pediatrics, 118(5), 2135–2145 (2006),
(2) P.M. Ambuehl, A.C. Tissot, A. Fulurija, P. Maurer, J. Nussberger, R. Sabat, V. Nief, C. Schellekens, K. Sladko, K. Roubicek, T. Pfister, M. Rettenbacher, H.D. Volk, F. Wagner, P. Mueller, G.T. Jennings, and M.F. Bachmann, J. Hypertension, 25(1), 63–72 (2007)
(3) P. Maurer, and M.F. Bachmann, 8(1), 11–16 (2006).
(4) V.M. Vogt, and M.N. Simon, J. Virology, 73(8), 7050–7055 (1999).
(5) G.L. Casini, D. Graham, D. Heine, R.L. Garcea, and D.T. Wu, Virology, 2004, 325(2), 320–327
(6) R.K. Hansen, S. Zhai, J.N. Skepper, M.D. Johnston, H.O. Alpar, and N.K.H. Slater, Biotechnol. Progress 21(3), 911–917 (2005).
(7) N.C. Santos and M.A.R.B. Castanho, Biophys. J., 71(3), 1641–1650 (1996).
(8) D.T. Brandau, L.S. Jones, C.M. Wiethoff, J. Rexroad, and C.R. Middaugh, J. Pharm. Sci. 92(2), 218–231 (2003).
(9) L. Shi, G. Sanyal, A. Ni, Z. Luo, S. Doshna, B. Wang, T.L. Graham, N. Wang, and D.B. Volkin, J. Pharm. Sci. 94(7), 1538–1551 (2005).
(10) A. Zlotnick, R. Aldrich, J.M. Johnson, P. Ceres, and M.J. Young, Virology 277(2), 450–456 (2000).
(11) P. Rueda, J. Fominaya, J.P.M. Langeveld, C. Bruschke, C. Vela, and J.I. Casal, Vaccine 19(7–8), 726–734 (2000).
(12) U. Schmidt, R. Rudolph, and G. Bohm, J. Virol. 74(4), 1658–1662 (2000).
(13) W.G. Griffin, and M.C.A Griffin, J. Chem. Soc., Faraday Transactions 89(15), 2879–2889 (1993).
(14) R.S. Stock and W.H. Ray, J. Polymer Sci., Polymer Physics Edition 23(7), 1393–1447 (1985).
(15) W. Jiskoot and J.A. Crommelin, Methods for Structural Analysis of Protein Pharmaceuticals; American Association of Pharmaceutical Scientists, (2005).
(16) A. Litzen, J.K. Walter, H. Krischollek, and K.G. Wahlund, Anal. Biochem. 212(2), 469–480 (1993).
(17) C. Giddings, J., Sep. Sci., 1(1), 123–125 (1966).
(18) W. Fraunhofer, and G. Winter, Eur. J. Pharmaceutics Biopharmaceutics 58(2), 369–383 (2004).
(19) P. Reschiglian, A. Zattoni, B. Roda, E. Michelini, and A. Roda, Trends in Biotechnol. 23(9), 475–483 (2005).
(20) K.G. Wahlund and J.C. Giddings, Anal. Chem. 59(9), 1332–1339 (1987).
(21) M. Schimpf, Field Flow Fractionation Handbook, John Wiley & Sons, Inc. New York, 2000.
(22) T. Kowalkowski, B. Buszewski, C. Cantado, and Dondi, Critical Rev. Anal. Chem. 36(2), 129–135 (2006).
(23) J.C. Giddings, Science 260(5113), 1456–1465 (1993).
(24) M.H. Moon and J.C. Giddings, J. Pharm. Biomed. Anal. 11(10), 911–920 (1993).
(25) H. Lee, S.K.R. Williams, S.D. Allison, and T.J. Anchordoquy, Anal. Chem. 73(4), 837–843 (2001).
(26) K. Jores, W. Mehnert, M. Drechsler, H. Bunjes, C. Johann, and K. Maeder, J. Controlled Release 95(2), 217–227 (2004).
(27) J. Zillies, "Gelatin Nanoparticles for Targeted Oligonucleotide Delivery to Kupffer Cells - Analytics, Formulation Development, Practical Application," Dissertation, Ludwig-Maximilians-University, Munich, 2006.
(28) H. Thielking and W.M. Kulicke, J. Microcolumn Sep. 10(1), 51–56 (1998).
(29) P.J. Wyatt, J. Colloid Interface Sci. 197(1), 9–20 (1998).
(30) W. Fraunhofer, G. Winter, and C. Coester, Anal. Chem. 76(7), 1909–1920 (2004).
(31) A. Jegerlehner, A. Tissot, F. Lechner, P. Sebbel, I. Erdmann, T. Kündig, T. Bächi, T. Storni, G. Jennings, P. Pumpens, W.A. Renner, and M.F. Bachmann, Vaccine 20(25–26), 3104–3112 (2002).
(32) M. Bachmann, P. Maurer, E. Meijerink, K. Proba, and K. Schwarz, "Virus-like particle-antigen conjugates and their uses as vaccines," European Patent EP2006037787, 2006.
(33) T. Hohn and B. Hohn, Advances Virus Res. 16, 43–98 (1970).


, chemical structure. | Image Credit: © molekuul.be - stock.adobe.com")


Developments in Field‑Flow Fractionation Coupled to Light Scattering
December 8th 2020Field-flow fractionation (FFF) coupled to light scattering is a powerful method to separate and characterize nanoparticles, proteins, and polymers from a few nanometres to a few micrometres. The technique is one of the few that can cover the full size range of nanomaterials and provide high-resolution size distributions and additional characterization. New developments in FFF enhance performance and productivity.

Field-Flow Fractionation: Virtual Optimization for Versatile Separation Methods
August 8th 2017Flow-field flow fractionation (flow-FFF) offers highly versatile separations for the analysis of complex fluids, covering a size range of macromolecules and particles from 1 nm to 10,000 nm. However, flow-FFF is often perceived as a difficult technique to learn because of the multiple parameters available for adjustment. Recent advances in software for simulating flow-FFF overcome this obstacle, enabling the virtual optimization of flow-FFF methods and opening up the power of flow-FFF separations to non-experts. An added benefit is the ability to easily analyze particle size distributions by elution time from first principles.


