Chromatography Fundamentals, Part IX: Light Scattering Detectors for Size-Exclusion Chromatography
Light scattering detectors are ideally suited for size-exclusion chromatography (SEC) because they provide the molecular weight and radius of gyration information of polymeric samples without column calibration. In this article, the fundamentals of light scattering as applied to SEC are introduced, with emphasis on the origin of the Rayleigh equation. This tutorial is geared to those new to the field or who already utilize light scattering and seek clarification regarding the multitude of equations associated with light scattering. Part X of this series will present a brief summary of commercially available light scattering instrumentation with emphasis on new detector technology. Owing to the complexity of data analysis and the many equations involved with light scattering measurements, part X will also include a glossary of principal symbols and a summary of relevant equations.
Size-exclusion chromatography (SEC) is used primarily for determining the molecular weight distribution and statistical molecular weight averages of polymeric samples. To obtain accurate results, columns must be calibrated with primary standards that are chemically and structurally equivalent to samples being analyzed. Alternatively, although less reliable, universal calibration can be employed using secondary standards; however, Mark-Houwink coefficients of both the sample and secondary standards used for column calibration must be known. For improved accuracy, universal calibration can be utilized with online viscometry; nevertheless, calibration with secondary standards is still required. Also, these procedures assume that universal calibration is valid for samples that are being analyzed. Regardless of the procedure used, columns still require frequent calibration to correct for flow rate drift and column deterioration.
When primary polymer standards are unavailable, the most reliable way to obtain accurate molecular weight data from SEC is the use of light scattering detection. This method requires no column calibration because the relationship between the intensity of scattered light and molecular weight is based on first principles. Moreover, molecular size (radius of gyration) can also be obtained. The only required parameters that must be known beforehand are the refractive index of the mobile phase and the specific refractive index of the polymer solution, two easily measured quantities.
The scattering of light from dilute polymer solutions is based on classical or Rayleigh light scattering, named after Lord Rayleigh III (1842–1919), who had discovered that the intensity of light scattered by small particles in air is proportional to the 4th-power of the wavelength of the incident light (1). Rayleigh light scattering is termed static or time-averaged light scattering to distinguish it from a related technique called dynamic light scattering, also known as photon correlation spectroscopy or quasi-elastic light scattering (see part XI of this series).
It is important to stress that Rayleigh light scattering instruments are different from that of evaporative light scattering detectors (ELSD), which has led to confusion among chromatographers. The ELSD is a mass-sensitive detector that utilize a combination of scattering phenomena (Rayleigh, Mie, reflection, and refraction) from aerosol particles formed by nebulizing column effluent: this type of detector is not designed for molecular weight measurements.
This article provides an overview of the principles of Rayleigh light scattering and its application to SEC. A summary of commercially available light scattering instrumentation, including a newly introduced light-scattering instrument, will be discussed in part X. Because this article is not a comprehensive review of this field, recommended books and chapters regarding the physics and SEC applications of Rayleigh light scattering can be found in references (2–6) and (7–10), respectively.
Rayleigh Scattering: A Natural Phenomenon
In the atmosphere, Rayleigh scattering occurs when sunlight is scattered by atoms, molecules, particulate pollutants, dust, and condensed water vapor in the atmosphere. With increased particle size, other scattering phenomena, such as Mie scattering, refraction, and reflection, give rise to additional optical phenomena and meteorological events like rainbows and reports of sightings of unidentified flying objects (UFOs). The unique feature of Rayleigh scattering is that the intensity of scattered light is inversely proportional to the 4th-power of the wavelength, an exceptionally strong dependency. The most obvious effects of Rayleigh scattering are the colors of the sun, the sky, the sunset, and the sunrise (1,11,12).
When viewed from space, the sun is white with a bluish-green tint. As sunlight travels through the atmosphere, short wavelengths of the visible spectrum, responsible for violet to blue (~380–500 nm), are preferentially scattered, as compared to the longer wavelengths of yellow, orange, and red (~570–740 nm) by up to a factor of 14 ([380/740 nm]-4). Thus, the sun appears yellow to orange because of the depletion of the shorter wavelengths, the latter of which are scattered away from the forward angle of observation and appear in the surrounding atmosphere as blue. It is interesting to note that as a consequence of human evolution, the spectral sensitivity of our eyes matches the visible spectrum of the sun.
At sunset or sunrise, when the sun is in the horizon, sunlight travels through a much greater layer of atmosphere before it reaches the observer. As a result, the yellow to white sun is surrounded by spectacular colors of reds and oranges because of the depletion of even more violet-blue as well as green light, as seen in Figure 1. More often than not, sunsets are more vibrant than sunrises because of increased pollution that has accumulated throughout the day, causing more scattering (12). The scattered light that we measure from polymer solutions is caused by exactly the same mechanism that colors the skies at sunset and sunrise.


FIGURE 1: With sun in the horizon, light travels a longer distance as compared to the sun at high noon. Because most of the blue light is scattered or depleted, light reaching the observer is enriched with red light. This is the same light scattering phenomenon that is responsible for providing molecular weight and size information of polymers in solution.

Overview of Scattering from Polymer Solutions
A schematic of a generic light scattering apparatus is given in Figure 2. Vertically polarized light from a laser light source is focused onto a cell containing a series of dilute polymer solutions. Scattered light is measured by photodiodes situated at fixed angles around the cell. Because Rayleigh scattering is symmetrical about the x-axis (the direction of the beam), measurements are made from 0° to 180° or on opposite quadrants, from 180° to 360°. To avoid interference from the oncoming incident beam, measurements of 0° and 180° are avoided. The number of measurement angles depends on instrument design. A typical analysis with a standalone light scattering instrument involves measuring scattering intensity of a range of polymer concentrations as a function of scattering angle. The data are then analyzed with a double-extrapolation procedure formulated by Zimm (13). With this graphical approach, scattering intensities are extrapolated to zero concentration and zero angle. The Rayleigh equation is then used to determine the weight-average molecular weight, Mw, the z-average radius of gyration, Rg,z, and the second virial coefficient, A2, of a polydisperse sample. With an online SEC light scattering detector, these properties are measured at each elution volume increment that flows through the detector cell, generating molecular weight and radius-of-gyration distributions, along with their statistical averages.

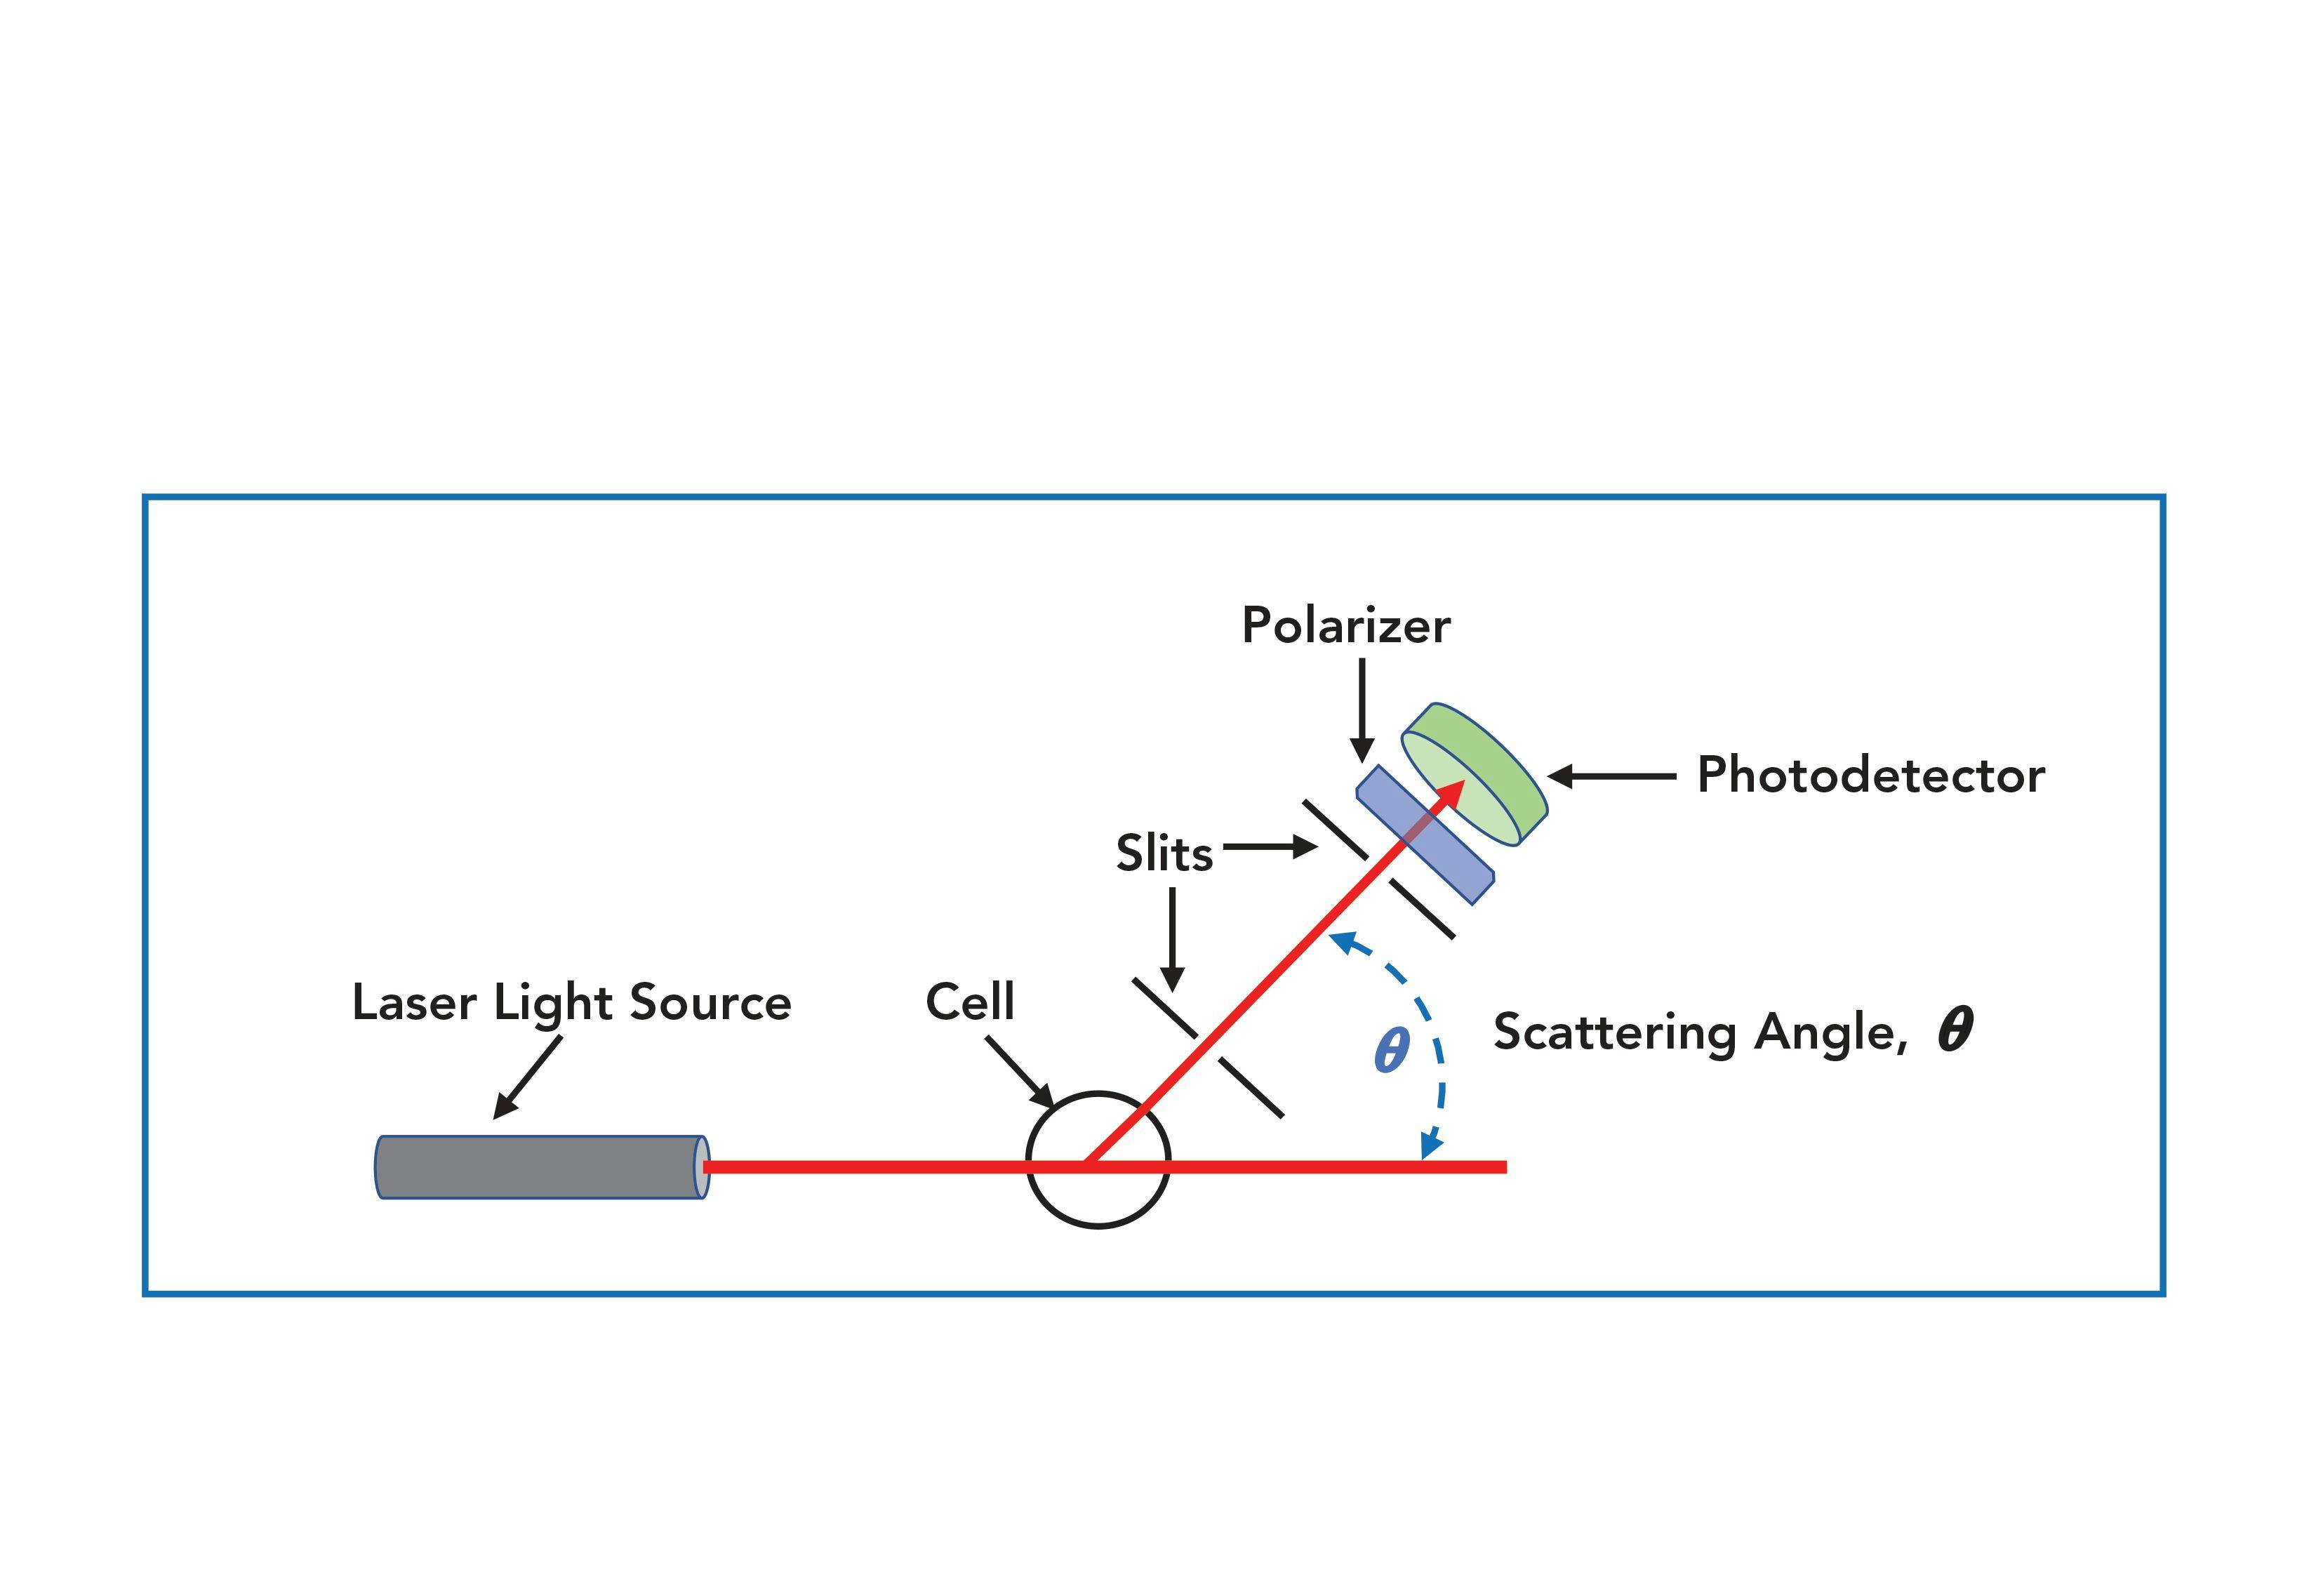
FIGURE 2: Schematic of a light scattering instrument, in which the angular dependence of scattered light intensities is measured as a function of polymer concentrations. Based on these data, the molecular weight, radius of gyration, and second virial coefficient can be determined. The only input information required are the specific refractive index of the polymer and refractive index of the solvent.
Fundamentals of Rayleigh Scattering
There is a continuous interplay between light and molecules (and atoms); the mode of interaction depends upon the energy (for example, wavelength or frequency) of the incident radiation, and the chemical and physical nature of target molecules. In the case of Rayleigh light scattering, the periodic fluctuations of the electromagnetic field induces a temporary dipole moment of electrons of the irradiated molecules, causing them to oscillate in phase with the electromagnetic field of the incident beam. The oscillating dipole moment broadcasts or scatters light of the same frequency of the light source, uniformly in all directions. Considering that energy is almost instantaneously transferred to and released from irradiated molecules (at 10-14 to 10-15 s) (14), Rayleigh scattering is an elastic process. In other words, scattering occurs only when the incident beam is in contact with target molecules.
Rayleigh scattering refers specifically to scattering from dispersed molecules (or particles) whose molecular radius is less than roughly 0.05 times the wavelength of the incident radiation (15). For larger molecules or particles, the scattering distribution becomes more complicated, resulting in a series of minima and maxima, referred to as Mie scattering (5).
We start by examining Rayleigh scattering from a single molecule in vacuo (1–4,13,16), irradiated with vertically polarized light of intensity (Io). This relationship is shown in equation 1, where i´s is the intensity of scattered light measured at any angle, λo is the wavelength of the incident beam in vacuo, and r is the radial distance from the scattering molecule to the observer:


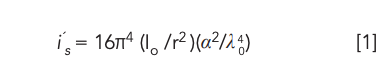
where α is the polarizability of the molecule, a measure of the extent or ease in which orbital electrons can be deformed (form temporary dipoles) in an electric field; in this case, the applied field is the electromagnetic radiation of the incident light. The λ-4 dependency is one of Lord Rayleigh’s many discoveries that he worked on from 1871 to 1899. This finding was used by John Tyndale (1820–1893), another physicist and colleague of Rayleigh, to explain why the sky is blue (11). Incidentally, Rayleigh received the Nobel Prize in 1904 for his discovery of argon in air.

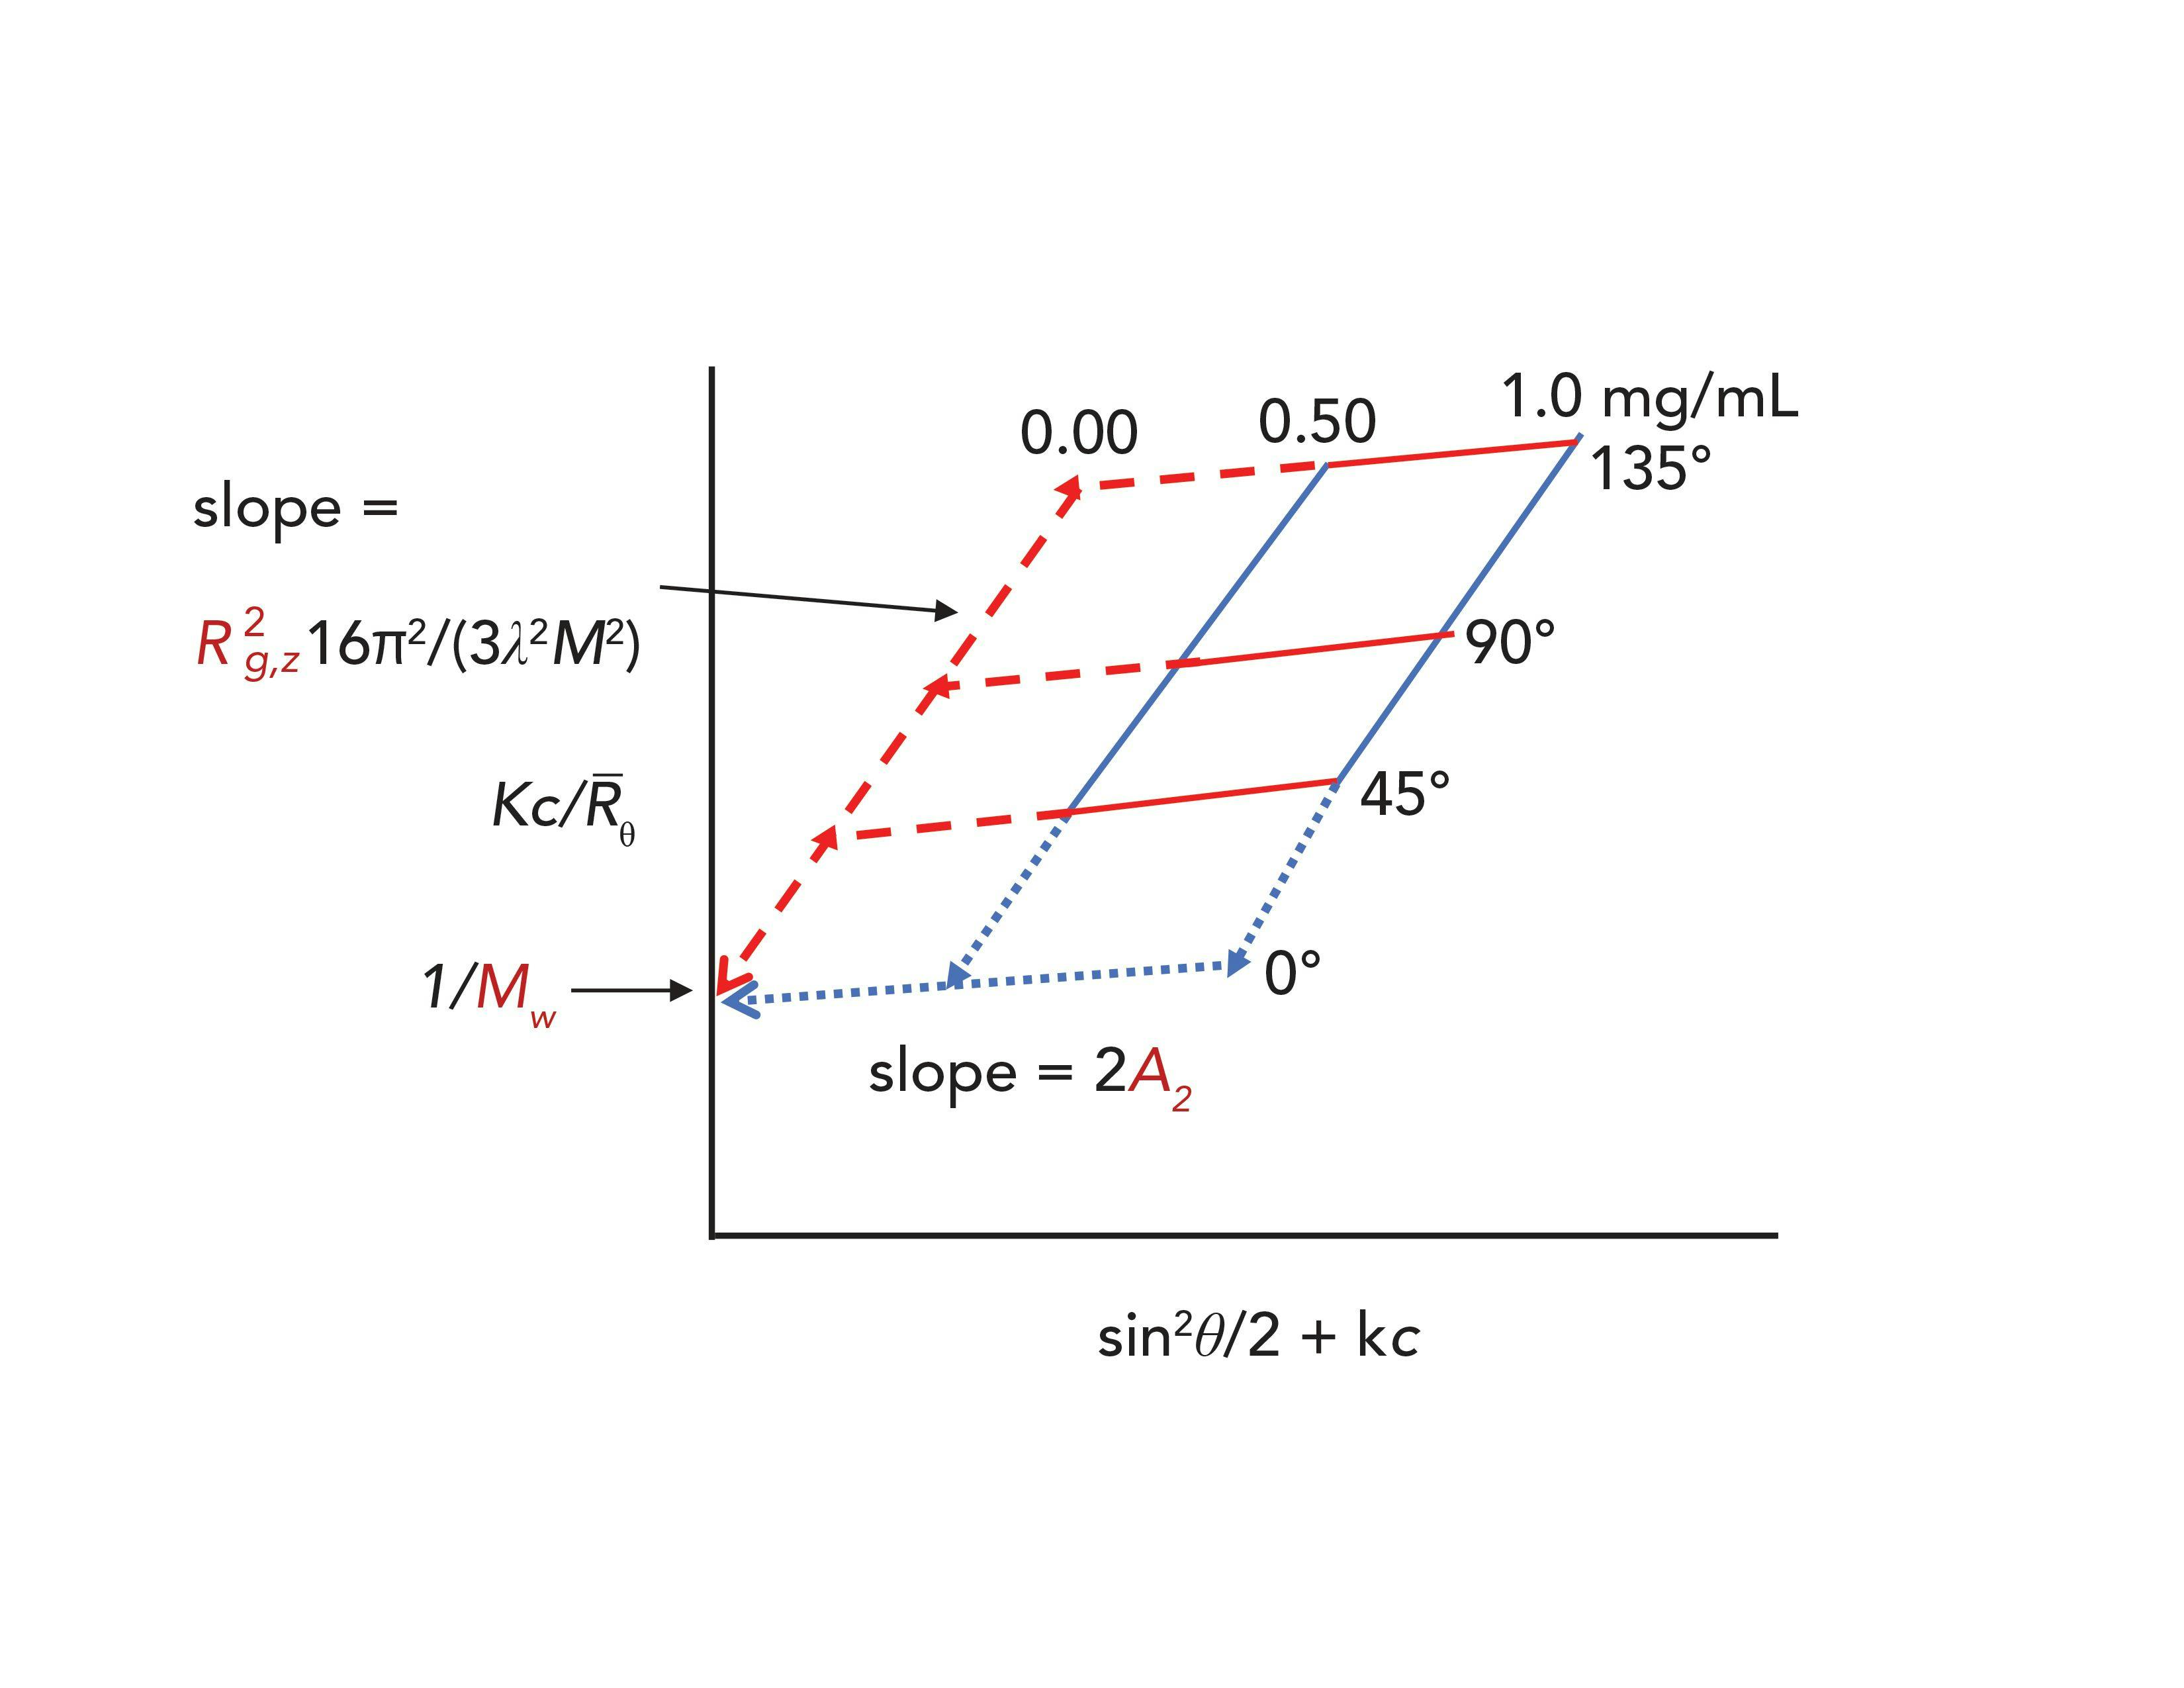
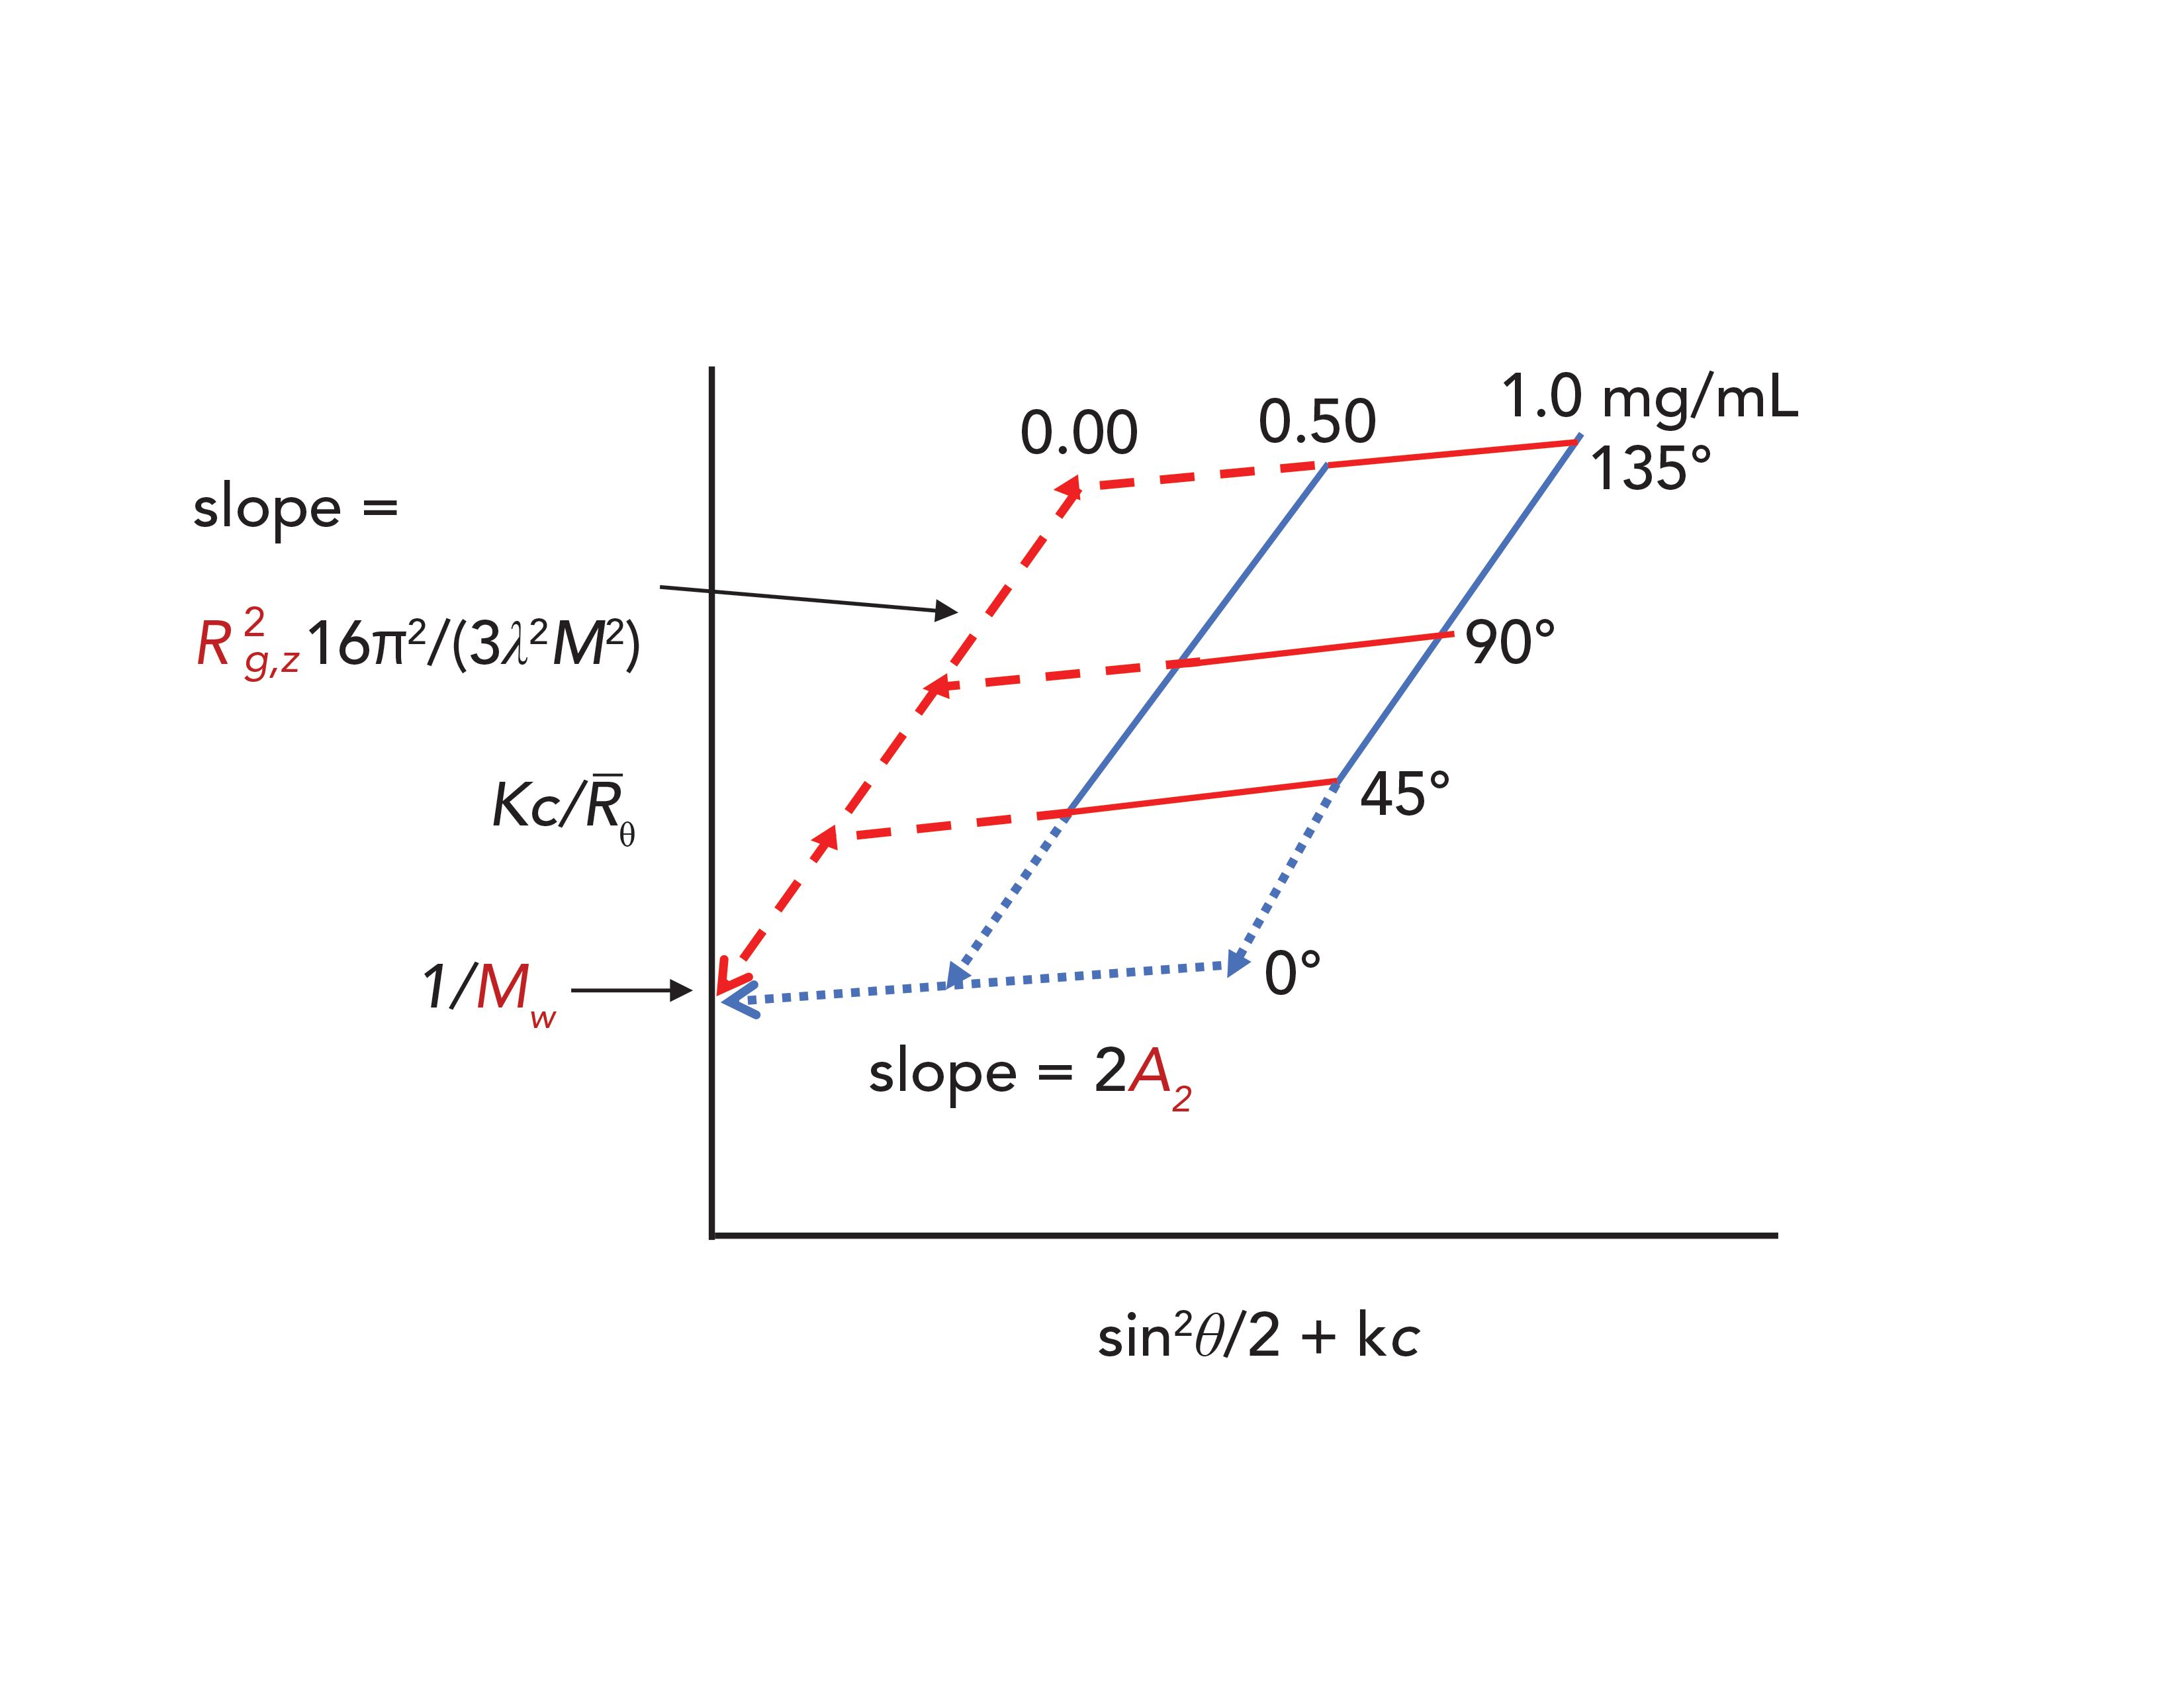
FIGURE 3: An example of a typical Zimm plot of a polydisperse polymer, in which Kc ⁄ Rθ is plotted against sin2 (θ/2)+kc, where Rθ is the excess Rayleigh ratio, K is an optical constant, c is polymer concentration, k is an arbitrary constant, and λ is the wavelength of light through the polymer solution. In this example, Rθ values of two polymer concentrations, measured at three angles, are extrapolated to zero concentration and zero angle. The weight-average molecular weight, Mw, z-average radius of gyration, Rg,z and second virial coefficient, A2, are obtained from the y-axis intercept and the two extrapolated slopes.
The Rayleigh Equation
The Rayleigh equation is used with Zimm’s extrapolation procedure for calculating molecular weight, radius of gyration, and the second virial coefficient from light scattering measurements of dilute polymer solutions. This section unravels the complexity of Rayleigh equation to facilitate its use.
Considering that equation 1 describes scattering from a single molecule in vacuo, i´s, it is recast to reflect the scattering intensity, i´s,p, from a given volume, V, and concentration, c, of a polymer in solution:


Here NA is Avogadro’s number and M is the molecular weight of the polymer. The wavelength of the incident beam in vacuo, λo, now becomes the wavelength of light, λ, as it passes through the polymer solution, λo/no, where no is the refractive index of the solvent, which is very close to the polymer solution. Molecular polarizability, α, is defined as


where dn/dc is the specific refractive index (or refractive index increment) of the polymer in solution. Substituting equation 3 into equation 1, we obtain the following:


This cumbersome expression is made more manageable by combining all terms that can be measured beforehand into an optical constant:

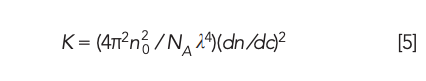

Thus, equation 5 reduces to the following:


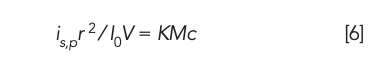
We must digress here to clear up a source of confusion: equation 6 represents the scattering intensity of a polymer that happens to be in solution, which is not the same as the scattering intensity from a polymer solution. In order to determine scattering from the polymer, we need to subtract the normalized scattering of the solvent, is,solvr2 ⁄ I0V, from that of the polymer solution, is,solnr2⁄ I0V, both of which are determined experimentally:


Here it is worth stressing that equation 7a tells us that the normalized scattering intensity of the solvent (or mobile phase baseline) must be subtracted from the normalized scattering intensity of a polymer solution (or SEC peak), to obtain the normalized scattering intensity of the polymer in solution. For convenience, these three terms are changed into light scattering notation:

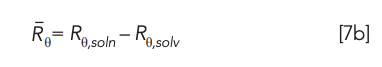

In honor of Lord Rayleigh, the first term is called the excess Rayleigh ratio, that is to say, the polymer in solution is causing “excess” scattering in comparison to the solvent; the other two terms are the Rayleigh ratio of the polymer solution and the Rayleigh ratio of the solvent, respectively. Please note that only the excess Rayleigh ratio is utilized for data analysis:


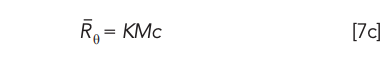
To account for nonideal behavior, KMc must be corrected for both polymer–polymer interactions and destructive interference of scattered light. These corrections, consisting of the second virial coefficient, 2A2c, and the particle scattering function, P(θ), are incorporated into equation 7c as follows:

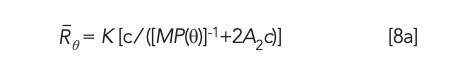

Equation 8a is rearranged to give us a more convenient expression:


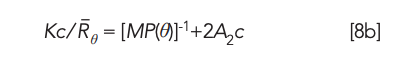
The particle scattering function, P(θ), is a power series in which the first two terms are


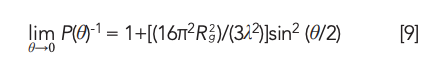
where R2g is the root-mean-square radius of gyration. Substituting equation 9 into 8b and rearranging it, we obtain our working equation:

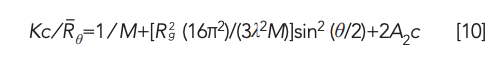

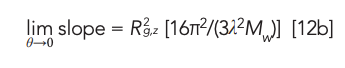
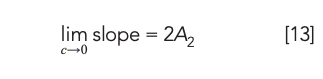
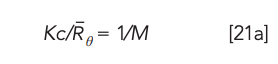
from which M, Rg, and A2 are determined using Zimm’s method. As discussed in detail in a subsequent section, Zimm’s double-extrapolation procedure consists of plotting Kc ⁄ Rθ against sin2 (θ/2) plus Kc ⁄ Rθ against c on the same graph (with the same ordinate and abscissa). Thus, we have two lines that intersect the y-axis at 1/M, with two slopes that are equal to [(R2g16π2)/(3λ2M)] and 2A2.
The Practice of Light Scattering
Specific Refractive Index (dn/dc)
The specific refractive index, or refractive index increment of a polymer in solution, dn/dc, is a measure of its molecular polarizability, α (equation 3), or oscillating dipole of a polymer induced by the electromagnetic radiation of the incident beam. It represents the change of refractive index of a polymer with respect to its concentration. In other words, macromolecules must be in random motion for there to be a measurable amount of scattered light. For example, if molecules were perfectly aligned and immobilized, like in a perfect crystal, there would be no detectable scattered light because of total destructive interference (3,5).
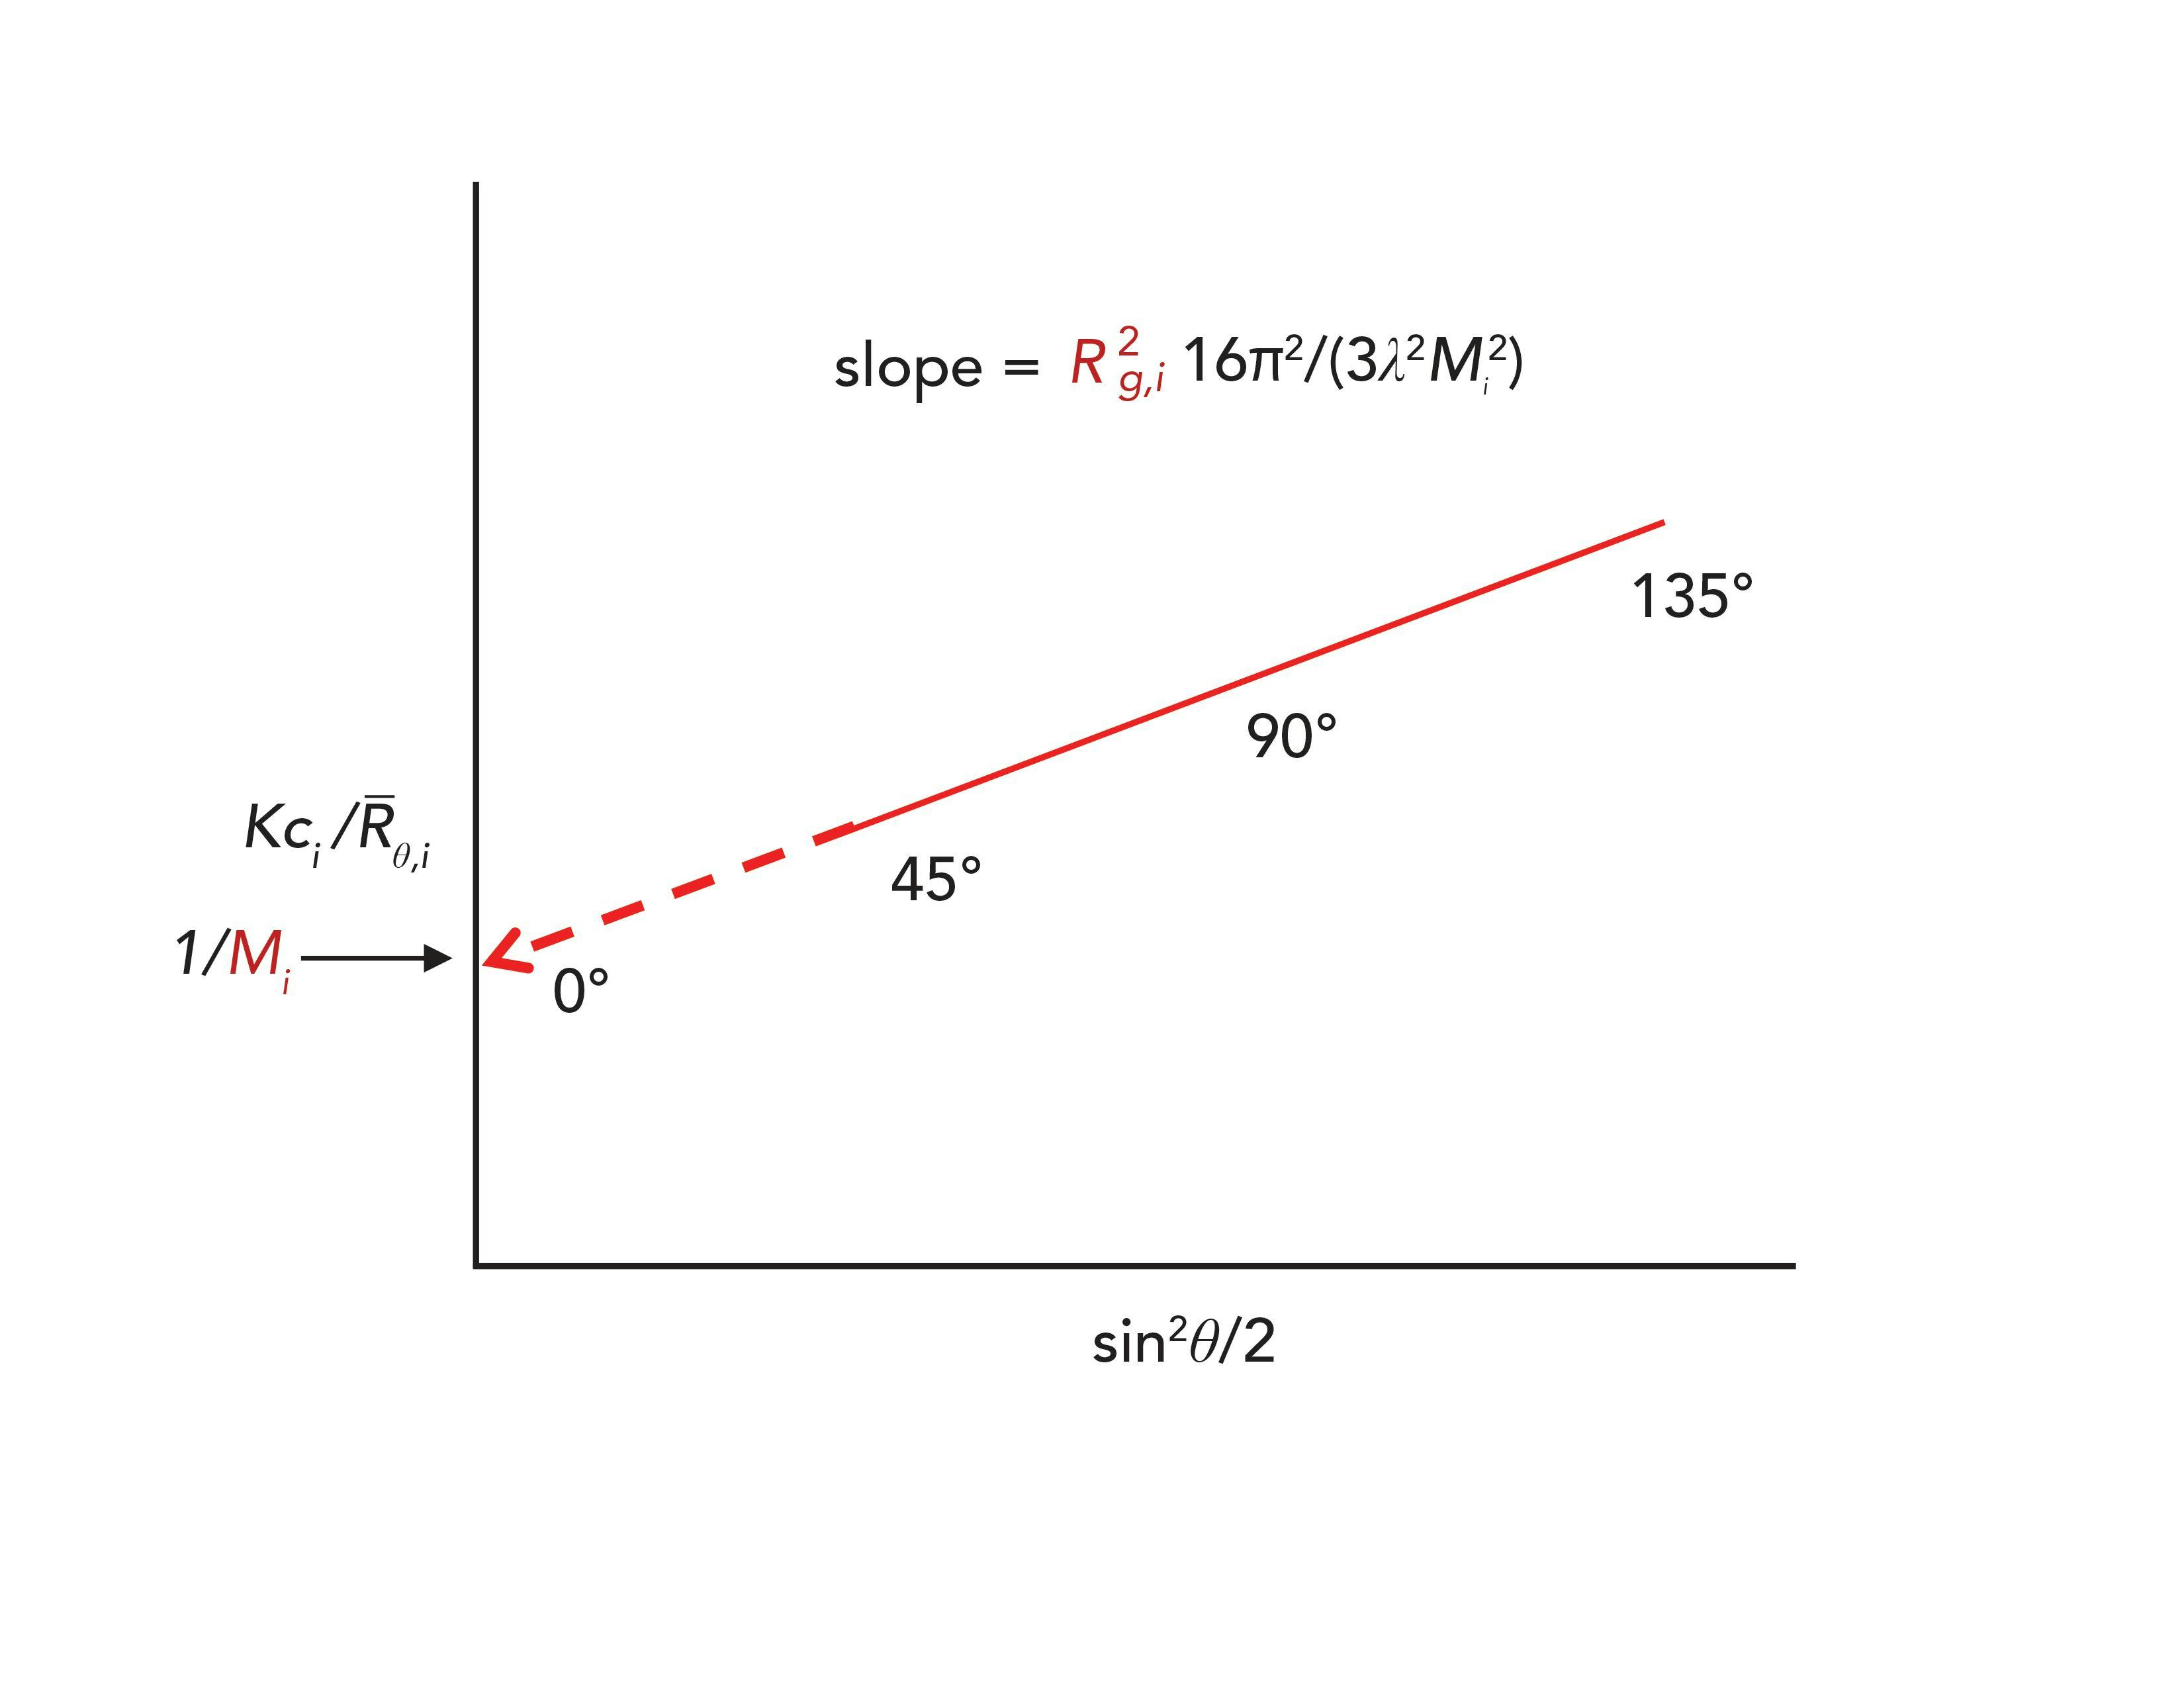
FIGURE 4: A snapshot of a partial Zimm plot from an SEC/multiangle light scattering detector at elution volume increment i. Note the absence of a concentration dependency slope; as a result, A2 cannot be measured unless several higher polymer concentrations are injected.

This term is used to calculate the optical constant, K (equation 5), thus it must be accurately known. With the exception of polyelectrolytes, the specific refractive index is easily measured for most polymers. It is worth repeating that difficulties arise when analyzing lower molecular weight samples, especially oligomers, in which case, dn/dc is usually a function of molecular weight. In these situations, dn/dc must be measured over a range of molecular weights of a given polymer type, and appropriate values applied to different regions of the chromatogram. The specific refractive index can be conveniently and accurately measured with an online differential refractometer detector utilized in SEC. With this detector, the refractive index of a polymer solution is measured against pure solvent, so that the detector response is equal to n - n0. Owing to the high sensitivity of this instrument, extremely low polymer concentrations can be used, eliminating concentration-dependent curvature when n - n0 is plotted against c. As a result, dn⁄dc can be obtained from the slope. To obtain a measurable polymer scattering intensity, values must be at least 0.05 mL/g (3), depending on the sensitivity of the instrument.
Particle Scattering Function, P(θ), and Radius of Gyration, Rg
When macromolecules are irradiated with vertically polarized light, the intensity of scattered light decreases as the scattering angle is increased from 0o to 180o, an effect referred to as molecular anisotropy. The decreased intensity, or angular dissymmetry, results from the destructive interference of wavefronts as the incident beam impinges upon different segments of a polymer chain. The particle scattering function, P(θ), is a measure of angular dissymmetry, from which the radius of gyration, Rg, is obtained.
Although the radius of gyration is typically determined from Zimm’s double-extrapolation procedure, a less commonly employed approach is the dissymmetry method, details of which are provided in this article. Regardless of the method used, solvated macromolecules must be sufficiently large and the instrument sensitive enough to detect small scattering intensity differences between angular measurements.
From a theoretical point of view, anisotropy is present in all molecules (5), the degree of which depends on the wavelength of the incident beam and the radius of gyration of the polymer. Nevertheless, a radius-of-gyration lower limit of about 10 nm has been the norm for instruments with a red-light source; however, a newly designed instrument with low noise characteristics and high sensitivity, was recently introduced by Tosoh Bioscience. This instrument, which uses a green (505 nm) laser diode, has the capability of measuring radii of gyration well below 10 nm, as discussed in the next article (Part X).
Second Virial Coefficient
The second virial coefficient, A2, is a concentration-dependent parameter used to correct for nonideal behavior of polymer solutions. It is a useful parameter for characterizing the thermodynamic properties of polymers in solution, specifically, interactions among solvated macromolecules. Under an ideal condition, such as thermodynamic equilibrium, A2 = 0. Because the second virial coefficient in good solvents is positive, concentration corrections are typically required; however, when light scattering is used as an SEC detector, polymer concentrations are sufficiently small so that the A2c term in equation 10 can be ignored. Nevertheless, the second virial coefficient of the polymer dissolved in mobile phase can be determined by injecting a series of higher polymer concentrations.
Zimm’s Method
In this section, we demonstrate the use of equation 10, in conjunction with Zimm’s method, for generating Mw, Rg, and A2. In practice, Zimm’s double extrapolation procedure consists of plotting Kc ⁄ Rθ against sin2 (θ/2)+kc, where k is an arbitrary constant used to spread out data points. Because of the complex nature of these plots and data analysis, we will first present an overview of Zimm’s method as applied to a standalone light-scattering instrument before proceeding with light scattering as an online SEC detector.
At the start of an analysis, photodetectors are normalized and the Rayleigh ratio of the pure solvent is measured, Rθ,solv (equation 7b). The refractive index of the solvent and specific refractive index of the polymer, used to calculate the optical constant, K (equation 5), are recorded. In this example, which is depicted in Figure 3, Kc ⁄ Rθ values are measured at 45°, 90°, 135° for two polymer concentrations, 0.5 and 1.0 mg/mL. The six data points are tied together by solid lines forming a grid-like pattern. For each angle, the two polymer concentrations are extrapolated to zero concentration (dashed red lines). In a similar manner, each of the two concentrations are extrapolated to zero angle (dotted blue lines). Finally, the extrapolated zero-concentration and zero-angle data points are tied together with red dashed and blue dotted lines, respectively. The following results are thus obtained: The molecular weight is equal to the reciprocal of the y-axis intercept of the two extrapolated slopes:


For a polydisperse sample:


Provided that the polymer exhibits measurable dissymmetry, Rg is computed from the angle-dependency slope, extrapolated to zero angle (red-dashed line).
For a monodisperse polymer:


For a polydisperse polymer:


If the polymer concentrations are sufficiently high, the second virial coefficient can be measured from the concentration-dependency slope, (blue dotted line):


Light Scattering as an SEC Detector
Online light scattering detectors are ideally suited for SEC because they have sufficient sensitivity for detecting low polymer concentrations. Based on the fact that light scattering detectors measure the absolute molecular weight at each elution volume increment, peak broadening corrections are usually not required, provided that the scattering volumes are small. Even for columns with poor resolution, a reliable weight-average molecular weight of the injected sample can be obtained, as well as a weightaverage cumulative distribution. The only requirements for this detector are that the corresponding concentration of each elution volume increment must be measured, and the lag time between detectors must be corrected. UV and differential refractive index detectors are typically used for SEC.
As for any light scattering measurement, the refractive index increment of the polymer in the mobile phase, and the refractive index of the mobile phase must be accurately known. Owing to the molecular weight dependency of the specific refractive index, errors can occur when analyzing polymers that contain low molecular-weight components, especially if less than 104 g/mol. Also, care must be taken to use the correct specific refractive index when analyzing copolymers that are chemically heterogeneous. Furthermore, because detector sensitivity is proportional to molecular weight, the low-molecular weight region of the distribution may not have adequate light scattering response, thereby skewing the results. A discussion of these and other limitations are detailed in references 7–10.
There are two modes for light scattering detectors: multiangle light scattering (MALS) and low-angle (LALS) light scattering. Some detectors can measure scattering only at low angles while others include both capabilities. As described in the following sections, data analysis will differ depending on the type of instrument used.
Multiangle Light Scattering (MALS)
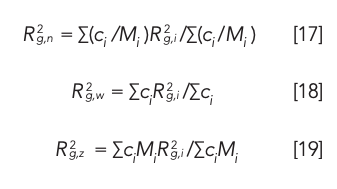
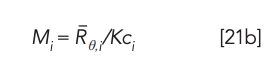
Measurements In this example, measurements are made at 45°, 90°, and 135°, and a concentration detector is placed in series with the light scattering instrument. Elution volumes of both detectors are temporally merged by using the time lag between detectors. Polymer concentrations that enter the detector cell are quite low because of the separation process and peak broadening; as a result, the second-virial-coefficient term, A2c, in equation 10 can usually be ignored. Therefore, a modified Zimm plot is used, in which the computer generates Kci ⁄ Rθ,i versus sin2(θ/2) for the three angles, where ci and Rθ,i are the polymer concentration and excess Rayleigh ratio, respectively, at each elution volume increment, i, as shown in Figure 4. Values of Mi and Rg,i are obtained from the intercept (equation 11a) and slope (equation 12a), respectively. With these data, the molecular weight distribution of the injected sample is obtained, from which statistical average values are calculated as follows:

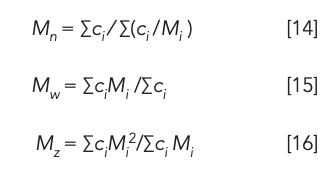

In a similar manner, the radius-of-gyration distribution, Rg = f (MW), also can be plotted, and radius-of-gyration averages computed:


The radius of gyration can only be obtained if there is a quantifiable slope; that is, a polymer within a given elution volume range must be sufficiently large to result in a measurable angular dissymmetry. This means that Rg values in the low-molecular-weight end of a distribution may be unreliable, yielding biased radius-of-gyration averages.
With a known radius of gyration data, an average long-chain branching index, g, can be measured, including a branching index distribution, g = f(MW). This is accomplished by comparing the mean-square-radius of gyration of a branched polymer, R2g,b, to that of a corresponding linear polymer, R2g,l, of the same molecular weight:


For a comprehensive review of these and other applications of SEC/light scattering, see references 7–10.
Low-Angle Light Scattering (LALS) Measurements
LALS, by themselves, cannot be used for determining radius-of-gyration measurements; nevertheless, data analysis with this technique is greatly simplified; the Rayleigh equation (equation 10) is reduced to:


Thus, at each elution volume increment,


from which the molecular weight distribution and statistic averages are computed via equations 14 to 16.
Summary
Light scattering is the ideal detector for SEC, because it provides molecular weight and radius-of-gyration distributions, in addition to corresponding statistical averages without column calibration. With this detector, the only information that is required is the specific refractive index of the polymer and the refractive index of the mobile phase.
By using low injection concentrations, the Rayleigh equation is reduced from three (M, Rg, and A2) to two unknowns (M and Rg), greatly facilitating data analysis. Moreover, if low-angles measurements are used, molecular weight can be determined directly without resorting to graphical analysis, however, molecular size information is lost.
References
(1) Lord Rayleigh, Philos. Mag. 47(287), 375–384 (1899).
(2) J.J. Hermans, Eds., Polymer Solution Properties Part II: Hydrodynamics and Light Scattering (Dowden Hutchinson & Ross, Stroudsburg, Pennsylvania, 1978).
(3) P. Kratochvil, Classical Light Scattering from Polymer Solutions (Elsevier, Amsterdam, The Netherlands, 1987).
(4) A.G. Marshall, Biophysical Chemistry: Principles, Techniques, and Applications (John Wiley and Sons, New York, New York, 1978), pp. 471.
(5) P. Munk, Introduction to Macromolecular Science (John Wiley and Sons, New York, New York, 1989).
(6) B.B. Weiner, Let There be Light: Characterizing Physical Properties of Colloids, Nanoparticles, Polymers & Proteins Using Light Scattering (Bruce Bradley Weiner, Port Jefferson, New York, 2019).
(7) J.S. Lindner and S.S. Huang, in Modern Methods of Polymer Characterization, H.G. Barth and J.W. Mays, Eds. (John Wiley and Sons, New York, New York, 1991), Chpt. 9.
(8) S. Podzimek, Light Scattering, Size Exclusion Chromatography and Asymmetric Flow Field Flow Fractionation (John Wiley and Sons, Hoboken, New Jersey, 2011).
(9) A.M. Striegel, W.W. Yau, J.J. Kirkland, and D.D. Bly, Modern Size-Exclusion Chromatography (John Wiley and Sons, Hoboken, New Jersey, 2009).
(10) C. Jackson and H.G. Barth, in Handbook of Size Exclusion Chromatography and Related Techniques, C.S. Wu, Ed. (CRC Press, Taylor & Francis, Boca Raton, Florida, 2nd ed., 2009), Chpt. 4.
(11) G. Hoeppe, Why the Sky is Blue (Princeton University Press, Princeton, New Jersey, 2007).
(12) S.F. Corfidi, The Colors of Sunset and Twilight. https://www.spc.noaa. gov/publications/corfidi/sunset/. (accessed September 2014).
(13) B.H. Zimm, J. Phys. Chem. 16, 1093– 1099 (1948).
(14) D.A. Skoog, F.J. Holler, and S.R. Crouch, Instrumental Analysis (Cengage Learning, Andover, Massachusetts, 2007) M. Kerker, The Scattering of Light and Other Electromagnetic Radiation (Academic Press, NY, 1969).
(15) B.H. Zimm, R.S. Stein, and P. Doty, Polym. Bull. 1, 90–119 (1945).
Howard G. Barth is with Analytical Chemistry Consultants, Ltd., in Wilmington, Delaware. Direct correspondence to: howardbarth@gmail.com.


 Xolair technical development team leader from Phase 2 through licensing. Reed is a CASSS Distinguished Fellow and has been an author of 49 publications, including 14 as corresponding author. He was a leader in the development of Roche-Genentech’s strategies for post-approval comparability exercises, clinical and commercial specifications, the identification of critical quality attributes, linking structure to function, the use of a risk-based Quality by Design approach for control strategy development, unexpected protein modification identification, and curiosity-based thinking.")


