Current Applications of UHPLC in Biotechnology Today, Part I (Peptide Mapping and Amino Acid Analysis)
LCGC North America

A description of the use of UHPLC in the biopharmaceutical industry to characterize drug substances through peptide mapping and amino acid analysis
Ultrahigh-pressure liquid chromatography (UHPLC) is very useful for four key methods used in biotechnology: peptide mapping, amino acid analysis, intact protein analysis, and glycoprofiling. The first two methods are covered here.
Biopharmaceuticals have become the major products of the biotechnology industry around the world today (1–4). Biopharmaceuticals include recombinantly derived proteins, peptides and or antibodies, with glycoproteins and antibodies being the most common and perhaps most important (5–9). Meeting the requirements of the US Food and Drug Administration or other regulatory bodies for such products involves a demonstration of drug substance characterization (as fully as possible), lot-to-lot and batch-to-batch comparisons, stability studies, impurity profiling, glycoprofiling, and numerous other analytical studies (8), all of which can take years to derive, interpret, and profile in the final Chemistry, Manufacturing and Controls documents (CMC). (And all that information is separate from clinical safety and efficacy studies).
In this and subsequent columns, we endeavor to describe the most important and useful analytical methods used in the biopharmaceutical industry to accomplish the above mentioned studies, and especially to meet CMC documentation for regulatory submittals. Clearly, conventional high performance liquid chromatography (HPLC) and mass spectrometry (MS) have evolved to become perhaps the most informative and popular techniques in routine usage today to meet these goals. However, as this column will describe, both of these methods have and will continue to evolve and improve. HPLC is now being replaced by ultrahigh-pressure liquid chromatography (UHPLC). MS also is evolving, in both the hardware and software. Instruments provide better mass accuracy, resolution, and sensitivity with increased ruggedness and ease of use. Software enhancements provide powerful tools for interpreting the very large body of data generated in characterizing a protein pharmaceutical. It is virtually impossible in today's biotech world to meet regulatory requirements without the heavy use of these two, now totally complementary analytical methods and instrumentation, combining them with electrospray ionization (ESI) in UHPLC–ESI-MS.
The examples in this column will use Waters instrumentation and methods, but we hasten to indicate that much or most of that which follows is entirely possible and feasible on other vendors' UHPLC instrumentation, with some caveats. The pressure limit of some chromatography instruments is not compatible with the high back pressures commonly encountered in UHPLC. To some extent, raising the temperature can obviate this restriction by reducing the viscosity and, therefore, back pressure. When following that approach, users must monitor changes in selectivity with temperature. Of course, by reducing the system pressure, one does not fully exploit the promise of UHPLC. In any case, the essence of UHPLC is improving resolution and sensitivity by reducing dispersion. An increase in throughput often accompanies these benefits.
Why Use UHPLC Rather than HPLC for Biopharmaceuticals?
There is already an enormous amount of literature on the application of UHPLC to small molecules, especially conventional pharmaceuticals, which were the very first applications emphasized for UHPLC. More recently, however, there has been a growing emphasis on using UHPLC for biopharmaceutical applications, especially for peptides, proteins, and antibodies (10–14).
The reason for moving to UHPLC for biopolymer separations is that the data obtained using HPLC with biopolymers has never compared favorably with the same data for low molecular weight small-molecule drugs (or other organics) (15–18). Biopolymers usually are large molecules with a high molecular weight, and their shapes and sizes often fluctuate as a function of temperature, pressure, and especially mobile-phase conditions. Also, biopharmaceuticals often contain many variant structures, or isoforms, as a part of the total drug substance (DS) or finished drug product (DP), and those specific analytes have been problematic for HPLC separations.
As a result of the challenges presented by biopolymers, observed peak shapes and column efficiencies have been poor in biopharmaceutical separations using HPLC, especially when compared with separations of small-molecule drugs. In general, especially for large proteins and antibodies (less so for peptides), conventional HPLC has suffered from not being able to routinely provide high efficiency (high plate count) peaks, narrow band width, sharp and symmetrical peak shapes, high peak capacity, low height equivalent to theoretical plate (HETP), baseline resolutions, fast sample throughput, low retention factors, and baseline resolutions for complex mixtures of proteins, peptides, or antibody variants.
Also, there is the ever-present issue for biopolymers of slow molecular diffusion and poor mass-transfer properties. HPLC performance with biopolymers also has been hindered by the three-dimensional distribution of chemical functional groups on proteins — such as hydrophobic and hydrophilic patches on the surface — which generally do not exist for small-molecule analytes.
The complexity of the molecular structure of proteins also has complicated the application of UHPLC to biopharmaceutical separations. Nevertheless, the performance of biopharmaceutical separations using UHPLC has proven superior to those using HPLC. In particular, with UHPLC, the ability to resolve, identify, and quantitate such variants (isoforms) is increased, which is a very desirable benefit (Figures 1 and 2). Table I summarizes the most important advantages of using UHPLC for biopharmaceutical separations today.

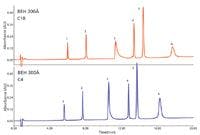

Figure 1: Typical UHPLC chromatograms for a mixture of simple proteins, as a function of packing material chain length, C18 vs C4 (24). Peaks: 1 = ribonuclease, 2 = cytochrome c, 3 = BSA, 4 = β-lactoglobulin, 5 = enolase, 6 = phosphorylase B.
The simple substitution of small column particles has proven insufficient to realize the benefits of improved resolution, sensitivity, and speed that UHPLC is expected to deliver. The most successful developments have combined the small particles of UHPLC with new column chemistries developed specifically for macromolecules.

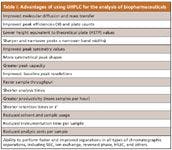
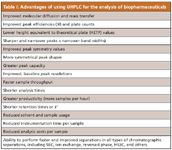
Table I: Advantages of using UHPLC for the analysis of biopharmaceuticals
Figure 1 illustrates modern UHPLC conditions for a mixture of standard proteins. The base particle size, pore diameter, and bonding are held constant while the bonded phase chain length is varied (C18 or C4). In general, there is an improvement in peak shape for all the proteins with reduced (shortened) chain length. The improvement with reduced chain length is most apparent for phosphorylase (peak 6), where the peak is much narrower. These results suggested that a bonded ethylene hybrid particle with 300-Å pores and a C4 bonded phase performed best for typical protein separations.
This UHPLC separation technology can provide the basis for a more detailed comparison of protein biopharmaceuticals. Figure 2 illustrates a direct comparison of two monoclonal antibody (MAb) products, one made by an innovator company and the other a generic, or "biosimilar" product. The two protein samples were reduced and alkylated so that the light (LC) and heavy chains (HC) could be compared using UHPLC–MS separation and detection to identify differences, if any, between these two products. The light chains shown in Figure 2a are identical. In contrast, the heavy chains (Figure 2b) show consistent mass shifts of approximately 32 Da for all protein glycoforms in the biosimilar compared to the innovator company's drug it was intended to replicate. Mass shifts of this magnitude (that is, multiples of 16 Da) are often indicative of oxidation. In this case, when the analysis was extended to include UHPLC–MS peptide mapping, that mapping revealed that the biosimilar product had two substitutions in the amino acid sequence (22). Some glycosylation pattern differences were also detected (Figure 2). What is relevant for the purposes of this discussion is that only UHPLC with optimized column chemistry has been able to provide sufficient peak shapes and resolution for both the light and heavy chains as well as for the intact, nonreduced, parent MAbs. Thus, these are significant advantages in the application of modern UHPLC for the characterizations of biopharmaceuticals such as these MAbs as well as other glycoproteins and simpler protein drug substances.

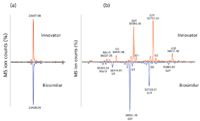
Figure 2: Typical UHPLCâMS chromatograms of reduced monoclonal antibody (MAb) variants, comparing an innovator and biosimilar product: (a) Light chains of the innovator and biosimilar MAbs are identical; (b) heavy chain of the biosimilar MAb shows a consistent mass shift of ~32 Da for all protein glycoforms compared to the innovator product. Glycosylation pattern differences were detected (25).
The above examples illustrate two applications involving UHPLC analysis of proteins or antibodies that are now typical, but this work was prefaced by work by Jorgenson and colleagues in the early 2000s (11,19,20). Much of the initial, exploratory work involving very high pressures in HPLC was done by Jorgenson's group, and that work later became widely available beginning with commercialization by Waters (Milford, Massachusetts). This new class of separation science drastically changed how LC would be used in the future for biopolymers, with the initial emphasis on proteins, peptides, and MAbs. The use of very-small-diameter particles, superficially porous or nonporous packings, and relatively high flow rates has led to the ability to reproducibly perform biopolymer separations in much shorter timeframes than possible by conventional HPLC, with excellent baseline resolution, very sharp peaks, high plate counts, high peak capacities, and high sample throughput (11,20). And, this is true whether one considers reversed-phase chromatography, ion-exchange exchange chromatography, hydrophilic interaction chromatography (HILIC), or even size-exclusion chromatography (SEC)! Separations are possible today that were never before possible, such as complex mixtures of proteins often found in proteomics (19). Such separations have become quite commonplace in all types of biopolymer separations, even with high molecular weight antibodies, as shown in Figure 2 (21–23).
In some work recently described by Jorgenson et al. (19), an experimental UHPLC system delivering about 25,500 psi was used, interfaced with ESI-time-of-flight (TOF)-MS, for an Escherichia coli protein extract, on 1.5-µm porous particles (145-Å pores) in a 42 cm × 50 mm column, with a mobile-phase gradient from 25% to 60% acetonitrile–water at 0.25%/min, with an average peak width of 15 s and a peak capacity of 470. What is of interest in this particular, proteomics-related work, is the extreme narrowness and sharpness of all the protein peaks, throughout the entire chromatogram, with very high plate counts and excellent peak symmetries (as well as very high peak capacities for proteins). Such features of a proteomics chromatogram — especially the very high peak capacity for a complex mixture of proteins — would not be possible with any conventional HPLC system today. And, most of the protein peaks were deconvoluted to yield distinct molecular weights appropriate for proteins.
Four Key Methods for UHPLC: Peptide Mapping, Amino Acid Analysis, Intact Protein Analysis, and Glycoprofiling
Before we address specific application areas where UHPLC has demonstrated outstanding performance features, we need to indicate that these particular analytical methods and the use of UHPLC have proved useful in several areas of biopharmaceutical analysis. Four specific separation types have found wide utility throughout the biopharmaceutical discovery, development, and production cycle. These include protein separations, peptide mapping, glycoprofiling (glycan analysis), and amino acid analysis. These techniques are applied in the initial structural characterization of a potential new biopharmaceutical, the identification of structural variants, the location of individual modifications and their locations on the native protein, to demonstrate chemical equivalency of different batches, to optimize the various steps in the production process, to establish the suitability of a formulation, and to compare biosimilars to proprietary drug products. These four basic analytical application techniques are applicable to virtually all such pursuits needed to bring a new biopharmaceutical product to market, in as short a period of time as possible. It has become totally impossible to compete in today's biopharmaceutical marketplace without using such analytical techniques to their maximum advantage. And, it does not appear that this will change in the near future, but rather, that it will become more and more important to use these methods to reduce the time to market and profitability of new products.
In the modern biotechnology world, these four techniques appear to have become the most commonly used ones to meet CMC requirements. Of course, other separation modes can be useful in solving specific problems. For example, high performance capillary electrophoresis (HPCE) also has become a commonly used technique in peptide mapping, intact protein analysis, and glycoprofiling, and especially for isoelectric focusing. However, it still plays a secondary, complementary, or orthogonal role to UHPLC. In another example, to determine the presence of aggregates of an antibody, one would combine a light scattering or viscometry detector with HPLC or UHPLC, and that combination would provide more information than just doing direct light scattering without an initial separation. It also is true that many of these assays can be done by direct matrix-assisted laser desorption–ionization (MALDI)-TOF-MS methods, without an initial chromatographic separation. It is well-demonstrated, however, that these detection techniques become more powerful when the sample is first separated. The minor components are then more easily detected and the data are more easily interpreted.
As a result, the most commonly used techniques to perform peptide mapping, amino acid analysis, intact protein analysis, and glycoprofiling have all become UHPLC-based. There are numerous reasons for this fact, some already alluded to above. We describe these in the specific applications that follow.
UHPLC in Peptide Mapping
Let us start by first discussing the use of UHPLC in peptide mapping and why it is supplanting conventional HPLC methods. With the first appearance of UHPLC for routine use, many chromatographers recognized that the technique would enable high speed separations. That characteristic was attractive because HPLC runs for peptide mapping typically have been very long, on the order of hours. When UHPLC was first applied to real peptide mapping applications, however, the story proved not so simple. Figure 3 illustrates a direct HPLC-to-UHPLC comparison of a peptide map derived from phosphorylase B. The particle size of the C18 packing material was varied but the same gradient slope and total analysis times were used (24). What is evident in Figure 3 is the difference in peak capacity (Pc ), or the maximum number of peptide peaks that can be resolved in a given elution window or timeframe. In the HPLC chromatogram, the Pc is 372, whereas in the UHPLC case, it is 723, almost doubled. In the UHPLC chromatogram, the peak shapes are narrower and better baseline-resolved from all neighbors, and a larger number of peptides are baseline-resolved. The increased resolution provides more complete information about the protein sample, and that improved analytical quality is often more valuable than pure speed.

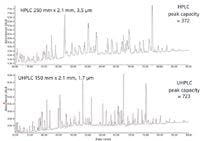
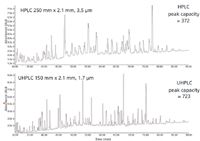
Figure 3: HPLC (top) and UHPLC (bottom) peptide maps of phosphorylase B (24).
This is an ideal situation for then eluting such analytes into ESI-MS, online with UHPLC, to determine the molecular weight of the parent peptide (peptide mass fingerprinting), and by MS-MS routines, simultaneously to determine peptide sequences and variant locations and identities. Improved chromatographic resolution simplifies the interpretation of the observed spectra and also ensures that low-abundance variant peptides will be detected.
The improved resolution of UHPLC addresses the needs of peptide mapping as used in the biopharmaceutical industry. Peptide mapping has become a routine analytical method to determine the exact structure of the parent protein, including unknown or unexpected variants, to locate specific modifications in that protein through its digests containing unique peptides, to demonstrate lot-to-lot chemical equivalencies, to do bottom-up or middle-down proteomics or protein identifications, to determine specific glycoprotein variants, to demonstrate drug-substance purity or homogeneity, to demonstrate drug-substance stability or impurities, to compare biosimilars with innovator products, and for several other regulatory and analytical purposes. It is arguably the most commonly used analytical technique in biotechnology today, and regulators have come to expect to see it as a part of any current CMC filings. It is hard to imagine any DS getting to market without using peptide mapping at various stages of its evolution. UHPLC is coming to dominate the possible methods that can be used for peptide mapping (for example, gel electrophoresis, HPCE, and so forth). Why is this so?
In using peptide maps for any of the above applications, it is essential to meet several important goals. Some of these include: achieving baseline resolution of all peptides; the ability to identify each and every peptide by online ESI-MS; maximal peak heights and peak areas; minimum total elution time; sharp, narrow peaks; maximal peak capacity; maximal plate counts; minimal usage of solvents; reproducible gradient slope; maximal sensitivity of peaks; and a larger dynamic range of peptide concentrations present. In general, UHPLC comes out ahead of HPLC in direct comparisons of all of these areas, but especially in increased resolution, improved peak shapes, reduced total run times, and higher peak capacities. As these benefits emerged in the early experiments, it became apparent that UHPLC combined the effects of physically reducing band-broadening through the use of small particles and of reducing secondary chemical interactions with the packing materials developed to be used as sub-2-µm particles. This combination of effects became most apparent when examining the effects of mobile-phase modifiers.
It is useful to recall that when first developing a reversed-phase peptide-mapping method, the mobile phase is modified to reduce or eliminate the charged functionalities of the peptides so that they retain on the hydrophobic surface. Acids protonate carboxyl groups and ion-pair reagents neutralize the positively charged basic side chains. Trifluoroacetic acid provides the best chromatography because it combines these effects. MS detection may, however, be compromised because the amount of trifluoroacetic acid used may cause ion suppression of the analytes or peptides in online ESI-MS. The ratio of peptide levels to trifluoroacetic acid concentration could lead to missed peptides, especially those at trace levels in any given sample. For this main reason, much work has been done to optimize peptide maps with formic acid, acetic acid, and similar non-ion-pairing reagents. With such modifiers, however, peak shape may suffer because of secondary interactions with the packing material. Figure 4 illustrates differences in the peptide maps possible when replacing trifluoroacetic acid with formic acid, with very similar gradients and total elution times (24). These are total MS ion chromatograms for formic acid and trifluoroacetic acid, all other UHPLC parameters held constant. The numbered peaks are the same peptides in the two mobile phases. Formic acid gives better signal intensity for MS than trifluoroacetic acid, for the above reasons. With trifluoroacetic acid, the peaks are retained longer because of better ion pairing than that observed with formic acid, as expected. When an ethylene-bridged hybrid (BEH, Waters) packing material is used for UHPLC, there is little difference in the peak shape between the two classes of mobile phase modifiers. However, if one looks at the average peak areas for the UV detection response (blue boxes) for both the trifluoroacetic acid and formic acid, one will note that they are very similar, which is desirable. This is not the case when comparing MS peak areas, also as expected.

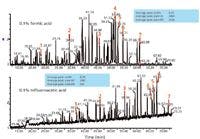
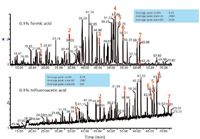
Figure 4: Effect of mobile phase modifier (formic acid, top, compared to trifluoroacetic acid, bottom) on selectivity and sensitivity (24).
The BEH packing material used for UHPLC derives its improved resolution not only from its small particle size but also from its inert surface chemistry. Performance is not only improved when using trifluoroacetic acid, as in Figure 3, but with all other, commonly used ion-pairing agents (for example, formic acid, acetic acid) in reversed-phase LC of such peptide maps (or, synthetic peptide mixtures).
With this understanding of the combined physical and chemical effects that serendipitously combined in UHPLC, it became apparent that there are certain general approaches to exploiting the benefits of UHPLC in biopharmaceutical peptide mapping. First, the technique is used for maximum resolution to find every structural variation that could exist in a particular sample, even at trace levels. This would be the preferred approach in drug discovery and early drug development activities. Second, with proteins that are well-characterized and understood, it is common to use UHPLC to reduce the analysis time without compromising analytical quality and reliability. Third, it is also possible to use UHPLC in focused peptide maps, as shown in Figure 5 (24). This figure is an illustration of how one uses such maps, especially useful when one wants to study a specific modification in the map, as quickly as possible. In such an application, a linear, shallow gradient is applied only around the peak or peaks of interest in the peptide map. A steeper gradient is applied before and after the region of interest, in this case that being the resolution of the oxidized peptide from the native, as well as from all others. More-polar peptide peaks are not retained, while less-polar ones are washed off at the end of the gradient. In this particular case, UHPLC allows for a total cycle time of 10 min, with the ability to analyze many more samples per unit time than with any other commonly used HPLC methods. This increased speed not only reduces the total time per analysis, but it also reduces the cost of materials and the instrumentation time per sample and can be completely automated. It is a very useful and practical technique to identify the specific location of an oxidation variant, for example, and to perform accelerated oxidation or stability studies with peroxide (or other) reagents. And, the total run time per sample using such focused peptide maps was 10 min in this instance.

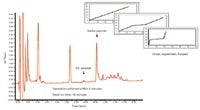

Figure 5: Focused peptide maps using UHPLC showing a 3â6-fold improvement in productivity (24).
Amino Acid Analysis Using UHPLC Methods
Amino acid analysis is a well established technique for determining all 20 common amino acids in proteins or peptides, as well as modified residues that might arise from posttranslational modifications. It is a well established method to determine the amino acid content of known or unknown proteins, to identify a known or unknown protein, to determine if variants of the protein are present, to quantitate a known protein, and to demonstrate lot-to-lot chemical equivalency for release testing (along with other tests, as mentioned above). Of course, it also can be used to make direct comparisons between biosimilars and innovator biopharmaceuticals. The same analytical technology is used to measure free amino acids as markers of nutrition and of metabolic states. This family of applications has become very important in the biopharmaceutical industry, for example, in monitoring the nutrient status of a growing cell culture as a function of time. The measurement is used to determine the feeding of the bioreactor and to optimize a particular clone for maximum production of good protein. As such, amino acid analysis is a well accepted and adopted analytical method in biotechnology, and it has been adapted to operate in the UHPLC framework (26–29).
The common expectation of amino acid analysis using UHPLC was that a much faster turnaround would be achieved. In practice, however, the value of UHPLC has proven different. The extra resolving power permits much better separation of the amino acids, so that the method is much more rugged and robust. Higher throughput is achieved because the results are more reliable and because the method does not require frequent adjustment or tweaking. Samples seldom need reanalysis because of questionable results. The method is indeed much faster than HPLC methods, of course, which is an additional bonus. Alternatively, this UHPLC separation can be interfaced with ESI-MS to determine the specific nature of any novel, modified amino acids. There are, of course, any number of reagent kits available today for users to develop their own UHPLC amino acid analysis for their particular requirements.
Figure 6 illustrates the application of this particular amino acid analysis method to recombinant human follicle-stimulating hormone (hFSH). The amino acid analysis of any protein requires hydrolysis of the protein before the analysis. The most common and generally useful technique, heating in 6 N HCl at 105 °C overnight, gives useful results. However, several amino acids are partially or completely degraded during the hydrolysis. An alternative procedure is required in which analytical values are obtained for those amino acids. For example, the sulfur-containing amino acids are particularly fragile. If good values are required for cystine and cysteine, the protein is reduced and alkylated before hydrolysis so that carboxymethyl-cysteine can be measured. If the best possible analytical results are also required for methionine, it would be preferred to oxidize the protein with performic acid so that cysteic acid and methionine sulfone are recovered for analysis. Because the alternative procedures may compromise the recovery of other amino acids, typical practice is the application of all the methods for a complete analysis where required. The result of this is shown in Figure 6 for FSH. The analyses are useful, and the value of the robust, rapid UHPLC technique is apparent. What is truly useful about bringing UHPLC to a very well established analytical technique like amino acid analysis is that it has immediate applications possible in biotechnology today. And, it can be as readily applied to protein analysis, peptide mapping, amino acid analysis, and any number of similar applications. Because this particular reagent, 6-aminoquinolyl-N- hydroxysuccinimidyl carbamate (6-AQC), has UV and fluorescence properties, its sensitivity is extremely good for low levels of proteins, peptides, or antibodies. And, because the UHPLC conditions are MS-friendly, every optimized separation by UV or fluorescence can be immediately interfaced with MS.

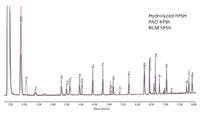
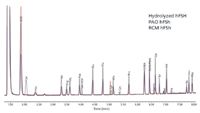
Figure 6: Hydrolyzed protein analysis (amino acid analysis) of human follicle-stimulating hormone (hFSH), phenylarsine oxide (PAO) hFSH, and reducedâcarboaximdomethylated (RCM) hFSH, identical 6-aminoquinolyl-N- hydroxysuccinimidyl carbamate (6-AQC) derivatization conditions with resultant UHPLC separations overlaid (27).
Summary
In this part one of a two-part series, we have tried to demonstrate that UHPLC has become a very well accepted and practiced, analytical method in these first two areas of biotechnology applications: peptide mapping and amino acid analysis. We have chosen to discuss these two methods first because these are well established and have proved to be extremely well accepted and applied throughout the biopharmaceutical industry. However, UHPLC can be used for any number of applications involving the characterization of protein drug substances, as well as to meet the various requirements for biopharmaceutical regulatory science needs (for example, stability studies, lot-to-lot comparisons, impurity profiling) for the regulatory agencies. In the second part of this two-part series on UHPLC in biotechnology, we will discuss intact protein characterization using UHPLC, as well as glycoprofiling or glycan analysis, also using UHPLC but now with HILIC-type separations. We hope it has been already made eminently clear that UHPLC can be used today in virtually all forms of HPLC, including SEC, HILIC, reversed-phase chromatography, ion-exchange chromatography, and others.
Acknowledgments
We indicate our sincere appreciation to numerous colleagues at Waters Corporation who, over many years, have provided us with copies of journal publications, magazine articles, application notes, poster papers, and related materials dealing with UHPLC applications to biopharmaceuticals. We are especially indebted for several figures being used in the above article, as provided by Tom Wheat and Ken Fountain at Waters, as well as for interesting discussions as we planned the contents of this article.
Thomas E. Wheat is a principal scientist in the Systems Laboratory at Waters Corporation (Milford, Massachusetts). He earned a Ph.D. in cell biology from the University of Illinois and was a post-doctoral research associate at Northwestern University. He has used and studied protein and peptide chromatography throughout his academic and industrial career.


Thomas E. Wheat
Anurag S. Rathore is a biotech CMC consultant and an associate professor with the Department of Chemical Engineering, Indian Institute of Delhi, India.


Anurag S. Rathore
Ira S. Krull is Professor Emeritus of Chemistry and Chemical Biology at Northeastern University, Boston, Massachusetts, and a member of LCGC's editorial advisory board.

Ira S. Krull
References
(1) The Future of Biotech. The 2010 Guide to Emerging Markets and Technology (BioWorld/AHC Media, Atlanta, Georgia, 2009).
(2) Massachusetts Biotechnology Council, Cambridge, MA, http://massbio.org.
3. Biotechnology Industry Organization (BIO), www.BIO.com.
(4) Scientific American WorldView, A Global Biotechnology Perspective, The Future of Biotech, The 2010 Guide to Emerging Markets and Technology, 2009.
(5) I.S. Krull and A. Rathore, LCGC North America 28(6), 454–468 (2010).
(6) I.S. Krull and A. Rathore, LCGC North America 28(12), 1028–1036 (2010).
(7) G. Walsh, Biopharmaceuticals: Biochemistry and Biotechnology, 2nd ed. (Wiley & Sons, Ltd., Chichester, UK, 2003).
(8) J. Geigert, The Challenge of CMC Regulatory Compliance for Biopharmaceuticals (Plenum Publishers, New York, NY, 2004).
(9). G. Walsh, Proteins — Biochemistry and Biotechnology (Wiley & Sons, Ltd., Chichester, UK, 2002).
(10) "Application Solutions for Biopharmaceuticals, A Focus on Protein Therapeutics, 2009, 2010," Waters Corporation (Milford, MA, USA); available at www.waters.com by using keywords: biopharmaceuticals or biopharmaceutical (market development) applications.
(11) A.D. Jerkovich, R. LoBrutto, and R.V. Vivilecchia, "The Use of ACQUITY UPLC in Pharmaceutical Development," Separation Science Redefined (advertising supplement to LCGC North America), 15–21 (May 2005).
(12) L. Nakova, L. Matysova, and P. Solich, Talanta 68(3), 908–918 (2006).
(13) M Gu, Identification of Pharmaceutical Impurities by UPLC and a Fast Scanning Quadrupole MS (application note) www.labmate-online.com, 2009.
(14) P.G. Perry, Ed., High-Throughput Analysis in the Pharmaceutical Industry (CRC Press, Taylor & Francis, Inc., 2009).
(15). A.R. Mire-Sluis, Ed., State-of-the-Art Analytical Methods for the Characterization of Biological Products and Assessment of Comparability, Developments in Biologicals, Volume 122, (Karger, Basel, CH, 2005).
(16) G. Marko-Vargy and P. Oroszlan, Emerging Technologies in Protein and Genomic Material Analysis (Elsevier Science Publishers, Amsterdam, The Netherlands, 2003).
(17) R. Rodriguez-Diaz, T. Wehr, and S. Tuck, Eds., Analytical Techniques for Biopharmaceutical Development (Taylor and Francis Group, Marcel Dekker, Taylor & Francis Group, NY, 2005).
(18) R. Kellner, F. Lottspeich, and H.E. Meyer, Microcharacterization of Proteins, 2nd Ed., (Wiley-VCH, Weinheim, Germany, 1999).
(19) J.W. Jorgenson, Annu. Rev. Anal. Chem. 3, 129–150, (2010), Figure 11.
(20) J.W. Dolan, LCGC North America 28(11), 944–950 (2010);
(21) A.B. Chakraborty, H. Xie, S.J. Skilton, J.C. Gebler, and W. Chen. Current Trends in Mass Spectrometry (supplement to LCGC and Spectroscopy), July 2009.
(22) H. Xie, A. Chakraborty, J. Ahn, Y.Q. Yu, D.P. Daksinamoorthy, M. Gilar, W. Chen, S.J. Skilton, and J.R. Mazzeo, mAbs2(4), 1–16 (July/August, 2010).
(23) Reversed-Phase Analysis of Proteins Using Acquity UPLC H-Class BioSystem and Auto-Blend Plus Technology, Waters Corporation Technology Brief (Milford, Massachusetts, July 2010.
(24) T. Wheat, "Principles and Practice of UPLC, UltraPerformance Now More Accessible Than Ever" (Training Course) Waters Corporation (Milford, Massachusetts, 2010).
(25) M. Gilar, H. Xie, A. Chakraborty, J. Ahn, Y.G. Yu, D.P. Dakshinamoorthy, W. Chen, St.J. Skilton, and J.R. Mazzeo. Guide to Protein Characterization (Supplement to BioPharm Int.), August 2010, p. 16.
(26) Amino Acid Analysis Brochure, #720001946EN, Waters Corporation, (Milford, Massachusetts, 2009).
(27) "Application of UPLC to Amino Acid Analysis" (seminar) Waters Corporation (Milford, Massachusetts, 2007).
(28) Analysis of Hydrolyzed Bovine Serum Albumin Using Waters AccQ-Tag Method for Amino Acid Analysis, ISSN#1084-0540, Waters Corporation (Milford, Massachusetts, Spring, 1995).
(29) J. Mazzeo, "Innovative Chromatographic Technology for Better Biopharmaceutical Separations," Waters Corporation (Milford, Massachusetts, 2009).


")


 - stock.adobe.com")
Investigating PFAS in Plastic Food Storage Bags Using LC–MS/MS
May 8th 2024Yelena Sapozhnikova from the United States Department of Agriculture spoke to The Column about her innovative research investigating PFAS in plastic food storage bags using targeted and non-targeted liquid chromatography–tandem mass spectrometry.


Monitoring 5-Fluorouracil Levels in Dried Blood Spots with UHPLC-MS/MS
May 3rd 2024Researchers have utilized ultra-high performance liquid chromatography-tandem mass spectrometry (UH PLC-MS/MS) to monitor 5-Fluorouracil, a medication used to treat various cancers, in dried blood spots. This process offers a simpler, more efficient method than those in place involving the monitoring of plasma.


