Development of a Stability Indicating Method for Green Fluorescent Protein by HPLC
LCGC North America
This article describes the development of a HPLC method for the assay of green fluorescent protein (GFPuv) in-process samples from our model therapeutic protein production process. Specificity of the method is evaluated by demonstrating a suitable HPLC method to separate and detect closely related protein degradation species.
This article describes the development of a high performance liquid chromatography (HPLC) method for the assay of green fluorescent protein (GFPuv) in-process samples from our model therapeutic protein production process. The specificity of the method is evaluated by demonstrating a suitable HPLC method to separate and detect closely related protein degradation species.
Green fluorescent protein (GFP) is a ubiquitous protein that has been used throughout the scientific community since the 1980s (1,2). The protein is typically used as a reporter protein whereby a recombinant protein expression is tied directly to that of GFP or to identify cellular translocation events. Our laboratory uses the GFPuv variant as a model therapeutic protein; GFPuv contains three amino acid substitutions (Phe-99 to Ser, Met-153 to Thr, and Val-163 to Ala) compared to GFPwt, and the substitutions enhance the levels of expression as well as fluorescence (3). Similar to a therapeutic protein produced in the biopharmaceutical industry, the GFPuv protein is processed throughout various large-scale (for example, 300-L) upstream and downstream operations. During these operations, GFPuv is exposed to various buffers, hold times, temperatures, and concentrations. For example, green fluorescent protein is recombinantly produced in E. coli, where the cells are grown in bacterial cell culture medium at 30 °C. After the protein induction is complete, the cells are harvested, washed, centrifuged, and resuspended in 50 mM Tris, pH 8.0. The washed cells are then subjected to high-pressure homogenization, and the homogenate is then centrifuged and the clarified lysate is collected for purification. At this stage, the bulk clarified lysate is held for up to 24 h at 4 °C to allow for further clarification. The solution is then subjected to anion-exchange chromatography, where elution occurs at approximately 250 mM sodium chloride, 50 mM Tris, pH 8.0. The appropriate fraction is then adjusted to 1 M ammonium sulfate for further purification by hydrophobic interaction chromatography. The final purified product is then subjected to an ultrafiltration-diafiltration step to buffer exchange, concentrate, and filter before bulk fill. GFPuv is assayed for concentration and purity at each processing point.
In addition to concentration and purity, we are also interested in protein degradation (that is, truncation, oxidation, and dimerization), which can affect biological function or decrease stability. Of the many types of possible degradation mechanisms, we are primarily focused on oxidation because of the susceptibility of GFPuv to oxidation. Methionine, cysteine, histidine, tryptophan, and tyrosine residues are most susceptible to oxidation by oxygen free radicals (4). Oxidative damage is an important quality attribute for biotherapeutics because it can ultimately lead to aggregation or eventually fragmentation. Oxidation can either directly affect potency or even induce immunogenicity, depending on the affected amino acid position (5). Based on previous mass spectral data obtained in our laboratory, oxidation of methionine residues to methionine sulfoxide is the most common oxidative pathway for GFPuv during processing. Methionine oxidation has been implicated in many negative effects on biopharmaceuticals (6). Since methionine contains sulfur it is relatively easily oxidized, and oxidation can occur during processing or storage because of the varied conditions that the protein is exposed to, especially at elevated pHs. In the case of GFPuv, oxidation tends to increase the propensity of GFPuv to become dimerized or truncated (data not shown).
Green fluorescent protein consists of 238 amino acids, five of which are methionine residues. Previously reported GFP stability studies focused primarily on fluorescence and truncations. For example, the stability of GFP has been studied with respect to chlorine and pH (7), temperature and pH (8), and glucose (9) as well as heat and pH in the presence of sodium chloride (10). All studies published to date consist of monitoring fluorescence as the stability indicator. Although fluorescence is a good functional indicator, it does not necessarily provide information on structural changes. For example, it has been previously shown that GFP can tolerate truncation at the C- or N-terminus to a certain extent (11) as indicated by fluorescence. In these cases, fluorescence remains unchanged as amino acids are clipped off either termini.
To obtain insight on structural stability, we focused our efforts on methionine oxidation by developing a stability indicating method using reversed-phase high performance liquid chromatography (HPLC). Green fluorescent protein contains fairly hydrophobic regions and is well separated by reversed-phase HPLC. As the various methionines become oxidized, the overall protein polarity increases. By taking advantage of this property, we predicted that the various species with different levels of oxidations could be separated by reversed-phase chromatography. To date, separation of oxidized GFPuv species has not been reported in literature. This report examines the method development process to separate intact GFPuv from its oxidized derivatives.
Experimental
Chemicals and Reagents
Acetonitrile (HPLC-grade) and trifluoroacetic acid (Optima-grade) were purchased from Fisher Scientific. Deionized water (18-MΩ) was prepared through a MilliQ water purification system (EMD Millipore). Hydrogen peroxide (30% reagent grade) was purchased from EMD Chemicals and diluted just before the beginning of the experiment. The degradation experiments were initiated upon addition of dilute hydrogen peroxide to protein. GFPuv standard (1 mg/mL and >98% purity based on protein) was produced (based on CloneTech sequence and inserted into the pET17b vector expression system), purified, and characterized in house.
Instrumentation
A Shimadzu Prominence model HPLC system consisting of an autosampler, a degasser, binary pumps, a column oven, and a variable-wavelength ultraviolet (UV) detector was used. The system was interfaced with Shimadzu Labsolutions Version 5.54 for control and data acquisition. The column temperature was set to either 30 °C or 40 °C, depending on the method. The absorbance was monitored at 370 nm and the injection volume was set at 10 µL for all experiments. The mobile phases consisted of 0.1% trifluoroacetic acid in water for mobile-phase A and 0.1% trifluoroacetic acid in acetonitrile for mobile-phase B. The columns evaluated were 50 mm × 4.6 mm, 2.6-µm dp, 100-Å Kinetex C8 and C18 (Phenomenex) or 125 mm × 4.0 mm 5-µm dp, 100-Å Luna C18 (Phenomenex). The flow rate for all experiments was set to 1.0 mL/min.
Method Development
Initial development experiments utilized a 125 mm × 4.0 mm analytical column that was packed with 5-µm Luna C18 stationary phase. Preliminary scouting gradient experiments were performed using a 100-µg/mL GFPuv control sample diluted from a 1-mg/mL stock with a mixture of 65% mobile-phase A and 35% mobile-phase B, where the diluent represented the HPLC starting conditions. Chromatographic runs were monitored by UV absorbance at 370 nm. GFPuv has an absorption maximum at 395 nm, but 370 nm was chosen because of the upper limit of the deuterium lamp in the detector.
The primary goal was to separate GFPuv from the fully oxidized species, but during early experiments it was realized that separating GFPuv from partially oxidized species would add value to the analysis. Unpublished data indicate that partial oxidation eventually leads to full product oxidation if the conditions are not corrected in the production process. The stressed GFPuv sample was prepared by diluting stock GFPuv to 100 mg/mL in diluent containing 1% hydrogen peroxide and allowing the GFP to fully oxidize. Previous experiments demonstrated (data not shown) that the fully oxidized species occurred after 30 min of exposure.
Gradient optimization experiments were initially performed using the Luna C18 column to achieve optimal separation between GFPuv and oxidized species. When an ideal gradient could not be identified that would yield adequate separation, the stationary phase was changed in an attempt to improve selectivity. A 50 mm × 4.6 mm analytical column packed with 2.6-µm C18 Kinetex stationary phase was evaluated, but carryover of the protein was observed upon repeated injections. The carryover was alleviated by changing to a C8 Kinetex stationary phase, while keeping the column dimensions and particle size the same. It should be noted that only these columns were evaluated because they were readily available in our laboratory and they have been used for GFP analyses spanning several years. Furthermore, larger pore size stationary phases were not evaluated because green fluorescent protein has a relatively compact size of 4.2 nm × 2.4 nm (12) and effectively diffuses into the 100-Å pore size stationary phase. These 100-Å pore size columns also serve as a generic separation platform in our laboratory allowing us to conduct peptide mapping analysis or monitor other small molecule contaminants in our GFP process.
The gradient composition was optimized to achieve retention of GFPuv as well as separation of the resulting degradants. After adequate separation of GFPuv from the fully oxidized species was obtained, the oxidation degradants were profiled by performing repeated injections of the stressed sample immediately after preparation. The amount of exposure time was accurately accounted for as it was directly proportional to the analysis time of the HPLC method. For example, time points correlated to the span between each injection.
Results and Discussion
To ensure the pH of the mobile-phase system was well below the isoelectric point of GFPuv, both mobile phases were acidified with 0.1% trifluoroacetic acid. The acidic modifier ensured full protonation of the protein, as well as any free silanol groups, which minimized extra-column interactions. The Luna C18 column was initially chosen because of the wide pH stability and this type of C18 column has been successfully used in the separation of a variety of proteins (13,14).
The first scouting run used a shallow gradient, increasing the mobile-phase B concentration from 20% to 75% over a period of 20 min. The method gave a good, symmetrical peak shape for GFP, but the method run time of more than 25 min was longer than desired. The goal of the method was to use it for analysis of in-process GFPuv samples. It is common, during a manufacturing campaign, for a production group to generate dozens of in-process samples a day. Results for these samples are usually needed as quickly as possible to ensure various quality attributes are achieved along each step of the manufacturing process before proceeding on to the next step.
To increase the elution power of the mobile phase, a second gradient was used where the initial concentration of mobile-phase B started at 40% and increased to 60% over 10 min. However, the initial concentration of mobile-phase B was too strong and resulted in no retention of GFPuv. A third gradient was attempted where mobile-phase B started at 30% to lower the mobile phase strength and increase the retention factor, k, of GFPuv. The steepness of the gradient, approximately 2% per minute to 50% over 10 min, was chosen to avoid band broadening yet increase selectivity between GFPuv and the resulting degradation products. The method with the new gradient provided good retention of GFPuv (k ≈ 4) and acceptable peak shape with a peak tailing factor of 1.6.
After the basic method was established, a peroxide-stressed sample of GFPuv was analyzed along with a control sample. As GFPuv becomes oxidized, the resulting methionine sulfoxide groups decrease the overall hydrophobicity of the protein, and retention of the molecule decreases. Resulting chromatographic overlays of the stressed sample and control sample demonstrated this behavior. However, a peak resolution of 1.0 between GFPuv and the fully oxidized species (Figure 1) using the Luna C18 column was considered inadequate. This is especially important considering that the degradation products may be present at low concentrations. At this point it was determined that no further changes to the gradient composition or steepness would increase resolution, so a change in selectivity was performed by using a different stationary phase.

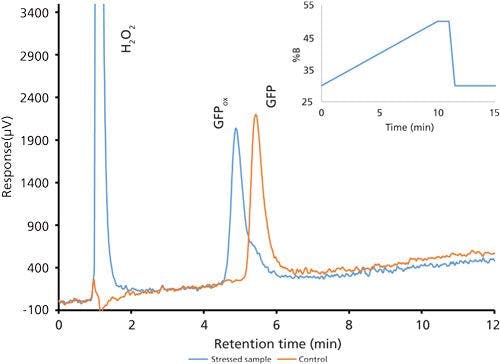
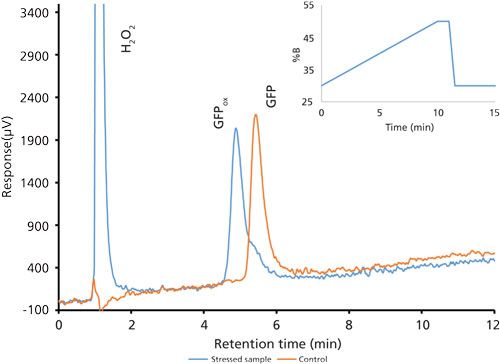
Figure 1: Chromatogram overlay of oxidized and control green fluorescent protein samples using the second optimized gradient using a Luna C18 column.
Solid core–shell particles provide a unique advantage in HPLC separations. Decreasing particle sizes result in decreased band broadening and increased chromatographic efficiency by minimizing the A and C terms as described by the van Deemter equation (equation 1).

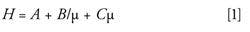
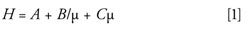
where H represents the overall separation efficiency, A is eddy diffusion, B is longitudinal diffusion, C is the mass transfer coefficient, and µ is linear velocity (15).
Because the smaller particle size gives shorter diffusion paths for the analyte, the mass transfer between the mobile phase and stationary phase is more efficient. This extra efficiency is critical when attempting to separate closely eluting species. As chromatographic peaks become narrower, resolution increases. The increased efficiency can also lead to a decrease in analysis time, which is critical when analyzing in-process samples. The decrease in analysis time is inversely proportional to the amount of samples that can be analyzed. Halving the analysis time effectively doubles the number of samples that can be analyzed in a chromatographic run.
To take advantage of the improved separation efficiencies offered by the core–shell technology, a 50 mm × 4.6 mm, 2.6-µm dp Kinetex C18 column was used. The flow rate remained unchanged, resulting in a 9-min decrease in total run time with very little change to the gradient profile. The column temperature was increased from 30 °C to 40 °C to further optimize the mass transfer of GFPuv and reduce the potential for band broadening (Table I). However, carryover of GFPuv was observed after repeated injections of the protein. The source of carryover was determined to be from the column and not the HPLC system, but further investigation into the cause was not performed. It was hypothesized that the hydrophobic nature of the protein yielded a higher affinity for the C18 stationary phase. The mobile-phase gradient was not strong enough to elute the entirety of the protein from the stationary phase, resulting in carryover. Lowering the hydrophobicity of the stationary phase by switching to a C8 column with the same dimensions and particle size resulted in increased partitioning of the protein in the mobile phase, ensuring complete elution and alleviating the observed carryover.

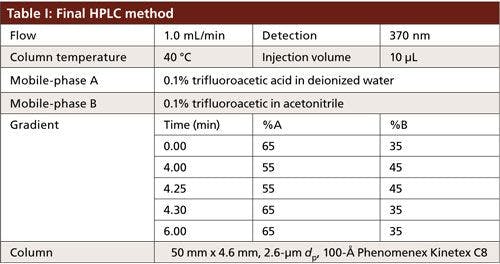
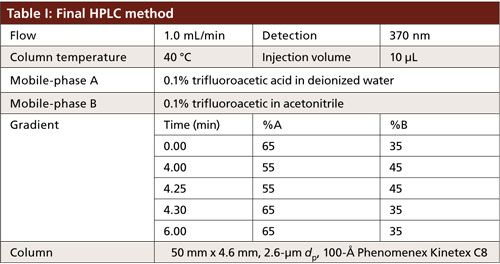
Good retention of GFPuv was observed (k ≈ 3.5) with a significant improvement in the peak tailing factor (1.2) (Figure 2). The total analysis time was therefore shortened to 6 min per injection. Subsequent experiments showed that decreasing the HPLC analysis time further was not realistic, because there was insufficient time to ensure the stationary phase was equilibrated back to initial mobile-phase conditions. An advantage of the reduced analysis time was the ability to monitor the oxidation reaction every 6 min. After adding the peroxide to the sample, it was injected immediately and re-injected every 6 min. An overlay of the repeated injections and the control sample showed the progression to the fully oxidized species, which was fully resolved from the parent peak (Figure 3). Although it was not baseline resolved, it was possible to identify the individual oxidation species as the various methionine groups were being oxidized over time. The intermediate oxidation species of GFPuv was detected down to a concentration of 5.3 µg/mL. While not optimal, the resolution of 0.7 was sufficient to achieve the goal of reaction monitoring (Figure 4). This result also provides an advantage for use of the method to evaluate the degree of oxidation of the GFPuv molecule for long term stability studies. It is important to note that the peaks are not indicative of each individual oxidized methionine residue, but an average of the oxidized species over time. As the protein undergoes oxidation, the change in hydrophobicity is proportional to the amount of oxidation across all methionine groups. Each of the peaks are representative of an average oxidized species at a given exposure time to the stressor. The final peak, the point at which retention stops decreasing and remains constant, is the fully oxidized GFP species.

Figure 2: Chromatogram of the green fluorescent protein control sample after separation on a Kinetex C8 column.

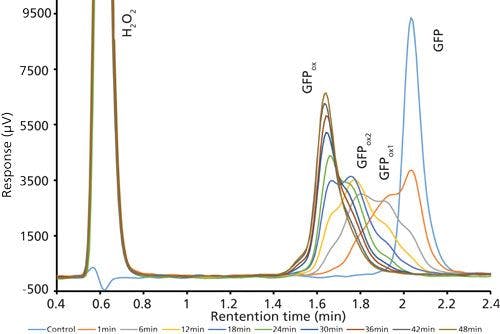
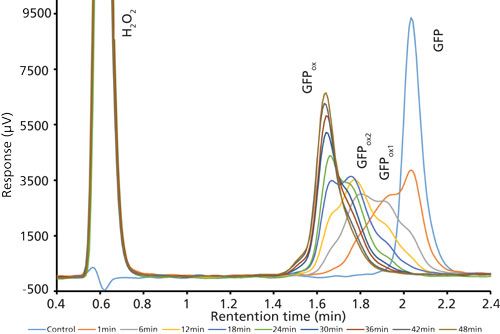
Figure 3: Chromatogram overlay of oxidized and control green fluorescent protein samples over time. Separations occurred on the Kinetex column with the final optimized gradient (expanded view).

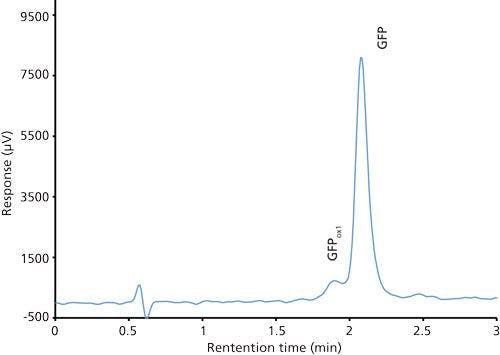
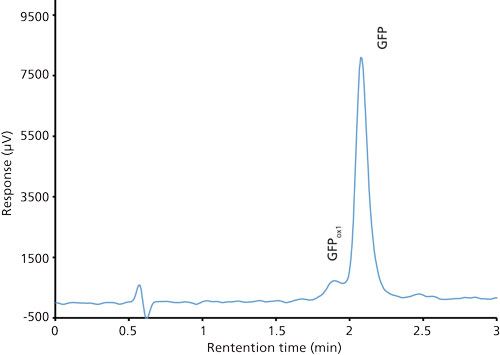
Figure 4: Chromatogram of a mixture of green fluorescent protein control (100 µg/mL) and oxidized green fluorescent protein (5 µg/mL).
Conclusion
Development of a stability indicating HPLC method requires adequate separation of the parent analyte peak from the resulting degradation products. This experiment demonstrated one aspect of development required to ensure an HPLC method that is specific to the desired analyte and potential oxidation products. Further development would be to expose the protein to other stressors (acid, base, UV light) to ascertain if the method was specific to degradation products generated from these other sources.
By simply switching to a stationary phase with a smaller particle size, we doubled potential sample throughput by reducing the overall run time by more than 50%. We were able to achieve separation between GFPuv and the fully oxidized species, as well as monitor the oxidation of GFP over time.
The development of a HPLC method should focus not only on accuracy and specificity, but the ultimate goal of the method should also be considered. The responsibility of the development scientist is also to develop methods that are applicable for the intended purposes. As in this experiment, the ultimate goal of the method is for monitoring in-process samples for oxidation. Although an acceptable HPLC method was developed for GFPuv using a conventional C18 stationary phase, the analysis time of 25 min was not optimal when looking ahead to the potential number of samples for analysis. It is critical to take these factors into consideration when developing HPLC methods for in-process samples. For this reason, it was important to proceed with further development to decrease the analysis time as much as possible without impacting the performance of the final method. Ultimately, the method described in this article was suitable for detecting fully oxidized GFPuv degradants as well as to track formation of oxidations as it occurred throughout the production process.
References
- S.J. Remington, Protein Sci.20(9), 1509–1519 (2011).
- T. Mistelli and D.L. Spector, Nature Biotechnol.15, 961–964 (1997).
- O. Scholz, A. Thiel, W. Hillen, and M. Niederweis, Eur. J. Biochem.6, 1565-1570 (2000).
- S. Li, C. Schoneich, and R.T. Borchardt, Biotechnol. Bioeng.48, 490–500 (1995).
- J. Patel, R. Kothari, R. Tunga, N. Ritter and B. Tunga, Bioprocess Int.9(1), 20–31 (2011).
- J. Mo, A.A. Tymiak, and G. Chen, Mass Spectrometric Characterization in Protein Therapeutics Discovery (Springer, New York, 2013), pp. 163–206.
- P.G. Mazzola, M. Ishii, E. Chau, O. Cholewa, and T.C.V. Penna, Biotechnol Prog.22, 1702–1707 (2006).
- T.C.V. Penna, M. Ishii, A. Pessoa, and O. Cholewa, Appl. Biochem. Biotechnol.113, 469–483 (2004).
- M. Ishiia, J.S. Kunimuraa, T.C.V. Penna, and O. Cholewa, International J. Pharmaceutics.337, 109–117 (2007).
- M. Ishiia, J.S. Kunimuraa, H.T. Jeng, T.C.V. Penna, and O. Cholewa, Appl. Biochem. Biotech.137, 555–571 (2007).
- R.Y. Tsien, Annu. Rev. Biochem.67, 509–544 (1998).
- M.A. Hink, R.A. Griep, J.W. Borst, A. van Hoek, M.H.M. Eppink, A. Schots, and A.J.W.G. Visser, J. Biol. Chem.275, 17556–17560 (2000).
- C. Ye, G. Terfloth, Y. Li, and A. Kord, J. Pharm. Biomed. Analysis50, 426–431 (2009).
- A. Lindqvist and S. Andersson, J. Biol. Chem.26, 23942–23948 (2002).
- J. van Deemter, F.J. Zuiderweg, and A. Klinkenberg, Chem. Eng. Sci.5, 271–289 (1956).
Nathaniel Hentz, PhD, is an Assistant Director of the analytical lab at North Carolina State University - Golden LEAF Biomanufacturing Training and Education Center (BTEC) in Raleigh, North Carolina, where he has spent the last 8 years instructing and providing analytical support for the various biomanufacturing processes taught at BTEC. Brian Mosley is a scientist in the analytical lab at the Golden LEAF BTEC. Direct correspondence to: nghentz@ncsu.edu


 - stock.adobe.com")
Investigating PFAS in Plastic Food Storage Bags Using LC–MS/MS
May 8th 2024Yelena Sapozhnikova from the United States Department of Agriculture spoke to The Column about her innovative research investigating PFAS in plastic food storage bags using targeted and non-targeted liquid chromatography–tandem mass spectrometry.


Vitamin D Determination Tested Using Liquid Chromatography–Tandem Mass Spectrometry
May 2nd 2024Scientists from Hangzhou Medical College recently recorded the effectiveness of novel quality control strategies for the determination of vitamin D using liquid chromatography–tandem mass spectrometry (LC–MS/MS).


