Evaluation of Kinetic Performance of Reversed-Phase Columns for Protein Separations by Gradient Kinetic Plots
The increasing importance of protein biopharmaceuticals has triggered the development of new, highly efficient stationary phases for reversed-phase liquid chromatography (LC) of proteins. They typically have C4 ligands or phenyl surfaces for weak hydrophobic interactions and are based on various morphologies, such as silica monolith, sub-2-µm fully porous particles (FPPs), or superficially porous particles (SPPs). Selection of the best column based on physical parameters provided by vendors may sometimes be unequivocal. Simple performance evaluation tools, such as the gradient kinetic plot methodology reported by Desmet and co-workers, can help to shed light on this issue and allow for a more differentiated view on column performance. This article compares the performance of wide-pore silica monolithic, sub-2-µm FPP, and SPP columns. It also addresses the question of whether 1000 Å or 400 Å SPP columns are more suitable for reversed-phase LC-type protein separations and presents a kinetic performance comparison of a number of wide-pore core–shell particle columns.
Protein separations are continuing to gain in importance due to a growing number of approvals of protein therapeutics and related products. For example, out of 27 FDA approvals in 2013, 89% were small molecule drugs and only 7% proteins (comprising antibodies [Abs], Ab-fragments, and Ab-conjugates). Nearly 10 years later, the situation has changed significantly. The percentage of new small molecule drugs was down to 46% in 2022, while Abs (including bispecific Abs [bsAbs], Ab-fragments, and Ab-conjugates) (32%) and other proteins (including pegylated proteins, enzymes) (13%) amounted to 45% of all drug approvals (37 in total) (1). The situation in Europe is similar. For example, in Germany the corresponding numbers n 2022 were 40% small molecule drug approvals, 26% Abs and related (Abs, bsAbs, Ab-fragments, Ab-conjugates), and 13% proteins, enzymes, and pegylated proteins out of a total of 49 newly approved drugs (2). Column manufacturers have reacted to these trends and offer many new columns for the liquid chromatographic (LC) separation of protein pharmaceuticals, comprising columns packed with superficially porous particles (SPPs), fully porous sub-2-µm particles (FPPs), nonporous particles (NPPs), and monolithic columns. This raises the question as to what is the best performing column for a specific application in protein LC.


Vials are arranged in the auto-sampler for the lab equipment. | Image Credit: © 김대수 김대수 - stock.adobe.com

The classical way of evaluating column performance is based on a series of injections of analytes at variable flow rates under isocratic conditions and data processing in accordance with the van Deemter equation (H/u-plots or in dimensionless coordinates h/ν-plots [3]). Classical van Deemter analysis for column comparison is, however, of limited use for protein LC. Protein separations are always performed in gradient elution mode, while the former is typically under isocratic conditions. Moreover, the set of columns available in the laboratory may differ in stationary phase morphologies; other factors may also complicate comparability, such as length, internal diameter, pore size and its distribution, particle size and its distribution, and support type. To overcome these limitations, Desmet and co-workers have proposed the gradient kinetic plot methodology as a framework for testing column performance in gradient elution mode (4). It has already been successfully applied for a number of purposes (5–7).
In gradient elution, the kinetic performance of a column can be defined as the peak capacity (np) generated in a certain time (tR) by a chromatographic system (4). The kinetic performance limit (KPL) is reached when the column is operated under a set of optimal column lengths and flow rates, which is accomplished by operating the column at its maximal pressure drop, ΔPmax. In practice, it corresponds to the pressure limit specified by the supplier or the system back pressure—whichever is lower. Kinetic plots of a column relating efficiencies (np) to the speed (tR) under its performance limit—that is, when ΔP = ΔPmax—can be generated by transforming experimental efficiencies (np) measured in a column with length L and given flow rate F (and resultant experimental pressure drop ΔPexp) into corresponding values of np,KPL and tR,KPL. They refer to conditions one would obtain with the same flow rate in a column with a length scaled so that ΔP = ΔPmax (4). Such kinetic plots therefore contain information on efficiency, speed, and permeability, and are ideally suited for comparison of columns differing in morphologies, such as monolithic, SPP, and FPP columns.
Experimentally, kinetic plots are obtained by performing a series of injections of test substances under different flow rates, acquiring experimental np, tR, and ΔP. The transformation to np and tR under the conditions of their performance limit can be achieved by simple procedures, as discussed in detail by Broeckhoven et al. (4) (Figure 1). A column length rescaling factor, λ, that takes the maximum allowed column pressure into account is calculated by equation 1:


It is evident that each experimental flow rate has its own rescaling factor, λ. The following implicit expressions (equations 2 and 3) can then be applied for data transformations:


and


When performing experimental measurements, a set of prerequisites must be considered (4,8). System effects (system back pressure and extracolumn effects) must be corrected for if they make a significant contribution, as described in reference 8. Furthermore, for each flow rate, the sample must experience the same mobile phase history, that is, β·t0 must be constant, wherein β is the gradient steepness (as defined by equation 4) and t0 is the column dead time:


Herein, tend and tstart are the gradient end and start times, and φend and φ0 are the final and initial organic modifier percentages, respectively.
To compare different stationary phases, Zhang et al. suggested considering the S-value (slope of log k vs. φ plot) and keeping S·β·t0 constant, which was the approach employed in their work (9).
This article applies the gradient KPL methodology suggested by Desmet and co-workers (4) for testing i) the performance of reversed-phase columns with distinct morphology (SPP, FPP, monolithic) designed for protein separations, and ii) revisiting the effect of pore size in core–shell particle columns (10).
Experimental
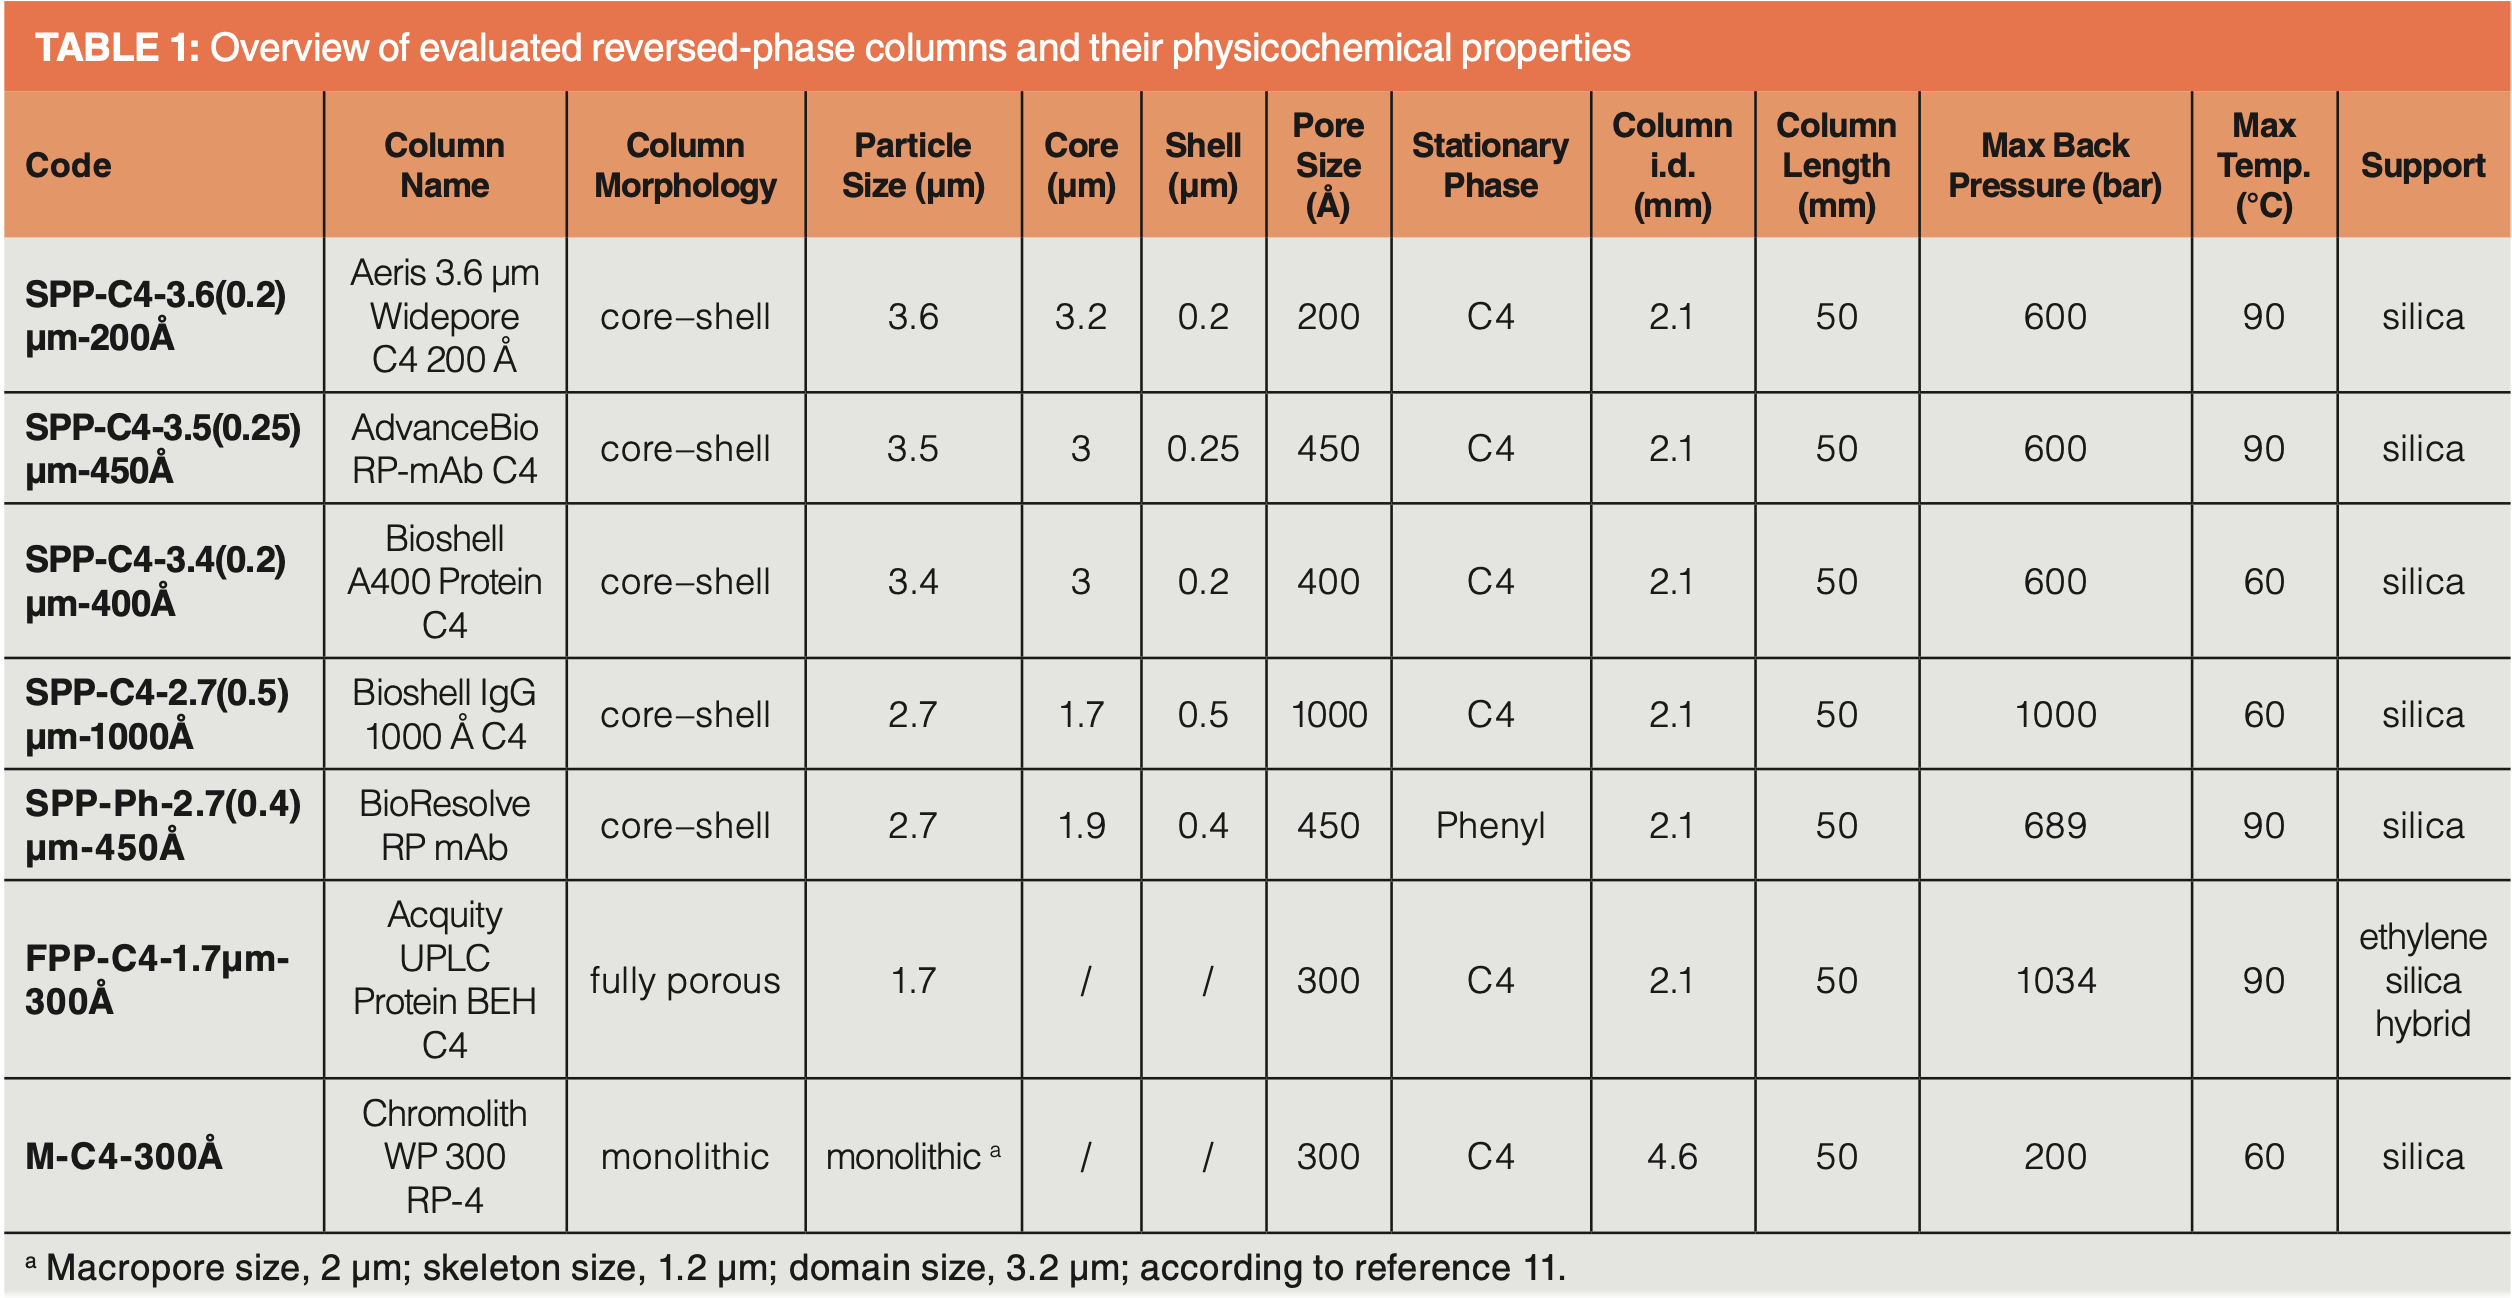
All LC experiments were performed on an Agilent 1290 Infinity UHPLC system consisting of binary pump (G4220A), autosampler (G4226A), sample thermostat (G1130B), thermostated column compartment (G1316C), and diode array detector (DAD, G4212A). To minimize extracolumn effects of peak dispersion, the ultrahigh-pressure liquid chromatography (UHPLC) system was equipped with an ultra-low dispersion kit. Extracolumn and dwell volumes were determined as 11.7 μL and 175 μL, respectively. All experiments were performed at 60 °C, which was the maximum column temperature for all columns as specified by suppliers (note, significantly better efficiency and higher recoveries can be achieved at 80 and 90 °C). The evaluated columns are listed in Table 1. Chromolith and BIOshell columns were from Merck, BioResolve and Acquity columns from Waters, the Aeris column from Phenomenex, and AdvanceBio from Agilent. Protein standards were from Sigma-Aldrich (Merck). NIST monoclonal antibody (NISTmAb) reference material (RM) 8671, a humanized IgG1κ monoclonal antibody formulated in histidine buffer, was purchased from the National Institute of Standards and Technologies (NIST). IdeS digestion was performed with FragIT MicroSpin columns (Genovis) following the manufacturer’s instructions.


The peak capacity np was calculated by equation 5 based on the peak width at half height:


with t0 the elution time of a non‑retained compound (dead time), tG the gradient (run) time, w4σ the peak width at 4σ, and w50% the peak width at half height. DryLab 4.3.5 (Molnár-Institute) was employed to optimize the gradients and determine the S-value as described in more detail in reference 10.
Results and Discussion
Stationary Phase Morphology
All experiments were performed with three test sets of proteins differing in size (from 12.4 to 148.2 kDa), isoelectric point (pI)(from 4.7 to 11.35), and hydrophobicities (grand average of hydropathy [GRAVY] -0.9 to -0.16). The first test sample contained a monoclonal antibody (NISTmAb) with a size of 148.2 kDa. The second consisted of antibody fragments each with about 25 kDa in size obtained by IdeS-digestion of NISTmAb followed by disulphide reduction with tris(carboxyethyl)phosphine (TCEP), which resulted in light chain (LC), Fc/2-, and Fd-fragments. The last test mixture contained a set of small standard proteins consisting of cytochrome c, lysozyme, and β-lactoglobulin covering the molecular weight range from 12.4 to 18.3 kDa (note, bovine serum albumin [BSA] was also present in the mixture but was not considered for the KPL curves due to molecular dispersity and broad peaks). Gradient elution was run with acetonitrile as a strong eluent and 0.1% TFA in both channels to minimize secondary interactions with the stationary phases. Representative chromatograms for the different test mixtures on stationary phases with different morphologies are presented in Figure 2.


The most critical parameter for the kinetic performance of stationary phases for protein separations is the mass transfer resistance, with pore diffusion a significant factor (12,13,14). Molecules must reach the inner adsorption surface, and this is achieved by molecular diffusion in the liquid filled pores. Figure 3(a) shows a model of a cylindrical pore. For macromolecules, the hydrodynamic diameter of the analyte may be in the same order of magnitude as the pore diameter of common stationary phases, which can lead to hindered pore diffusion, as described by equation 6 (for definition of symbols see caption of Figure 3).


Therefore, the pores must be sufficiently large enough to reduce the hindrance from wall effects exerted by electrostatic and van der Waals forces. For instance, if the ratio of analyte to pore radius (λm = rm/rpore) is 0.5 (that is, the pore diameter is only a factor of two larger than the analyte diameter), a hindrance factor of around 0.2 can be estimated (Figure 3[b]). It means the effective pore diffusion coefficient (equation 6) drops to only 20% of the free, unhindered molecular diffusion coefficient D in a wide tube without wall effects. The corresponding numbers for factor five and factor 10 larger pore diameters than molecule diameter can be roughly estimated as 50 and 70% of the molecular diffusion coefficient, respectively.
For this reason, analytical protein separations are typically performed using porous adsorbents with pore sizes between 300 and 450 Å as a compromise between effective pore diffusion and a large enough adsorption surface, as well as pressure resistance of the material.
The first question addressed was which column morphology has better kinetic performance, SPP with 3.5 µm or sub-2-µm FPP, and how does a silica monolith column, all modified with C4-ligands, compare? The stationary phases all had wide-pore structures (300–450 Å nominal pore size) to allow for effective pore diffusion. Figure 4 shows the KPL plots for the selected column morphologies and ΔPmax as specified in Table 1. The interpretation of these KPL curves is straightforward: the system that provides a certain efficiency (that is, peak capacity, np) in the shortest possible time (tR) when operated at their pressure maximum (ΔPmax)can be easily selected. For example, for the 23.1 kDa NISTmAb light-chain fragment, a peak capacity of np = 100 was achieved in a shorter time on the SPP column SPP-C4-3.4(0.2)µm-400Å with 3.4-µm particle diameter, 0.2-µm shell thickness, and 400 Å pore diameter (ΔPmax 600 bar) than on the sub-2-µm 300 Å fully porous particle column FPP-C4-1.7µm-300Å (ΔPmax 1034 bar) and the monolithic silica column M-C4-300Å (ΔPmax 200 bar) (Figure 4[a]). Here, the silica monolith suffered from the low pressure resistance of the PEEK cladding that limits the maximum operating pressure to 200 bar (note, working at higher operating pressures shifts the Knox-Saleem-limit to the right, which means higher peak capacities in the same time or faster separations with the same peak capacity can be achieved). Figure 4(a) illustrates how the 3.4-µm SPP column offers better kinetic performance than the sub-2-µm FPP column under their specific kinetic performance limits. Although the KPL methodology does not provide a physicochemical interpretation, it can be assumed here that the shorter diffusion path lengths in the core–shell material are primarily responsible for this better kinetic performance. The benefit of the SPP materials appeared to be even more pronounced for larger proteins, such as NISTmAb (Figure 4[b]). The two core–shell columns tested, SPP-C4-3.4(0.2)µm-400Å and SPP-C4-3.5(0.25)µm-450Å, both exhibited better kinetic performance. However, it is interesting to note that the KPL curves for the SPP-C4-3.4(0.2)µm‑400Å column and the FPP-C4-1.7µm-300 Å showed a crossover in the low flow/long column regime, with better performance of the FPP column under these conditions. The performance of the monolithic column approximated that of the SPP-C4-3.4(0.2)µm-400Å column in the low flow/long column regime. It can be concluded that in the fast separation regime SPPs have advantages over the tested FPP and monolithic columns.


Pore Size and Shell Thickness of SPP Columns
To achieve optimal performance in analytical separations, a pore size that matches the macromolecules is important to allow for unhindered pore diffusion and fast transport rates in and out of the pores, otherwise significant peak broadening effects may impair chromatographic efficiencies in macromolecule separations (15–17). Wide-pore SPP columns are available with 200 Å (15), 400 Å (16), and 1000 Å pore sizes (17). The 200 Å column is suitable for small proteins, while the 1000 Å SPP was specifically developed for large macromolecules such as mAbs. For example, NIST specifies an effective hydrodynamic radius of 5.40 ± 0.08 nm for its RM 8671 mAb reference material (NISTmAb) (18). By applying equation 6 and the model for assessing the hindrance parameter Kp outlined in Figure 3(b), λm values of 0.27, 0.135, and 0.054 resulting in effective pore diffusion coefficients of approximately 40, 60, and 75% related to the unhindered molecular diffusion coefficient for 200, 400, and 1000 Å pore size materials, respectively, were roughly estimated. Accordingly, a significant gain in kinetic performance can be expected for SPP columns when the pore size increased in this order.
For the experimental test, a small protein (cytochrome c 12.4 kDa) and a large protein (NISTmAB 148.2 kDa) were selected to establish KPL plots on SPP columns (Figure 5). Figure 5(a) shows that for a small protein like cytochrome c the 200 Å SPP column offered a less effective kinetic performance than the 400 Å SPP column (both with 3.5±0.1 µm particle diameter and 0.2 µm shell thickness). However, the 1000 Å SPP column did not follow the expected trend—in particular in the fast flow/short column regime (left side of the KPL asymptote). However, a crossover of the KPL curves of the 1000 Å and 400 Å SPP columns in the low flow/long column regime (right side of the KPL asymptote) was observed. This can be explained by the significantly longer diffusion path length of the 1000 Å SPP material with its 0.5 µm shell thickness when compared to the 400 Å SPP material with its 0.2 µm thin porous shell. Only if there is enough time for diffusional mass transport into and out of the deep pores of the 0.5 µm thick shell in the 1000 Å SPP material can the expected benefit be realized, but not under fast separation conditions for which a thin shell was beneficial. These trends were very similar for the large NISTmAb protein (Figure 5[b]) (200 Å SPP material not shown but has a lower kinetic performance) (10) for this study. Even for the large mAb protein, the 1000 Å SPP material with thick shell exhibited a lower effective kinetic performance in the fast flow regime compared to all three tested SPP materials with 400–450 Å pore size and a thinner shell in this study.


Conclusions
Gradient kinetic plots are a convenient approach to evaluate the kinetic performance of columns for protein separations. They are straightforward to establish using a series of gradient LC experiments with different flow rates followed by implicit transformation of experimental peak capacities and retention times to the corresponding values under their kinetic performance limits. In this study wide-pore core–shell particle columns (400–450 Å) were the most effective for protein separations under KPL conditions. The 1000 Å SPP column did not show more beneficial kinetic performance under high flow velocity conditions compared to a 400 Å SPP column—presumably due to its thicker porous shell. It was therefore concluded that a thin shell offers more benefits compared to much wider pores for fast separations provided that the pores are large enough to accommodate the macromolecular analyte. A combination of a thin shell and super wide pores (for example, 1000 Å) is an attractive design for future column developments. However, such materials may suffer from pressure resistance and stability, unless larger particle diameters are employed.
References
(1) Halford, B. 37 New Drugs Achieved FDA Approval in 2022. C&EN Global Enterprise 2023, 101 (3), 18–9.
(2) Gensthaler, B. M.; Gräfe, K. A.; Rößler, A. Siebenand, S. Die Neuen Arzneistoffe 2022. Pharmazeutische Zeitung. 2023, 168 (3.Ausgabe), 4–59.
(3) Andrés, A.; Broeckhoven, K.; Desmet, G. Methods for the Experimental Characterization and Analysis of the Efficiency and Speed of Chromatographic Columns: A Step-by-Step Tutorial. Analytica Chimica Acta 2015, 894, 20–34. DOI: 10.1016/j.aca.2015.08.030
(4) Broeckhoven, K.; Cabooter, D.; Lynen, F.; Sandra, P.; Desmet, G. The Kinetic Plot Method Applied to Gradient Chromatography: Theoretical Framework and Experimental Validation. Journal of Chromatography A 2010, 1217 (17), 2787–95. DOI: 10.1016/j.chroma.2010.02.023
(5) Vaast, A.; Broeckhoven, K.; Dolman, S.; Desmet, G.; Eeltink, S. Comparison of the Gradient Kinetic Performance of Silica Monolithic Capillary Columns with Columns Packed with 3μm Porous and 2.7μm Fused-Core Silica Particles. Journal of Chromatography A 2012, 1228, 270–5. DOI: 10.1016/j.chroma.2011.07.089
(6) Nováková, L.; Vaast, A.; Stassen, C.; et al. High-Resolution Peptide Separations Using Nano-LC at Ultra-High Pressure. Journal of Separation Science 2013, 36 (7), 1192–9. DOI: 10.1002/jssc.201201087
(7) Hetzel, T.; Blaesing, C.; Jaeger, M.; Teutenberg, T.; Schmidt, T. C. Characterization of Peak Capacity of Microbore Liquid Chromatography Columns Using Gradient Kinetic Plots. Journal of Chromatography A 2017, 1485, 62–9. DOI: 10.1016/j.chroma.2017.01.018
(8) Broeckhoven, K.; Gunnarson, C.; Stoll, D. But Why Doesn’t It Get Better? Kinetic Plots for Liquid Chromatography, Part III: Pulling It All Together. LCGC North America 2022, 40 (3), 111–5. DOI: 10.56530/lcgc.na.vi2966r2
(9) Zhang, Y.; Wang, X.; Mukherjee, P.; Petersson, P. Critical Comparison of Performances of Superficially Porous Particles and Sub-2μm Particles Under Optimized Ultra-High Pressure Conditions. Journal of Chromatography A 2009, 1216 (21), 4597–605. DOI: 10.1016/j.chroma.2009.03.071
(10) Jaag, S.; Wen, C.; Peters, B.; Lämmerhofer, M. Kinetic Performance Comparison of Superficially Porous, Fully Porous and Monolithic Reversed-Phase Columns by Gradient Kinetic Plots for the Separation of Protein Biopharmaceuticals. Journal of Chromatography A 2022, 1676, 463251. DOI: 10.1016/j.chroma.2022.463251
(11) Hormann, K.; Müllner, T.; Bruns, S.; Höltzel, A.; Tallarek, U. Morphology and Separation Efficiency of a New Generation of Analytical Silica Monoliths. Journal of Chromatography A 2012, 1222, 46–58. DOI: 10.1016/j.chroma.2011.12.008
(12) Carta, G.; Jungbauer A. Adsorption Kinetics. In Protein Chromatography, Wiley-VCH, 2010; pp 161–99.
(13) Anderson, J. L.; Quinn, J. A. Restricted Transport in Small Pores. A Model for Steric Exclusion and Hindered Particle Motion. Biophys. J. 1974, 14 (2), 130–50. DOI: 10.1016/S0006-3495(74)70005-4
(14) Hahn, R. Methods for Characterization of Biochromatography Media. J. Sep. Sci. 2012, 35 (22), 3001–32. DOI: 10.1002/jssc.201200770
(15) Fekete. S.; Berky, R.; Fekete, J.; Veuthey, J. -L.; Guillarme, D. Evaluation of a New Wide Pore Core–Shell Material (Aeris WIDEPORE) and Comparison with Other Existing Stationary Phases for the Analysis of Intact Proteins. Journal of Chromatography A 2012, 1236, 177–88. DOI: 10.1016/j.chroma.2012.03.018
(16) Gritti, F.; Guiochon, G. The Mass Transfer Kinetics in Columns Packed with Halo-ES Shell Particles. Journal of Chromatography A 2011, 1218 (7), 907–21. DOI: 10.1016/j.chroma.2010.12.046
(17) Wagner, B. M.; Schuster, S. A.; Boyes, B. E.; et al. Superficially Porous Particles with 1000Å Pores for Large Biomolecule High Performance Liquid Chromatography and Polymer Size Exclusion Chromatography. Journal of Chromatography A 2017, 1489, 75–85. DOI: 10.1016/j.chroma.2017.01.082
(18) Schiel, J.; Vessely, C. NISTmAb Common Technical Document Case Study: Humanized IgG1κ monoclonal antibody, RM 8671; https://fdocument.org/document/nistmab-common-technical-document-case-study-2018-04-02-nistmab-common-technical.html?page=1 (accessed 2023-04-28).
About the Authors
Simon Jaag has an M.Sc. degree in pharmaceutical sciences and technologies and a license as a pharmacist. As a doctoral candidate, he specialized in the analysis of proteins on their intact level as well as on the peptide and amino acid level. His main research focus is the development of new LC–MS techniques to characterize protein‑based biopharmaceuticals and their impurities. He has recently started the determination of the absolute configuration of amino acids in lipopeptide samples. During his master’s thesis he was awarded the Prof. Marin Wahl Award.
Michael Lämmerhofer is a full professor (W3) for pharmaceutical (bio-)analysis at the University of Tübingen, Germany. His research interests include the development of functionalized separation materials (chiral stationary phases, mixed‑mode phases, chemo- and bioaffinity materials, nanoparticles, monoliths), metabolomics and lipidomics, pharmaceutical analysis (impurity profiling, enantioselective analytics), multidimensional separations, and biopharmaceuticals analysis.


HPLC")