Fundamentals and Properties of Size-Exclusion Chromatography Packings and Columns
Special Issues
The fundamentals of size-exclusion chromatography, packing properties, and practical approaches for increasing resolution
To aid chemists in proper usage of size-exclusion chromatography (SEC) columns, this article reviews the fundamentals of the technique, discusses packing properties, and provides practical approaches for increasing resolution.
This paper is the third of a series of articles on size-exclusion chromatography (SEC) articles (1) published in special column technology supplements to LCGC (2,3) edited by Ron Majors. The fundamentals of SEC are reviewed, with emphasis on column performance parameters that affect SEC resolution. Based on fundamental principles, practical considerations of ways to improve resolution in SEC will be explored. The second installment, which provides a listing of commercial SEC offerings, a comprehensive review of specialized SEC columns, and a prediction of future directions in SEC column technology, will be published in the "Column Watch" column in the July issue of LCGC.
SEC Fundamentals
Unlike all other chromatographic methods (with the exception of gas chromatography analysis with zeolite packings, and the second dimension of 2D gel electrophoresis), SEC is based on an entropic separation mechanism in which the separation is governed by hydrodynamic volume differences among macromolecules in solution. This "size" difference is a function of molecular weight, molecular configuration (architecture), and molecular conformation (shape).
Thermodynamic Model
All chromatographic separations are based on the partitioning of components between two immiscible phases, represented by the thermodynamic partition coefficient

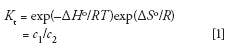

where Kt is equal to the concentration ratio of a solute distributed between the two phases under ideal thermodynamic conditions, that is, at equilibrium and infinite solute dilution (4), ΔHo is the change in enthalpy at standard conditions when a solute adsorbs, absorbs, or partitions into the stationary phase, ΔSo is the conformational entropy change at standard conditions when the solute diffuses into the stagnant mobile phase of the pores of the packing, R is the gas constant, T is the absolute temperature of the system, and c1 and c2 are the concentrations of the solute in phases 1 or 2 at equilibrium conditions.
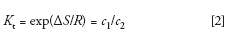
In SEC, the mobile phase, packing, and column temperature are chosen so that there is no enthalpic interaction between the solute (macromolecule) and packing; thus ΔH = 0 and equation 1 becomes

In actual practice, SEC conditions are often nonideal because thermodynamically good solvents, rather than theta-solvents, are used as the mobile phase to increase sample solubility. Furthermore, high sample concentrations are often injected because of poor detection sensitivity. Additionally, SEC is a dynamic process and may not be at equilibrium because of high flow rates that are occasionally used to decrease analysis times.
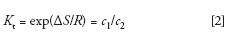
Because of these nonideal conditions, an experimental SEC distribution coefficient, KSEC, is used in place of Kt:

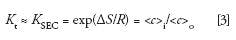
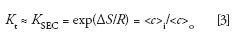
where <c>i is the average solute concentration within the pore volume of the packing, and <c>o is the average solute concentration in the interstitial volume of the packed column. As long as we keep ΔH = 0 by the judicious selection of mobile phase composition and chemical composition of the SEC packing, the separation will depend only on the conformational entropy change when a macromolecule diffuses from the interstitial volume into the pores of the packing, and then back out again. The driving force that promotes sample diffusion into and out of the pore volume is simply the sample concentration gradient. Thus, SEC separation depends only on the molecular hydrodynamic volume or size of the sample, with respect to the shape and average pore size of the packing. Because the separation does not depend on enthalpic interactions, gradient elution is not used in SEC, simplifying instrumentation.
The thermodynamic model of SEC can be visualized using Figure 1 for the separation of three sizes of macromolecules. In Figure 1a, we see small MW solutes that freely diffuse into and out of the pores; as a result, they elute at the total elution volume, Vt, in which ΔS = 0. (Note that Vt = Vi + Vo where Vi is the pore volume and Vo is the interstial volume.) In Figure 1b, macromolecules begin to approach the average pore size of the packing. The sample concentration gradient drives macromolecules into the pore volume; ΔS becomes negative and KSEC ≈ 0.5. In Figure 1c, because of this sample's large hydrodynamic volume, it cannot enter the pores on average; thus there is no change in conformational entropy, so Δs≈ 0 and KSEC ≈ 0.


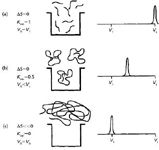
Figure 1
SEC Versus Enthalpic HPLC
Figure 2 depicts the relationship between entropic and enthalpic separations. In the former case, all peaks are eluted within the pore volume, Vi, whereas in the latter mechanism, all peaks of interest elute after the total permeation volume, Vt. In principle, any SEC column can be converted to an enthalpic separation simply by adjusting mobile phase conditions so that ΔH ≠ 0 for all components of interest. As you might have guessed, the converse is true: in principle, any column used for enthalpic-controlled separations can be converted to an SEC column simply by adjusting mobile-phase conditions such that ΔH ≠ 0 for all components being analyzed.


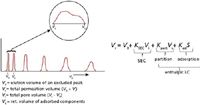
Figure 2
During enthalpic HPLC, small molecules or dissolved gas usually are unretained and are eluted at the total elution volume, Vt. These types of solutes are also seen in SEC and can cause negative and positive peaks especially if a refractive index detector is used. Ionic salts can also appear at elution volumes that are less than Vt, and are usually referred to as "system" peaks. Actually these peaks are caused by electrostatic repulsion of ionic components from the pores of the packing, and are typically not large macromolecules. In HPLC, this condition is quite acceptable, as long as all components of interest are retained, that is, ΔH > 0.
An interesting situation can sometimes arise when both enthalpic and entropic separations occur simultaneously during an SEC run. Usually this happens when complex samples are analyzed that consist of components of vastly different polarities and a hydrophilic support is used. Macromolecules that contain hydrophobic regions usually are retained, and information concerning their MW is lost because of adsorption. Nonetheless, we can sometimes use this property to study the compositional heterogeneity of polymers.
Chromatographic Equation
Another way of representing chromatographic distribution coefficients is with the general chromatographic equation

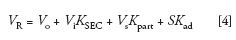
where VR is the elution volume of a given component, Vo is the total interstitial volume of the packed column, Vi is the total pore volume of the packed column, Vsis the volume of the stationary phase, S is the surface area of the adsorbent, and Kpart and Kad are the distribution coefficients of partitioning and adsorption mechanisms of separation, respectfully (Figure 2). When only entropic conditions are in effect, Kpart and Kad are equal to zero (ΔH = 0), and equation 4 becomes


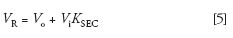
where the product ViKSEC is essentially the average pore volume fraction occupied by the macromolecular solute as it travels through the column, and KSECranges from 0, for a totally excluded macromolecule, to unity for a small solute that can freely enter the pore volume of the packing. To ensure that ΔH = 0, KSEC of all sample components must range from 0 to 1; if not, the composition of the mobile phase should be adjusted. If unsuccessful, an SEC packing with a different chemical composition should be chosen, or, in some cases, the column temperature should be increased. However, even if 0 ≤ KSEC ≤ 1, there are still some cases when ΔH ≠ 0, such as macromolecular crowding caused by concentration effects, or ion inclusion or ion exclusion, which may occur when analyzing polyelectrolytes, as discussed in detail in reference 4.
Influence of Temperature on Column Performance
To a first approximation, column temperature will not play a significant role in the SEC separation process if ΔH = 0, based on equation 3. A dramatic example of this effect is the SEC of three polydisperse poly(ethylene glycol) samples (PEG 200, 300, and 500) with water as the mobile phase using a set of two TSKgel G-Oligo-PW columns (Tosoh Bioscience) shown in Figure 3 (5). The three PEG samples were injected individually at column temperatures of 25 °C and 60 °C. This drastic temperature swing of 35 °C only slightly shifted peak maxima of the multitude of peaks in these PEG samples — a magical example of theory validation. As an added bonus, peak widths decreased, resulting in improved separation of most components.

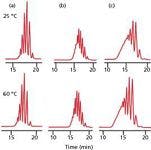
Figure 3
A thermodynamically good solvent should be used as the mobile phase to decrease the effect of temperature on hydrodynamic volume expansion or contraction of macromolecules (6). Furthermore, column temperature should be set as high as possible to reduce mobile-phase viscosity for increased plate count and sample solubility. Obviously, soft gels should not be used as the packing material to avoid pore-structure shrinkage or expansion with temperature changes.
Although column temperature fluctuations will not disrupt the SEC separation mechanism, in actual practice, the pump, column, and all mobile phase flow lines should be thermostated for reduced baseline noise and drift, and to keep flow rate constant, factors that can have a significant impact on SEC reproducibility (7). Two such instruments are now available that meet these requirements: the EcoSEC GPC System from Tosoh Bioscience (7) and Agilent's Infinity series of HPLC systems, most notably the Agilent PL-GPC 220 system, which has thermostated injection valves, flow lines, and detector cells for dedicated SEC operation at high temperature.
Calibration
Because SEC is a relative method, not an absolute method, of determining MW, the key element is its calibration. As shown in Figure 4, SEC calibration is a plot of log MW against elution volume for a series of monodisperse polymer standards. In this figure, Mo is the MW of an excluded macromolecule and Ml is the MW of a small molecule that is eluted at the total permeated volume. There are other types of calibration approaches (4,8), including the use of on-line viscometry and light scattering detection (9), that are not described in this article. It should be emphasized that the separation depends on molecular hydrodynamic volume differences, that is, the statistical averaged volume that is swept out by a tumbling and rotating, flexible, solvated macromolecule. As a result, any parameter that relates to MW, such as hydrodynamic volume or even diffusion coefficient, can be used as the ordinate, rather than MW.

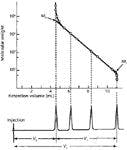

Figure 4
Resolution
The SEC resolution equation, modeled after the usual resolution definition of the extent of separation of two neighboring peaks, is

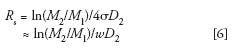

where D2 is the slope of the calibration plot, that is, log M vs. elution volume (Figure 4), M1 and M2 are the molecular weights of two nearly monodisperse polymer standards, and σ is the average peak standard deviation of the two monodisperse polymer standards. The average peak width, w, of the two polymer standards can be used to approximate σ. (The natural logarithm form in equation 6 is used to be consistent with Yau's derivation of equation 7) (10). It is important to realize that σ (or w) values should be obtained with monodisperse polymers that are chemically identical to those of the sample analyzed under the same experimental conditions, that is, injection volume, injection concentration, and flow rate.
A simplified form of the resolution equation useful for column performance comparisons that depends only on σD2and is independent on column length is (8,10):

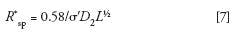
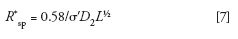
where R*sp is the specific resolution normalized with respect to column length L. Here σ' is the standard deviation of a small monodisperse compound that has a KSEC of unity. Thus, the variability associated with Rs measurements using polymer standards of low, but finite polydispersities, are eliminated using the R*sp parameter. Although useful for column performance comparisons, σ' values will be underestimated with respect to σ values.
Peak Broadening
Peak broadening (as well as peak skewing, better known as peak asymmetry) plays a critical role on the accuracy of MW measurements. Unfortunately, because of the complicated nature of peak broadening and associated corrections, most chromatographers shy away from its use. Furthermore, the increased popularity of light-scattering detectors has overshadowed its use. (It should be noted, however, that although light-scattering detectors measure absolute MW values independent of broadening, the concentration detector output does require corrections.)
The influence of peak broadening on MW measurements can be determined using the following equations that predict the percent relative errors encountered when determining number- and weight-average MWs from a calibration curve (8,10):

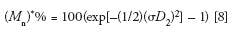
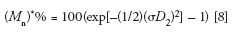
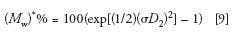
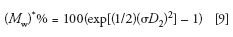
The reason for the exponential dependency of M* on (σD 2 )2 is the fact that log MW is used in the SEC calibration plot; thus, a small increase in peak broadening, measured as an elution volume increment, ΔVe, will be amplified when transforming Ve + ΔVe to log MW, and then to a MW value.
Practical Considerations for Increasing Resolution
Decreasing Calibration Slope, σD2
Because SEC resolution and accuracy depend on σD2, we will now examine approaches for decreasing this product. The most important approach for decreasing peak broadening is to use columns with small particle diameters, which is an inherent property of the column (Table I). Although column manufacturers should continue to strive to reduce particle size, there is a lower limit required to prevent the onset of shear rate degradation of polymers, as discussed in a later section. For SEC of samples that are larger than ~1 ×10⁶ MW, we cannot go much below about 5 µm or else we run the risk of degrading macromolecules through shear. Of course, flow rate and injection concentration can be reduced to help prevent this type of degradation.
Packings also need to have narrow particle-size distributions to prevent channeling and should be spherical to form uniform packed beds. Lastly, column temperature should be set as high as possible to decrease resistance to mass transfer of solutes, and the flow rate should be adjusted to obtain minimum HETP values.
If the calibration slope is linear, it can be calculated using the following equation:

where log ΔM is the MW range for a given pore volume Vi . Thus, the key requirement for SEC packings is that they should have large pore volumes for a given MW separation range given that

Because Vi is an inherent property of SEC columns and cannot be experimentally changed, we are at the mercy of column manufacturers to develop polymerization processes to maximize Vi. For large-pore-size packings, this feature is difficult to accomplish, because it requires highly porous packings with large openings, which amounts to a network or web-type of packing that is able to withstand high pressures used for the column packing process. Obviously, smaller-pore-size, highly porous packings for the separation of lower MW components is possible. Another direction to take is to compact or force more packing into a column to increase Vi at the expense of reducing Vo, the interstitial volume.
Increasing column size
Experimentally we can also easily increase Vi by increasing column length L. Given that Vi is directly proportional to L, and peak broadening is proportional to the square-root of L, then (4)


For example, to double the resolution of a separation, we would need four of the same column; however, analysis time would be compromised by a factor of four. Another approach that is often overlooked is to use larger-diameter columns. Give that Vi scales with the square of the column diameter for a given column length, then

Reducing Extracolumn Volume
SEC instrumentation should have reduced extracolumn volume, especially the inlet-tube configuration of the refractometer, to minimize peak broadening and skewing. Tubing used for interconnecting detectors, such as the triple-detector system (refractometer, light scattering photometer, and viscometer), must have minimum-volume unions, square-cut tubing ends, with no sharp, internal ledges to minimize peak skewing and extracolumn peak broadening. Injection volume, a major source of peak broadening, should be minimal. When appropriate, peak broadening and asymmetry correcting software should be installed.
Choosing Column Pore Sizes
Still another means of increasing resolution is to tailor the pore size to accommodate the exact MW separation range required of the sample. For example, if one originally uses a 25-cm mixed-bed column that covers a five-decade MW separation range, and the MW range of samples is only about two decades of the same MW range (which is not that uncommon), only about 40% of the column is being used. In other words, 60% of the calibration plot not only is "wasted," but also contributes "15-cm worth" of peak broadening and analysis time to the separation, as well as unnecessary back pressure. By switching to a 25-cm column of an appropriate single-pore-size packing, we would be able to increase resolution by a factor of about 1.6, while retaining the same amount of peak broadening, analysis time, and back pressure.
Changing Macromolecular Conformation in Solution
We should not forget that the calibration slope depends strongly on macromolecular conformation. Spherical or branched macromolecules are compact structures, with rather steep slopes, while macromolecules that are extended or elongated have shallower slopes. Random coils have slopes between the two extremes. Thus, for some types of biopolymers, we can control the slope by adjusting the nature of the mobile phase. A good example is the separation of proteins that have globular or compact conformations when using simple buffers as the mobile phase. If, however, we add a denaturant to the mobile phase, such as sodium dodecyl sulfate, we can readily change protein conformation to an extended, denatured state, giving rise to a shallower slope for improved resolution. Linear polysaccharides, polyelectrolytes, and semirigid synthetic polymers all have elongated conformations when analyzed in a thermodynamically good mobile phase. As a result, these classes of macromolecules naturally give shallow slopes or good resolution. However, most nonionic, synthetic polymers give lower resolution because of their random-coil conformations.
Calibration Slope Linearity
In practice, the SEC calibration plot should be linear over the MW of interest (Figure 4). A significant amount of curvature can introduce error when fitting a higher-order equation; furthermore, a nonlinear slope cannot be calibrated with a single broad MW standard. Occasionally, calibration curves can suffer from discontinuities and abrupt slope changes as a result of the nature of standards used, or because inappropriate columns are linked together. In fact, when using combinations of individual pore-size columns, both the chromatogram, as well as the calibration slope, may exhibit dislocations or inflection; this phenomenon led to the development of mixed-bed packings and then to multipore materials.
For increased accuracy, it is best to model the slope using equations that are linear or low-order fits. This can be accomplished by using single-pore-size columns each with 1.5–2 decades of MW separation of a random polymer (8). To extend the MW range, linear calibrations can be obtained by one of three methods: a column set of two or more different single-pore-size packings of matched pore volume; a set of two or more like columns each filled with mixtures of packings of different pore sizes (mixed-bed columns); or a column set of two or more similar columns, each filled with particles composed of a range of pore sizes (multipore packings). Note, however, that if the pore volume, Vi, and Vi/Vo ratio of each column are not matched, not only will there be dislocations in the calibration slope, but the chromatograms and calculated MW distribution profiles also will show dislocations or inflections. These artifacts can be rather misleading when interpreting data.
Other Considerations
Peak Capacity
Another parameter that is related to column performance is peak capacity (11):

where n is the number of peaks with the same peak width that can be separated within the pore-volume window with a resolution of unity, and N is the number of theoretical plates, which is inversely proportional to σ2 . As compared to enthalpic separations in which n can theoretically reach thousands with gradient elution (using a different form of equation 14), SEC is limited to about 15–20 separated monodisperse components, as shown in Figure 5 with a separation of a 12-component fatty acid mixture (12). Please note that equation 14 is applicable for the separation of only monodisperse samples, such as small molecules and oligomers, but nevertheless shows the importance of using a set consisting of many high-resolution SEC columns with the appropriate separation range.


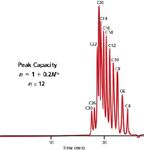
Figure 5
Column Dimensions
SEC separations take place within a very small elution volume range, from the interstitial volume, Vo, to the total elution volume. To reduce the influence of extracolumn volume, SEC columns generally have larger diameters than those found in enthalpic HPLC columns. For SEC–mass spectrometry (MS) analyses, where low flow rates are required, it is better to use conventional-diameter SEC columns and flow splitting, rather than small-diameter or narrow-bore columns. In addition, as discussed above, larger diameter columns favor increased resolution. An example of a 20-mm i.d. column that is 50-cm long, operated at a high flow rate of 6.0 mL/min, is presented in Figure 6 (13). Note the good resolution of a seven-component polystyrene mixture that is obtained in <1.8 min.


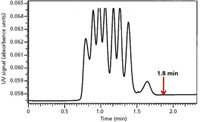
Figure 6
Polymer Shear Degradation
Macromolecules that have large hydrodynamic volumes (that is, extended conformations in solution), are quite susceptible to the elongational or extensional forces (strain rates) that are found in typical SEC runs (14). Such macromolecules are high MW (>800,000) synthetic polymers in good solvents, and extended high-MW biopolymers, such as polysaccharides, nucleic acids, and denatured proteins.
As is well known, to generate high plate numbers for increased resolution, SEC particle size must be small. However, as the molecular size of macromolecules approaches the dimensions of the interstices of the packed bed, elongational forces become prominent; when sufficiently large, these forces can rupture polymer chains as they flow through packed beds, creating low-MW fragments. In addition to the packed bed, extensional forces also occur when high-MW macromolecules pass through sintered frits placed at the ends of a column, as well as passages found in capillary tubing and unions. Moreover, elongational strain also acts on macromolecules at the instant they either enter or exit the pores of the packing, or, simply put, when one part of the polymer chain is at zero velocity in the stagnant pore volume, and the other portion of the polymer chain projects into the moving velocity streamlines within the interstitial volume.
The particle and pore sizes of the packing and the sintered frit porosity and inner diameter of capillary connections must be sufficiently large to prevent polymer shear effects (14). Furthermore, flow rate and injected sample concentration must be minimized to help eliminate polymer shear degradation. In fact, care must be taken when handling susceptible macromolecules, such as avoiding vigorous shaking, stirring, sonicating, or filtering during sample preparation (14).
Packing Stability
SEC packings, especially those that have large pore sizes and high porosities, can be quite fragile. Furthermore, packings can be subjected to high-pressure surges or "hammering" when injections are made or when the pump is first turned on, unless due care is exercised. In general, silica types of packings are more prone to shatter than cross-linked polymer packings because of their rigid structure. Another drawback of using silica packings is their finite solubility when used with aqueous buffers. Many types of SEC packings actually slough off fines during start up, or when injections are made, or even during normal operation. Moreover, fines can also be produced during column packing or left over from manufacturing.
These fines typically do not interfere with routine SEC analysis, unless light-scattering detection is used. When this happens, signal output from light-scattering detectors can be overwhelmed with flurries of spikes. Some column manufacturers are now addressing this issue by manufacturing columns that are suitable for use with light-scattering detectors because they are essentially free of packing debris or have been stabilized during manufacturing. One of the first particle-free or low-shedding columns was introduced more than 10 years ago by Polymer Laboratories, now Agilent Technologies.
Surface Chemistry of Packings
Because the emphasis of SEC is on the physical properties of packings, rather than their surface chemistry, there are relatively fewer types of SEC packings available as compared to enthalpic HPLC material. Most nonionic synthetic polymers can be separated with cross-linked polystyrene or poly(styrene–divinylbenzene) packings, which have been available since the inception of the technique. A range of hydrophilic polymeric packings, such as those based on cross-linked methacrylates, are useful for SEC of hydrophilic polymers or polyelectrolytes using polar, alcoholic, or aqueous mobile phases. Other specialty hydrophilic packings have been developed for cationic biopolymers and synthetic polyelectrolytes, some consisting of unusual chemistries. As discussed previously, specialty SEC columns are also available for use with light-scattering detectors, and for specific pH conditions.
Polymeric packings are now the dominant type of SEC columns being used, since specific physical or chemical properties are more easily controlled than with silica-based packings. With respect to silica-based packings, hydrophilic-coated silica is marketed mainly for biopolymers. SEC columns made for specific applications will be reviewed in the July issue of LCGC.
Wrapping Up
Column properties are defined as those characteristics that are inherent to the packing and column configuration, as supplied by the manufacturer. A detailed summary of these characteristics is given in Table I. Users cannot change these properties and thus must rely on the imagination and knowledge of the manufacturer. It is our experience that column manufacturers are sometimes willing to custom synthesize material or pack columns of unusual dimensions to meet the needs of chemists with special applications. Fortunately, there are a number of parameters that can be experimentally adjusted or optimized, and these are summarized in Table II. We hope that chemists copy this table and post it near their SEC instruments to help ensure that separations are being done at optimum conditions.

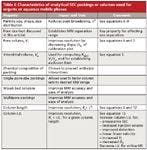
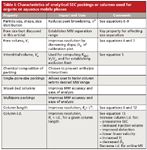
Table I
Acknowledgments
Both authors are indebted to Ronald E. Majors, of Agilent Technologies, Inc., for his help and guidance in the preparation of this manuscript. One of the authors (HGB) expresses his gratitude to Cara Tomasek of Tosoh Bioscience LLC for preparing some of the figures for publication.

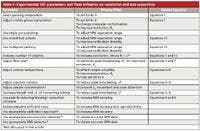
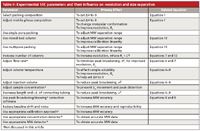
Table II
Greg Saunders is the product manager responsible for the GPC/SEC consumables portfolio at Agilent Technologies.
Howard Barth is now retired from the DuPont Company. He is available for consultation in chromatography, analytical chemistry, and technical editing and writing. Please direct correspondence to: howardbarth@gmail.com.
References
(1) In this article, the term size-exclusion chromatography (SEC) is used for either the separation of biopolymers using aqueous mobile phases or for the separation of synthetic polymers with organic mobile phases. Gel permeation chromatography (GPC) is the term applied to the separation of synthetic polymers with organic mobile phases, and gel filtration chromatography (GFC) is reserved for aqueous-phase separation of biopolymers.
(2) H.G. Barth, LCGC No. America,LC Column Technology supplement, 22, 43 (2004).
(3) H.G. Barth and G.D. Saunders, LCGC No. America,Recent Developments in LC Column Technology supplement, 24(4S), 38 (2006).
(4) S. Mori and H.G. Barth, Size Exclusion Chromatography (Springer Verlag, Berlin, 1999).
(5) Tosoh Bioscience, Separation Report, GFC analysis of water soluble oligomers on TSKgel PWXL series, No. 39, p. 9.
(6) M.L. Miller, The Structure of Polymers (Rheinhold, New York, 1966).
(7) X. Villarreal and H. Barth, Am. Lab. 41(4), (2009).
(8) A.M. Striegel, W.W. Yau, J.J. Kirkland, and D.D. Bly, Modern Size Exclusion Chromatography, 2nd Ed. (Wiley, New York, 2009).
(9) C. Jackson and H.G. Barth, in Handbook of Size Exclusion Chromatography and Related Techniques, 2nd Ed., C.-S. Wu, Ed. (CRC Press, Boca Raton, 2004), Chapter 4.
(10) W.W. Yau, J.J. Kirkland, DD. Bly, and H.J. Stoklosa, J. Chromatogr. 125, 219 (1976).
(11) J.C. Giddings, Anal. Chem. 39, 1027 (1967).
(12) Tosoh Bioscience, Separation Report, Separation of fatty acids on TSKgel HXL, No. 28, p.11.
(13) Polymer Standards Service (PSS), High-speed, high-flow rate GPC of polystyrene standards, Polymer Standards Service GmbH, Germany.
(14) H. Barth and F.C. Carlin, Jr., J. Liq. Chrom. 7, 1717 (1984).