High-Throughput Screening of Biotherapeutics for Developability and Preformulation with Dynamic Light Scattering
Dynamic light scattering (DLS), widely recognized for its ability to detect aggregation in purified protein solutions, is actually far more versatile and may be applied to the evaluation of stability and viscosity of therapeutic proteins and other biopharmaceuticals. In a fully automated, microwell plate reader format, DLS constitutes a high-throughput biophysical screening technique for early-stage assessment of candidate developability and optimal formulation conditions.


Photo Credit: Yiw Shoot Raw/Shutterstock.com

Daniel Some, Wyatt Technology Corp., Santa Barbara, California, USA
Dynamic light scattering (DLS), widely recognized for its ability to detect aggregation in purified protein solutions, is actually far more versatile and may be applied to the evaluation of stability and viscosity of therapeutic proteins and other biopharmaceuticals. In a fully automated, microwell plate reader format, DLS constitutes a high-throughput biophysical screening technique for early-stage assessment of candidate developability and optimal formulation conditions.
Assessing a drug candidate’s suitability early in the discovery and development stages is essential for reducing the risk of costly downstream failure. One of the primary technologies for assessing aggregation, stability, and viscosity of biotherapeutics, from proteins, monoclonal antibodies, and peptides to attenuated viruses, is dynamic light scattering (DLS) (1). DLS measures particle size and size distributions, from less than a nanometre and up to several micrometres, without disturbing the sample. The measurement takes place on timescales of seconds to minutes, and the sample is fully recoverable. This makes DLS a particularly effective technique for assessing aggregation and stability in early, as well as late stages. In addition, viscosity can be measured with DLS using probe particles, such as common polystyrene latex beads.
Automated, high-throughput dynamic light scattering (HT-DLS) helps streamline the candidate selection and preformulation processes. HT-DLS performed in microwell plates typically provides 10–100× more measurements than would be collected using traditional cuvette-based DLS. A HT-DLS plate reader can be used as a standalone instrument or as part of a larger automated formulation workflow (2). Requiring just a few microlitres of solution for each sample in standard plates, unattended HT-DLS measures multiple biotherapeutic candidates in a variety of formulation and environmental conditions.
HT-DLS for Developability and Preformulation Studies
HT-DLS is a non-invasive, non-perturbative method of measuring protein and particle size distribution in terms of hydrodynamic radius (Rh) across a wide range, covering 0.5–1000 nm. The fundamental strength of HT-DLS is its ability to determine changes in protein size, conformation, and aggregation or oligomerization state across a range of conditions, allowing users to rigorously investigate a candidate’s behavioural profile.
The measurement of DLS does not depend on ambiguous reporter signals, such as intrinsic or extrinsic fluorescence, or exothermic or endothermic processes, all of which may fail to discriminate between uninteresting signals and those conformational changes of actual significance to stability. Rather, DLS directly indicates a significant physical change in conformation as well as aggregation state.
HT-DLS delivers essential insight into biopharmaceutical candidates and formulations, including
- Aggregation of nanometre to subâmicrometre particulates
- before and after applied stress
- during accelerated thermal stress
- under pH stress
- Stability and aggregation propensity studies
- colloidal stability or selfâassociation, via concentration dependence
- thermal conformational stability, via temperature ramps
- chemical denaturation conformational stability, via denaturant gradients
- Viscosity of high-concentration protein formulations.
Data are generated in 10 s for each well, meaning an experiment covering 384 sample wells consisting of a variety of different candidates, pH values, ionic strengths, and replicates can be completed in just 90 min. The ability to rapidly scope a drug product’s performance under hundreds of different conditions allows scientists to more readily implement quality by design (QbD) and design of experiments (DoE) methods (3), to meet regulatory and corporate productivity expectations.
Materials and Methods
All measurements described were peformed with the DynaPro Plate Reader II (Wyatt Technology). Samples were IgG and other therapeutic proteins.
Measuring Gross Aggregation
Protein aggregation is a major concern during biopharmaceutical development. Unchecked aggregation reduces the efficacy of a biotherapeutic, affects its manufacturability, and may present a serious immunogenic risk to a patient.
By monitoring changes in particle size distribution with DLS, formulators are able to map out protein aggregation as a function of pH or excipient concentration. Alternatively, aggregation may be tracked through a dynamic temperature range, or followed during key waypoints in the formulation process. Figure 1 shows the particle size distribution of two monoclonal antibody (mAb) formulations with and without sucrose, before and after lyophilization. Lyophilized samples were reconstituted to the same concentration as pre-lyophilized solutions.
Before lyophilization, the size distributions of both samples were monomodal. The pre-lyophilized solution containing sucrose (Figure 1, solid red line) has a marginally wider distribution peak, which suggests that the small sucrose molecules impart some polydispersity. It is clear that the lyophilized mAbs contain large aggregates, with the PBS sample in particular forming extremely large species post-lyophilization (Figure 1, green dotted line).


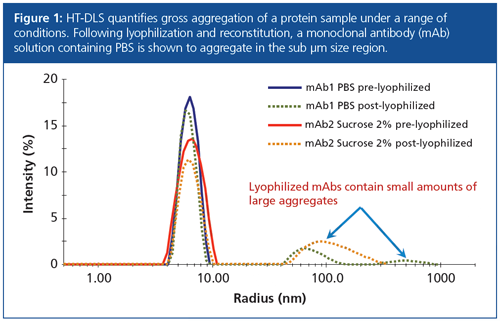
Despite the appreciable intensity values of the post-lyophilized aggregate peaks between 50–200 nm, the number of these aggregates is very small. The lyophilized antibody’s primary peak between 4–10 nm has an integrated intensity of only 80%, but its total percentage mass was calculated to be 99.6%. Aggregates in the 50–200 nm range therefore account for only 0.4% of the overall protein population. Whether this percentage falls within the limits of suitability depends on the candidate; the role of HT-DLS is to quickly provide the information required for formulators to make this decision.
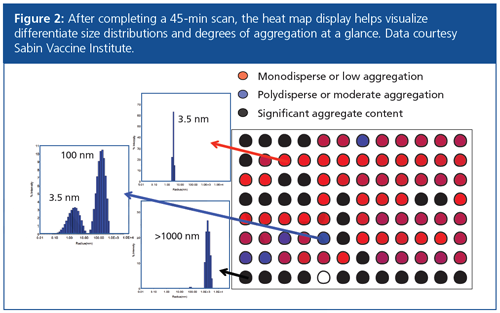
Rapid visualization of the aggregation behaviour of dozens or hundreds of samples in a plate is accomplished using heat maps, such as the one shown in Figure 2. Colour coding was applied to differentiate between unaggregated, lightly aggregated, and heavily aggregated samples (red, blue, and black, respectively). This visualization approach allows users to quickly obtain an overview of the results and pick out regions of the plate corresponding to specific excipients, pH conditions, or candidate molecules that appear promising for further study.


Imaging Contaminants and Precipitates
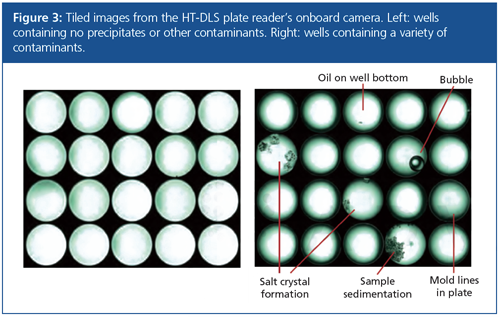
The HT-DLS instrument is equipped with a camera that can be programmed to acquire images of each well after DLS measurement. The images can discern precipitation and crystallization because particulates sink to the bottom of the well (Figure 3).


Measuring Thermal Conformational Stability
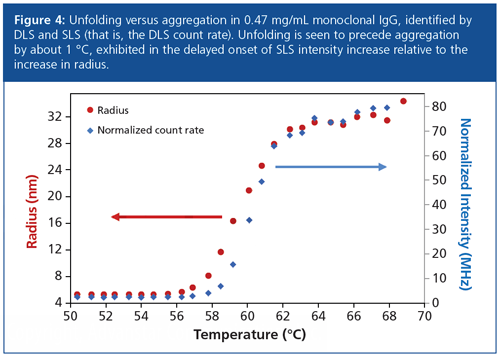
DLS allows formulators to probe other aspects of protein behaviour, such as conformational changes across a dynamic temperature range, identified as changes in size. Moreover, DLS systems inherently incorporate relative static light scattering (SLS) measurements in the form of the DLS count rate. SLS is proportional to molar mass, a property that increases in value during aggregation but remains unchanged during purely conformational changes, and therefore enables differentiation between folding and aggregation behaviour.
IgG exhibits both unfolding and aggregation as shown in Figure 4. While the large changes in both size (DLS) and count rate (SLS) above 60 °C are clearly associated with aggregation, a closer look in the vicinity of the transition temperature clarifies the different onset temperatures for unfolding (58 °C) and aggregation (59 °C).


Instruments that measure intrinsic fluorescence and SLS simultaneously use ultraviolet (UV) illumination to assess aggregation. However, UV is known to actually induce protein aggregation (4), making this approach to aggregation analysis highly suspect, especially for antibody–drug conjugates. The wavelength of the HT-DLS instrument, 830 nm, is not capable of inducing aggregation, guaranteeing a reliable measurement.
Holding a series of formulations at a constant temperature and measuring the rate of aggregation as expressed in the changes in particle size (radius) and molecular weight (via count rate) is another effective way to assess stability and rankâorder formulations. This type of stability assay should generally be performed at a temperature well below the temperature of unfolding. HTâDLS affords parallel aggregationârate measurements of large numbers of candidates and formulation conditions.
Measuring Chemical Conformational Stability
An additional means for quantifying a molecule’s stability against conformational changes is chemical denaturation gradients. A denaturant, such as urea or guanidine HCl, is titrated into the protein solution to determine the denaturant concentration at which the molecule is present in equal amounts in the form of folded and unfolded species, and hence the Gibbs free energy of unfolding.
The common method for assessing unfolding in a chemical denaturation measurement is intrinsic fluorescence. However, DLS is a superior quantifier of unfolding because it does not rely on the presence of fluorophores, does not lead to photon-induced damage, and is a positive, reliable indicator of unfolding via changes in actual size. Chemical denaturation screening of a multidomain protein using HT-DLS has been demonstrated by Yu et al. (5).
Measuring Aggregation Propensity
Colloidal stability analysis with HT-DLS allows formulators to determine the magnitude of attraction between molecules in solution and is indicative of native-state protein–protein interactions. This is accomplished by measuring the change in a protein’s diffusion coefficient as a function of concentration. If the diffusion coefficient decreases with a decrease in concentration, then larger particulates are forming and self-association occurs. If the coefficient increases with concentration, then molecules are likely repelling each other and are stable in solution.
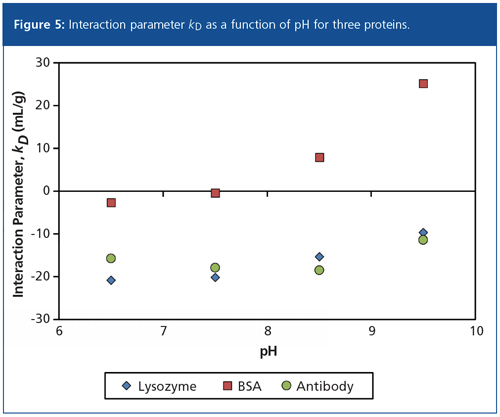
These measurements are described by the diffusion interaction parameter kD, the relative slope of the diffusion coefficient versus concentration. The sign and magnitude of kD directly relates to aggregation propensity using colloidal interactions. When kD is positive, repulsive forces dominate and the solution is more likely to be stable. When kD is negative, attractive forces dominate and the sample is likely to aggregate. The diffusion interaction parameter kD has been shown to be an important stability-indicating parameter, perhaps even more useful to formulators than Tm (6).
In a kD screen, a series of concentrations are prepared for each sample and each buffer condition, and these are loaded into microwell plates for DLS analysis. A set of 4 pH × 6 concentration conditions for each protein sample, each with five replicates, takes about 20–30 min to complete. Figure 5 plots the kD values versus pH for three proteins; lysozyme and antibody are self-associative at all pH values, whereas BSA is stable above pH 7.


Using HT-DLS to Determine Viscosity
Finally, DLS can be used to assess formulation viscosity to help determine the long-term stability and deliverability of a biotherapeutic. In a DLS-based viscosity measurement, samples are spiked with polystyrene beads of a known diameter and radius. The particle’s apparent Rh, calculated from the diffusion coefficient and plugging in a viscosity value of 1 cP, will shift away from the true Rh proportionally to the actual solution viscosity. The results from DLS have been shown to correspond well to traditional rheological techniques, such as ball-and-cone viscometry (7). The advantage of using automated HT-DLS for viscosity measurements is that low-volume samples are assessed rapidly in the same plates and at the same time as a variety of other features, adding a further layer of detail to scientists’ understanding of their formulations.
Identifying the Best Candidates as Early as Possible
As the (bio)pharmaceutical industry targets increasingly complex biologic candidates, automated formulation and analytical workflows play an important role in streamlining the development process. Capable of performing 96 runs in under 45 min and 384 wells in 1.5–2 h, with completely unattended operation, highâperformance HT-DLS accelerates analysis time, reduces the need for expert operator supervision, and improves confidence in data quality. This level of automation provides developers with the depth of data and resources required to implement highly efficient development strategies for better performing, safer biotherapeutics.
References
- R.A. Rader, BioProcess Int. 11(3), (2013).
- D. Some, The Column 11(15), 11–14 (2015).
- F. He et al., J. Pharm. Sci. 100(4), 1330–1340 (2011).
- G.M. Cockrell, M.S. Wolfe, J.L. Wolfe, and C. Schöneich, Mol. Pharm. 12(6), 1784–1797 (2015).
- Z. Yu, J.C. Reid, and Y-P. Yang, J. Pharm. Sci. 102(12), 4284–4290 (2013).
- T. Menzen and W. Friess, J. Pharm. Sci. 103(2), 455–455 (2014).
- F. He et al., Anal. Biochem. 399(1), 141–143 (2010).
Daniel Some is Principal Scientist at Wyatt Technology Corp. where he is involved in the development of instrumentation, software, and applications of light scattering for the characterization of macromolecules, nanoparticles, and protein–protein interactions. His undergraduate degree in physics was awarded by the Technion–Israel Institute of Technology, and his Ph.D. in physics by Brown University, where he investigated ultrafast opto-electronic phenomena. He has authored several patents in the fields of semiconductor wafer inspection and light-scattering-based characterization of macromolecular interactions, and published in all of these fields.
E-mail: dsome@wyatt.com Website:www.wyatt.com