Hydrophilic Interaction Chromatography for the Characterization of Therapeutic Monoclonal Antibodies at Protein, Peptide, and Glycan Levels
LCGC Europe

These are exciting times to be involved in monoclonal antibody (mAb) and biopharmaceutical analysis. Advances in instrumentation, column technology, and reagents are providing analysts with a new set of tools to broaden their understanding of the highly complex products they are studying. A good example is hydrophilic interaction chromatography (HILIC). While the technique has been used for more than 20 years to profile enzymatically released and fluorescently labelled N-glycans, the introduction of new columns (sub-2-µm and widepore) has paved the way to explore the technique further. Remarkable separations at all levels of analysis, including protein, peptide, and glycan levels, have been demonstrated. With data from the authors’ laboratories, the versatility of HILIC in mAb analysis will be demonstrated in this month’s “Biopharmaceutical Perspectives”.

Photo Credit: molekuul_be/Shutterstock.com

Valentina D’Atri1, Emmie Dumont2, Isabel Vandenheede2, Davy Guillarme1, Pat Sandra2,3, and Koen Sandra2,3,1School of Pharmaceutical Sciences, University of Geneva, University of Lausanne, Geneva, Switzerland, 2Research Institute for Chromatography (RIC), Kortrijk, Belgium, 3anaRIC biologics, Evergem, Belgium
These are exciting times to be involved in monoclonal antibody (mAb) and biopharmaceutical analysis. Advances in instrumentation, column technology, and reagents are providing analysts with a new set of tools to broaden their understanding of the highly complex products they are studying. A good example is hydrophilic interaction chromatography (HILIC). While the technique has been used for more than 20 years to profile enzymatically released and fluorescently labelled N-glycans, the introduction of new columns (sub-2-µm and widepore) has paved the way to explore the technique further. Remarkable separations at all levels of analysis, including protein, peptide, and glycan levels, have been demonstrated. With data from the authors’ laboratories, the versatility of HILIC in mAb analysis will be demonstrated in this month’s “Biopharmaceutical Perspectives”.
Protein biopharmaceuticals have emerged as an important class of therapeutics for the treatment of various diseases including cancer, diabetes, cardiovascular diseases, autoimmune disorders, and others (1). Today, there are a wide range of biopharmaceutical formats and the fastest and largest growing class are monoclonal antibodies (mAbs) (2). In January 2017, there were 68 mAbs approved by the FDA for therapeutic use, and many more mAb products are currently in advanced clinical trials phases (3). The reason for the success of mAbs is related to their high target specificity (together with other various mechanisms of action) that leads to an improved benefit–risk ratio for patients compared to former treatments.
In terms of structure, mAbs are large tetrameric immunoglobulin G molecules with a molecular weight of circa 150 kDa, corresponding to around 1300 amino acids. They have a Y-like shape and are composed of four polypeptide chains, namely two identical light chains (Lc) of 25 kDa and two identical heavy chains (Hc) of 50 kDa, connected through several interchain disulphide bridges (4). For IgG1 subclass, 12 intrachain disulphide bridges, four within each Hc and two within each Lc, guarantee its structural integrity. In addition, two N-glycosylation sites are located in the crystallizable fragment (Fc) domain of the mAb occupied with complex and high mannose type glycans, which are known to play key roles in safety and efficacy (5,6). The glycan pattern is therefore considered as one of the most important critical quality attributes (CQA) and should be characterized in great detail and tightly controlled. Besides the glycosylation pattern, a variety of other modifications (that is, chemical and enzymatic) can also take place during the expression, purification, and long-term storage of mAbs, contributing to the high heterogeneity of the mAb products (7). In theory, there is only one single molecule cloned during the expression of a mAb, but in practice, hundreds of possible variants with a wide range of post-translational modifications (PTMs), such as deamidation, aspartate isomerization, oxidation, glycation, scrambled disulphide bridges, sequence variants, and aggregation may coexist. These microvariants can have an impact on function, stability, and efficacy of the mAb product, and in some cases, they can also seriously affect patient safety (8).
As a result of their very large size superimposed with an important micro-heterogeneity, mAbs have a structural complexity far exceeding that of small molecule drugs. To fully characterize a mAb sample, a variety of analytical tools has to be employed, including chromatographic, electrophoretic, and mass spectrometric methods. In addition, the product needs to be studied at the protein, peptide, and glycan levels (9). Among the chromatographic techniques, ion exchange chromatography (IEX), size-exclusion chromatography (SEC), and hydrophobic interaction chromatography (HIC) are considered as the reference methods for the characterization of, respectively, charge variants, size variants, and hydrophobicity variants at the protein level. These chromatographic approaches are particularly useful because they are considered as nondenaturing, meaning that they do not alter the structure of mAbs during their analysis. However, these techniques also suffer from an incompatibility with mass spectrometry (MS), which hampers peak identification. As a result of recent advances in column technology and inherent compatibility with MS, reversed-phase liquid chromatography (LC) has become an indispensable tool for mAb analysis (10). Reversed-phase LC is currently successfully applied at different levels of analysis (peptides after tryptic digestion, large mAb fragments after enzymatic digestion and chemical reduction, intact proteins) to acutely characterize mAbs. More recently, hydrophilic interaction chromatography (HILIC) has been proposed as an alternative to reversed-phase LC for the characterization of mAbs. Historically, HILIC has mainly been applied to the analysis of released glycans, but recently this chromatographic mode has been shown to be attractive to study glycosylation at all levels of analysis-glycan, peptide, and protein. This topic is the subject of the current instalment.
History, Principle of Operation, and Benefits of HILIC
The term HILIC was originally proposed by Alpert in the 1990s (11) to describe a chromatography technique based on hydrophilic partitioning between a water-enriched layer at the stationary phase surface and the less polar eluent of the mobile phase. For this purpose, a hydrophilic stationary phase is used (for example, bare silica or derivatized silica with various polar functional groups including amine, amide, cyano, diol) in combination with an aqueous organic solvent as mobile phase (12). The latter should contain more than 60–70% of an organic solvent, ideally an aprotic solvent such as acetonitrile. Various types of buffers, such as ammonium acetate or ammonium formate, can also be used to efficiently control the mobile phase pH, ionic strength, and ionization of the analytes. The interaction mechanism in HILIC is multimodal and involves (i) hydrophilic partitioning, (ii) the ion exchange between a charged analyte and the stationary phase, and (iii) the adsorption of the analyte at the surface of the adsorbent via hydrogen bonds (13,14). The extent of these different mechanisms depends on the stationary phase chemistry, the analyzed compounds, and the mobile phase conditions (pH, ionic strength, nature of organic modifier).
The main benefit of HILIC is its ability to retain hydrophilic compounds and as such has successfully been applied to the analysis of many different hydrophilic substances including amino acids, neurotransmitters, carbohydrates, nucleotides, and nucleosides.
Besides the analysis of polar compounds, HILIC can also be considered as a complementary technique to reversed-phase LC for the analysis of ionizable compounds such as drugs or peptides (14,15). Indeed, the elution order is almost reversed in HILIC (hydrophilic partitioning) compared to reversed-phase LC (hydrophobic partitioning). However, the strong contribution of additional mechanisms under HILIC conditions means that the achieved selectivity is often very different (and not only reversed) in HILIC versus reversed-phase LC. This behaviour has been highlighted with a mixture of different peptides in reference 16. Other major benefits of the HILIC mode are the lower back pressure and the improvement in electrospray ionization (ESI)-MS sensitivity, related to a more efficient desolvation of highly organic mobile phases (low surface tension of acetonitrile versus water). A gain in sensitivity with a factor up to 10 in HILIC–ESI-MS versus reversed-phase LC–ESI-MS has been reported (17,18). It must be stated, however, that this improvement may strongly depend on the nature of the compounds, the mobile phase composition, and the ionization source geometry.
The Use of HILIC in mAb Analysis
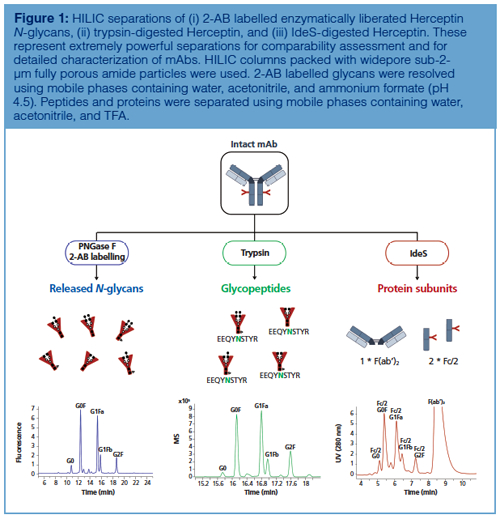
Figure 1 shows the different varieties of HILIC in mAb analysis. The technique is no longer restricted to the analysis of enzymatically liberated and fluorescently labelled N-glycans, but has in recent years broadened its scope. Indeed, the introduction of novel widepore sub-2-µm particles has allowed the successful analysis of glycosylation at both peptide (trypsin digestion) and protein subunit level (IdeS digestion). A more detailed description of the versatility of HILIC at these different levels will now be presented.


Glycan Level: HILIC combined with fluorescence detection and 2-aminobenzamide (2-AB) labelling is considered the gold standard to analyze enzymatically liberated N-glycans originating from mAbs (7,9). This method finds its origin in a 20-year-old paper titled “A rapid high-resolution high-performance liquid chromatographic method for separating glycan mixtures and analyzing oligosaccharide profiles” (19). The separation was performed on a column packed with 5-µm silica-based particles carrying amide functional groups, and was at that time considered as a normal-phase LC method, despite the use of an ammonium formate buffer at pH 4.4. Nowadays, this LC mode is termed HILIC and the separation is commonly performed on columns packed with sub-2-µm fully porous (FP) or sub-3-µm superficially porous particles (SPP), thereby substantially redefining the terms “rapid” and “high resolution” used in the original paper (20). Indeed, the reduced diffusion distances provided by sub-2-µm fully porous and sub-3-µm superficially porous particles result in superb and fast separations.


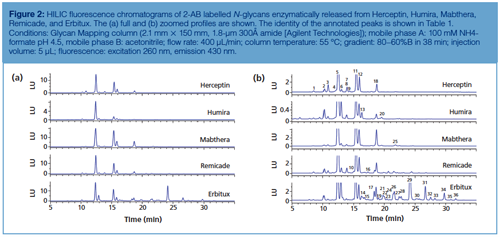
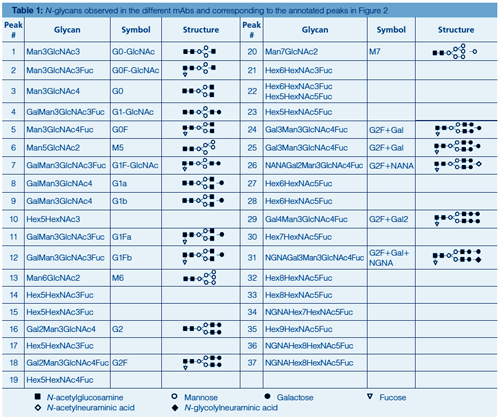
Figure 2 displays the HILIC separation with fluorescence detection of 2-AB labelled Herceptin, Humira, Mabthera, Remicade, and Erbitux N-glycans using fully porous sub-2-µm amide particles. Table 1 provides more information on the identity of the annotated peaks. High resolution and great detail in N-glycosylation is obtained. 2-AB labelled glycans elute based on their polymerization degree, that is, the higher the number of glycosidic bonds, the higher the retention. Sufficient selectivity differences exist to separate compounds with the same polymerization degree, including isomeric compounds such as G1Fa and G1Fb, which differ in the positioning of the galactose residue either on the α1-3 or α1-6 branch of the complex type glycans, and sialic acid-containing glycans, which provide increased retention over their neutral counterparts. Herceptin, Humira, Mabthera, and Remicade display greatly similar glycosylation profiles. These monoclonal antibodies, recombinantly expressed in Chinese Hamster Ovarian (CHO) cells, contain two conserved N-glycosylation sites in the Fc region, which are predominantly occupied with complex biantennary glycans. Erbitux contains four N-glycosylation sites-two in the Fc and two in the Fab region-and displays more heterogeneous profiles with both neutral and N-glycolylneuraminic acid (NGNA) containing biantennary glycans-the latter being the result of the recombinant expression in a murine myeloma cell line. The latter cell type also tends to generate N-glycans with the Gal-α-1,3-Gal glycotope, which has been shown to be responsible for hypersensitivity reaction to Erbitux (8).


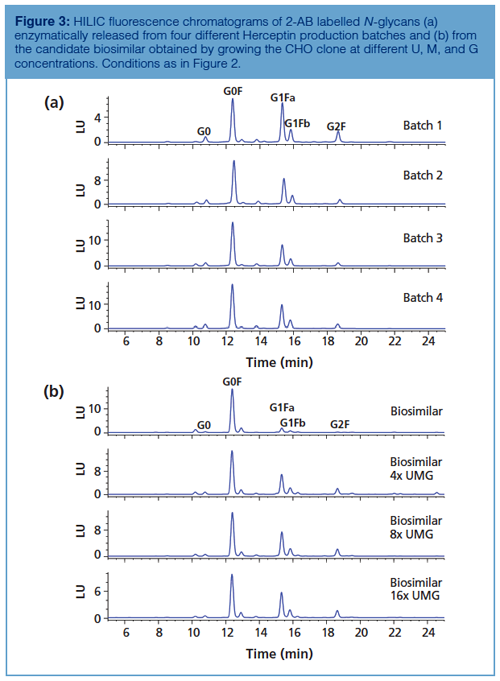
Since glycosylation is considered as an important CQA, lot-to-lot consistency is highly desirable. Afucosylated glycans (for example, G0) on the conserved Fc glycosylation site give rise to increased antibody-dependent cell-mediated cytotoxicity (ADCC), the Gal-α-1,3-Gal glycotope and N-glycolneuraminic acid might lead to immunogenicity, and the appearance of high mannose glycans on mAbs can result in faster clearance (8). Glycosylation is highly dependent on cell type and cell culture conditions, thereby making it challenging to produce mAbs with consistent glycan profiles. Figure 3(a) shows the N-glycan profiles of different Herceptin production batches. Figure 3(b) (upper chromatogram) displays the analysis of 2-AB labelled Herceptin candidate biosimilar N-glycans. The same type of complex N-glycans are observed on both the originator and biosimilar, but quantitative differences are revealed with an overexpression of G0F species on the biosimilar. Since glycosylation is a CQA, this undergalactosylation does not make the product similar enough to be considered by regulatory authorities as a Herceptin biosimilar. The biosimilar-producing CHO cell culture medium was subsequently tuned by feeding uridine (U), galactose (G), and manganese chloride (M) at different concentrations (21). These are the substrates and activator of the galactosyltransferase responsible for donating galactose residues to G0F and G1F acceptors. Figure 3(b) (lower chromatograms) shows the N-glycan profiles obtained by growing the biosimilar-producing CHO clone at elevated U, M, and G concentrations. It is observed that the ratio G1F:G0F increases with higher concentrations of U, M, and G. From these results, it can be concluded that conditions that allow the fitting of the glycosylation of the biosimilar within the originator specifications can be found and that HILIC is an ideal tool to monitor the changes in glycosylation.


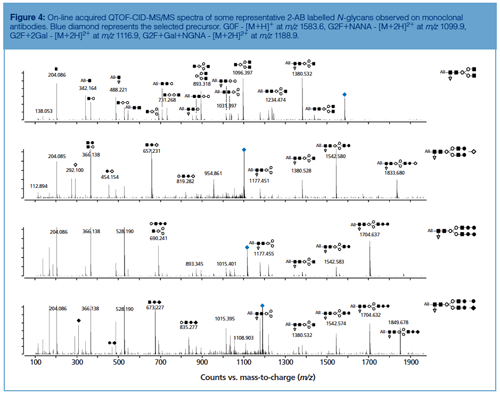
Peak identity from HILIC chromatograms is typically retrieved based on glucose unit (GU) values obtained by normalizing LC retention times against a dextran ladder (19,22), by implementing exoglycosidase sequencing (19,22) or by hyphenating to ESI-MS (20). The MS/MS spectra of selected 2-AB labelled N-glycans commonly observed on mAbs are displayed in Figure 4. Collision-induced dissociation (CID) of protonated labelled N-glycans typically results in glycosidic cleavages that provide compositional and sequence information. Since the reducing end is labelled, fragments can be more unambiguously assigned. Underivatized sugars frequently yield fragment ions that are derived from multiple cleavages that cannot be attributed to a unique structure. Glycan MS/MS experiments reveal hexose, N-acetylhexosamine, and deoxyhexose based on mass values. The identity of the monosaccharides, that is, mannose, galactose, N-acetylglycosamine, and fucose, is typically inferred by making assumptions based on the compound class and biosynthetic rules.


While reductive amination with 2-AB is well adapted in many laboratories, it suffers from limited MS sensitivity. Consequently, 2-AB has recently been challenged by novel reagents that allow more sensitive MS measurements (23,24).
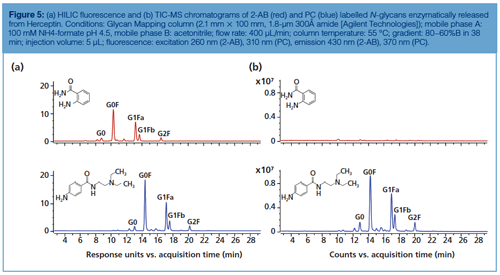
Figure 5 compares the HILIC separations as well as fluorescence and MS performance of 2-AB and procainamide (PC)-labelled Herceptin N-glycans. Both show comparable glycan separation, but the latter displays a slightly higher fluorescence (factor 1.5) and a 50-fold better ESI efficiency, which can be explained by the high proton affinity of the PC basic tail (tertiary amine).


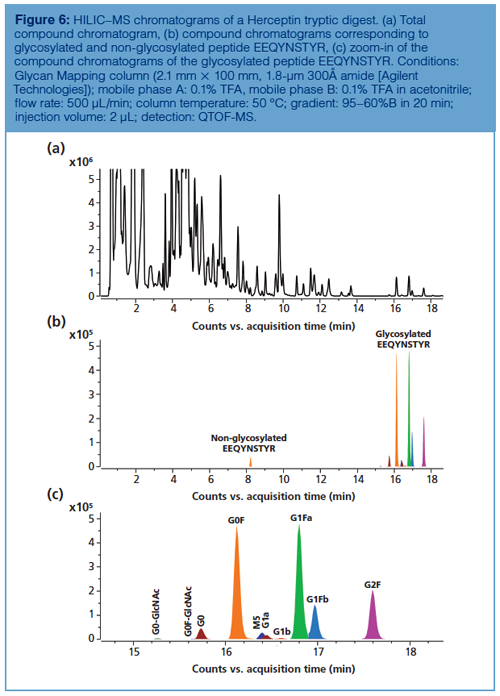
Peptide Level: Reversed-phase LC–MS is the method of choice for peptide mapping of mAbs because it allows the confirmation of the amino acid sequence and reveals modifications and modification sites at very low levels. HILIC has been used, less extensively despite the fact that some clear benefits over reversed-phase LC have been demonstrated for the separation of glycosylated peptides. As demonstrated by Gilar et al., glycosylated peptides are more strongly retained on an amide column and separated from the non-glycosylated peptides present in the digest (25). In addition, the different glycans attached to a given peptide are also chromatographically resolved, with an elution order similar to HILIC separation of released 2-AB labelled glycans, yet at lower chromatographic resolution. This is illustrated in Figure 6, which shows the mapping of a Herceptin digest on a column packed with fully porous sub-2-µm 300Å amide particles. Compared to reversed-phase LC-based peptide mapping, the elution order is reversed and glycans are baseline resolved. Note the presence of an earlier eluting peak corresponding to the nonglycosylated peptide, which elutes later than the glycopeptide on reversed-phase LC. The readers are advised to consult reference 26 for a view on the reversed-phase LC chromatogram of the same digest.


HILIC has also been used as the first dimension in LC×LC peptide mapping (HILIC × reversed-phase LC) of mAbs. It compared unfavourably to the combinations SCX × reversed-phase LC and reversed-phase LC × reversed-phase LC (27). With the introduction of active modulation valves, which allow an improved compatibility of solvents between the two dimensions, more efforts in combining HILIC with reversed-phase LC in a two-dimensional setup are expected in the coming years.
Protein Level: HILIC analysis of mAbs at the protein level is emerging as a new and powerful alternative to released glycan or peptide level analyses for characterizing glycosylation. Indeed, this approach is quite new and became possible only thanks to the recent improvements in column technology (sub-2-µm widepore amide stationary phase). Periat et al. (28) were the first to report the potential of HILIC as an orthogonal approach to reversed-phase LC for the analytical characterization of mAb glycoforms at the protein level. Compelling separations were obtained for a set of relevant biopharmaceuticals, including Herceptin, performed at intact and subunits levels. Crucial points related to HILIC-based chromatographic method development were also discussed, including the impact of mobile phase temperature, injected volume, and initial gradient conditions. Compared to reversed-phase LC, where protein adsorption could lead to poor recoveries at mobile phase temperatures lower than 60 °C, this effect was less pronounced in HILIC. For example, for intact Herceptin, up to 80% of the original peak area was indeed recovered at 40 °C in HILIC versus only 2% recovered at the same temperature in reversed-phase LC (28). Particular care should be devoted to the sample diluent because it may be responsible for poor performance in HILIC (peak distortion, drop in efficiency, or low signal intensity) (29). Ideally, samples should be dissolved in a diluent that matches the initial mobile phase composition, but this is typically not possible when dealing with protein analysis because a high percentage of acetonitrile could lead to protein precipitation. For this reason, aqueous solutions have to be selected. However, in HILIC conditions, water has the strongest eluotropic strength and, when used as sample diluent, it hampers the correct protein focusing at the column inlet, resulting in severe peak distortion, which affects adsorption and retention. To overcome this issue, an optimized aqueous injection can be achieved by helping the focusing onto the column. This practical loophole can be utilized through the inclusion of a fast (0.2 min), high acetonitrile (85%) initial ramp at the beginning of the gradient, together with the decrease of the injected volume down to 0.1–0.2% of the column volume (corresponding to 0.5–1 µL for a 150 × 2.1 mm, 1.7-µm wide pore column) (28). Regarding the HILIC resolving power of glycoforms, the comparison of the chromatographic profiles obtained for intact, reduced, IdeS digested, or IdeS digested and reduced Herceptin samples was also assessed. Given the size of the mAb (150 kDa), the fine resolution of the glycoforms at the intact level is currently not feasible. Subunit analyses, however, allow a suitable separation of the glycoforms (28).
Various approaches can be applied to obtain diverse mAb subunits (30). For instance, chemicals such as dithiothreitol (DTT) or tris(2-carboxyethyl)phosphine (TCEP) allow the reduction of the disulphide bridges, yielding two heavy chains (Hc, around 50 kDa) and two light chains (Lc, around 25 kDa). Another option is to use IdeS enzyme, which specifically cuts the antibody just below the hinge region, producing a homogenous pool of F(ab’)2 (around 100 kDa) and Fc/2 fragments (around 25 kDa). Finally, by combining the two approaches (enzymatic digestion and chemical reduction), it is possible to produce three main fragments (that is, Fd’, Fc/2, and Lc) of around the same size (25 kDa) that can easily be analyzed with LC–MS instrumentation.
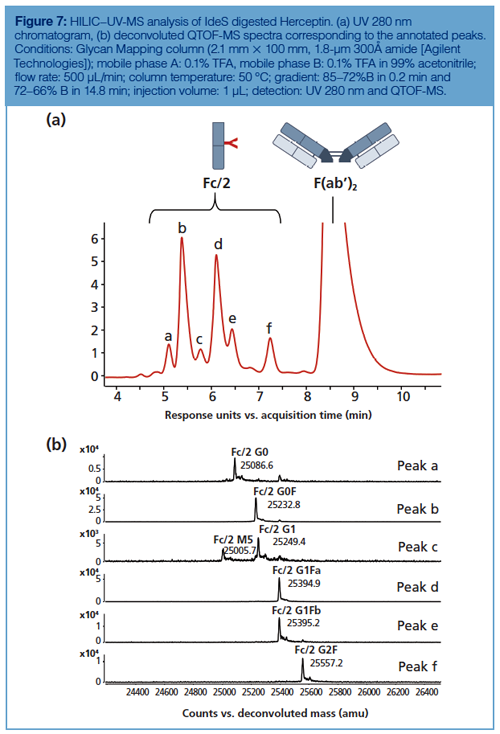
IdeS digestion alone is often sufficient to get amenable subunits for glycan profiling because the Fc/2 fragment contains the conserved N-glycosylation site. The glycosylation pattern of Herceptin obtained by HILIC–MS upon IdeS digestion is presented in Figure 7. The main peak was assigned by MS as the F(ab’)2 fragment, while all the other peaks corresponded to several Fc/2 fragments bearing different glycans. Glycan species are well resolved, including the G1F isomers, and easily assigned by QTOF-MS after deconvoluting each peak. It should be noted that beyond the major glycan species such as G0F, G1F, and G2F some minor afucosylated species were also well resolved and identified, such as G0, G1, and M5. The chromatographic profile is highly similar to the ones obtained at the glycan and peptide levels, yet with a lower resolution given the size of the analyzed molecules.


The glycan profiling performed at the subunit level by HILIC–MS was also envisaged for evaluating the quality of biosimilar products, and particularly for the comparison of the glycosylation patterns between originator and biosimilar candidates. In reference 31, a set of IdeS digested and reduced mAbs (Herceptin, Remicade, and Erbitux) were analyzed by HILIC–MS and their glycan patterns, profiled at the protein level, were compared with those of their corresponding biosimilar candidates or already marketed biosimilars (Remsina and Inflectra) (31). These results confirmed the ability of HILIC to resolve hydrophilic variants of mAb subunits and the potential of the approach as a powerful analytical tool for the comparison of originator and biosimilar candidate mAbs.
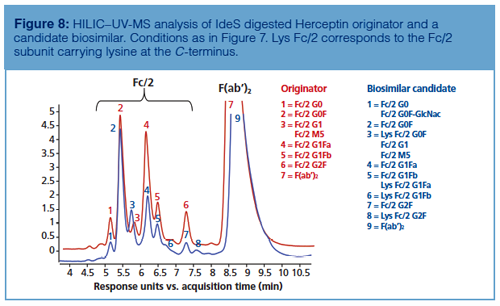
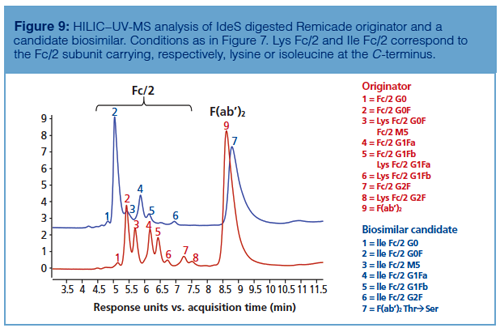
As shown in Figure 8, HILIC–UV-MS analysis performed at the subunit level also enables the detection of secondary antibody microvariants such as C-terminal lysine clipping. In fact, thanks to the accurate mass profiles obtained during the comparison between the glycan profiles of IdeS digested Herceptin and an IdeS digested biosimilar candidate, it was possible to assess the differences in glycan profile along with variations in amino acid sequence within a unique analysis. Similarly, Figure 9 shows that missense mutations might also be identified by HILIC–UV-MS analysis during originator and biosimilar candidate comparison. In the reported example, the glycosylation pattern of Remicade obtained by HILIC–UV-MS upon IdeS digestion of the mAb was compared to a biosimilar candidate and the shifts in retention were related to both conservative (ThrƒSer in F[ab’]2) and non-conservative (LysƒIle at C-terminus of Fc/2) missense mutations.


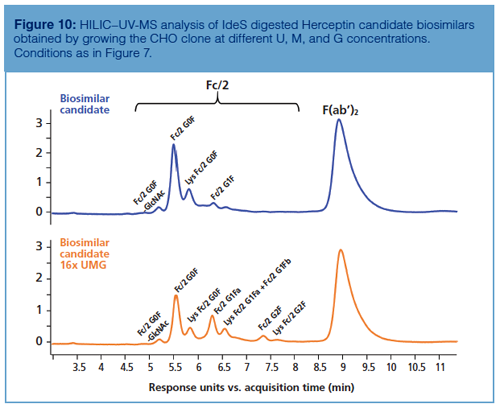
HILIC–UV-MS at subunit level can also be used to measure glycosylation during process optimization. As described earlier, galactosylation levels can be tuned by enriching the cell culture medium with the constituents involved in the intracellular galactosylation process, namely U, M, and G (21). Figure 10 shows how HILIC–UV-MS performed at the subunit level can be used as a fast tool for comparing the chromatographic profiles of mAbs before and after UMG enrichment, while performing a fine-tuning of the glycosylation pattern.


In summary, new innovative applications based on subunit level analysis performed by HILIC–UV-MS can involve (i) glycan characterization, (ii) originator–biosimilar comparison (and more generally batch-to-batch comparison), and (iii) process evaluation.
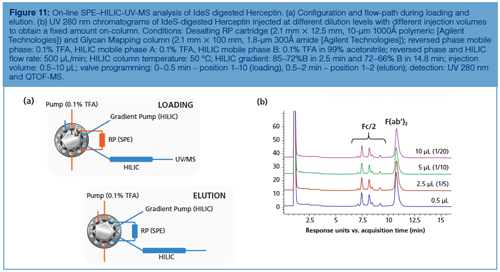
Interesting future steps can be envisaged to circumvent the injection issue in HILIC using an alternative strategy. In this context, Figure 11 shows an excellent correlation among the HILIC chromatographic profiles of IdeS digested Herceptin obtained for the same injected amount and different injection volumes of up to 10 µL, without peak distortion. These results were obtained by implementing on-line solid-phase extraction (SPE). Proteins were first loaded and focused onto a short reversed-phase SPE cartridge under aqueous conditions. After loading, the SPE cartridge and HILIC column are placed in-line and the high acetonitrile containing mobile phase at the beginning of the HILIC gradient elutes the mAb sample from the SPE cartridge onto the HILIC column where separation occurs according to mAb hydrophilicity under HILIC conditions (decreasing organic mobile phase composition). By using this approach, different volumetric loadings of aqueous sample can be injected without affecting the performance of the HILIC chromatographic profiles.


Conclusion
HILIC is a promising chromatographic strategy for the characterization of mAb glycosylation at various levels of analysis, including released glycan, peptide, and protein levels.
HILIC has been widely used for the characterization of enzymatically released and fluorescently labelled N-glycans and is today considered the reference method. Thanks to the recent introduction of modern HILIC column formats (columns packed with sub-2-µm fully porous particles or sub-3-µm superficially porous particles), some significant improvements have been made in terms of throughput and resolving power.
HILIC–MS can also be considered as a complementary strategy to reversed-phase LC–MS for the profiling of glycopeptides, and will certainly be more widely applied in a two-dimensional (2D) setup to deeply characterize tryptic digests of mAbs in the coming years.
As a result of the recent commercialization of widepore columns packed with sub-2-µm particles, HILIC can also be used to directly characterize glycans at the protein (or subunits) level, without the need for long and tedious sample preparation procedures. This strategy has been successfully employed to compare originator and biosimilar mAb products, to evaluate batch-to-batch consistency and in process optimization.
Finally, new and innovative strategies for sample injection, for example, incorporating on-line SPE, opens up new perspectives for the HILIC analysis of highly diluted protein samples.
Acknowledgements
The authors acknowledge Maureen Joseph (Agilent Technologies, Wilmington, USA), Lucie Jorge, Mieke Steenbeke, and Jonathan Vandenbussche (RIC, Kortrijk, Belgium). Davy Guillarme wishes to thank the Swiss National Science Foundation for support through a fellowship (Grant 31003A_159494).
References
- G. Walsh, Nat. Biotechnol. 32, 992–1000 (2014).
- R. Aggarwal, Nat. Biotechnol.32, 32−39 (2014).
- H.H. Cai, MOJ Immunol.5(1), 00145 (2017). DOI: 10.15406/moji.2017.05.00145.
- S. Fekete, A.L. Gassner, S. Rudaz, J. Schappler, and D. Guillarme, Trends Analyt. Chem.42, 74–83 (2013).
- L. Zhang, S. Luo, and B. Zhang, MAbs 8, 205–215 (2016).
- D. Reusch and M.L. Tejada, Glycobiology25, 1325–1334 (2015).
- K. Sandra, I. Vandenheede, and P. Sandra, J. Chromatogr. A1335, 81–103 (2014).
- A. Beck, E. Wagner-Rousset, D. Ayoub, A. Van Dorsselaer, and S. Sanglier-Cianférani, Anal. Chem. 85, 715–736 (2013).
- S. Fekete, D. Guillarme, P. Sandra, and K. Sandra, Anal. Chem.88, 480–507 (2016).
- S. Fekete and D. Guillarme, Trends Analyt. Chem.63, 76–84 (2014).
- A.J. Alpert, J. Chromatogr.499, 177–196 (1990).
- B. Buszewski and S. Noga, Anal. Bioanal. Chem. 402, 231–247 (2012).
- P Hemström and K. Irgum, J. Sep. Sci.29, 1784–1821 (2006).
- D.V. McCalley, J. Chromatogr. A (2017). DOI: 10.1016/j.chroma.2017.06.026.
- A. Periat, I.S. Krull, and D. Guillarme, J. Sep. Sci.38, 357–367 (2015).
- J. Ruta, S. Rudaz, D.V. McCalley, J.L. Veuthey, and D. Guillarme, J. Chromatogr. A1217, 8230–8240 (2010).
- A. Periat, J. Boccard, J.L. Veuthey, S. Rudaz, and D. Guillarme, J. Chromatogr. A1312, 49–57 (2013).
- A. Periat, I. Kohler, A. Bugey, S. Bieri, F. Versace, C. Staub, and D. Guillarme, J. Chromatogr. A1356, 211–220 (2014).
- G.R. Guile, P.M. Rudd, D.R. Wing, S.B. Prime, and R.A. Dwek, Anal. Biochem. 240, 210–226 (1996).
- J. Ahn, J. Bones, Y.Q. Yu, P.M. Rudd, and M. Gilar, J. Chromatogr. B 878, 403–408 (2010).
- M.J. Gramer, J.J Eckblad, R. Donahue, J. Brown, C. Schultz, K. Vickerman, P. Priem, E.T. van den Bremern J. Gerritsen, and P.H. van Berkel, Biotechnol. Bioeng.108, 1591–1602 (2011).
- M.P. Campbell, L. Royle, C.M. Radcliffe, R.A. Dwek, and P.M. Rudd, Bioinformatics 24, 1214–1216 (2008).
- R.P. Kozak, C.B. Tortosa, D.L. Fernandes, and D.I. Spencer, Anal. Biochem. 486, 38–40 (2015).
- M.A. Lauber, Y.Q. Yu, D.W. Brousmiche, Z. Hua, S.M. Koza, P. Magnelli, E. Guthrie, C.H. Taron, and K.J. Fountain, Anal. Chem.87, 5401–5409 (2015).
- M. Gilar, Y.Q. Yu, J. Ahn, H. Xie, H. Han, W. Ying, and X. Qian, Anal. Biochem.417(1), 80–88 (2011).
- K. Sandra, I. Vandenheede, and P. Sandra, LCGC Europe28(s10), 16–23 (2015).
- K. Sandra, G. Vanhoenacker, I. Vandenheede, M. Steenbeke, M. Joseph, and P. Sandra, J. Chromatogr. B1032, 119–130 (2016).
- A. Periat, S. Fekete, A. Cusumano, J.L. Veuthey, A. Beck, M. Lauber, and D. Guillarme, J. Chromatogr. A1448, 81–92 (2016).
- W. Naidong, W.Z. Shou, T. Adison, S. Maleki, and X. Jiang, Rapid Commun. Mass Spectrom.16, 1965–1975 (2002).
- B. Bobaly, V. D’Atri, A. Goyon, O. Colas, A. Beck, S. Fekete, and D. Guillarme, J. Chromatogr. B1060, 325–335 (2017).
- V. D’Atri, S. Fekete, A. Beck, M. Lauber, and D. Guillarme, Anal. Chem.89, 2086–2092 (2017).
Valentina D’Atri is a Postdoctoral Researcher at the School of Pharmaceutical Sciences, University of Geneva, Switzerland.
Emmie Dumont is an LC–MS Specialist at the Research Institute for Chromatograhy (RIC, Kortrijk, Belgium).
Isabel Vandenheede is a Protein Analyst at RIC.
Davy Guillarme is Senior Lecturer at the School of Pharmaceutical Sciences, University of Geneva.
Pat Sandra is Chairman at RIC, Scientific Advisor at anaRIC biologics (Evergem, Belgium), and Emeritus Professor at Ghent University (Ghent, Belgium).
Koen Sandra is Scientific Director at RIC and R&D Director at anaRIC biologics.


LC–MS/MS-Based System Used to Profile Ceramide Reactions to Diseases
April 26th 2024Scientists from the University of Córdoba in Córdoba, Spain recently used liquid chromatography–tandem mass spectrometry (LC–MS/MS) to comprehensively profile human ceramides to determine their reactions to diseases.


The 26th Norwegian Symposium on Chromatography
March 29th 2024The 26th Norwegian Symposium on Chromatography was held 21–23 January 2024. The symposium has strong traditions in the Norwegian separation science community, serving as a forum for excellent scientific talks, networking, and social events.

