Improving Quality Control of Essential Oils With GC×GC–TOF-MS and “Soft” Ionization
The Column
The chemical composition of many essential oils exhibits a degree of natural variation, but even minor changes can adversely affect the quality of the final product. Rigorous quality control procedures are therefore needed to ensure that essential oils do not vary significantly from the initial reference batch, or contain any unwanted adulterants. In this article, we describe the use of comprehensive two-dimensional gas chromatography with time-of-flight mass spectrometry (GC×GC–TOF-MS) at 70 eV and 12 eV for analyzing these complex mixtures. We show that the enhanced separation capacity offered by the coupling of two columns of different selectivity, combined with highly sensitive mass spectral identification, enables the rapid and effective screening of essential oils.


(Photo Credit:Thomas Northcut/Getty Images)

Essential oils, due to their desirable aromatic qualities, are used as raw materials in the production of a wide range of cosmetic products, including fragrances and personal care products. The chemical composition of many essential oils exhibits a degree of natural variation, but even minor changes can adversely affect the quality of the final product. Rigorous quality control procedures are therefore needed to ensure that essential oils do not vary significantly from the initial reference batch, or contain any unwanted adulterants.
Comprehensive two-dimensional gas chromatography with time-of-flight mass spectrometry (GC×GC–TOF-MS) is an ideal method for screening such complex mixtures. The enhanced separation capacity offered by the coupling of two columns of different selectivity, combined with the highly sensitive mass spectral identification, provides a highâperformance solution for rapid screening of essential oils.
However, despite the superior separation afforded by GC×GC, the identification of individual compounds in complex samples can remain challenging when compounds have weak molecular ions or similar spectra when using conventional (70 eV) ionization.
A solution to this problem is to run the analysis at a lower (“softer”) ionization energy to reduce the degree of analyte fragmentation and provide more information about the larger, more structurally significant fragments. However, GC-amenable compounds are typically analyzed using electron ionization, which gives poor results at energies below the conventional 70 eV because of a dramatic loss of signal.
The main soft ionization alternative - chemical ionization (CI) - generally requires a different ion-source configuration, with additional source pressurization and the use of reagent gases. If a single instrument is being used, this can be a time-consuming transition and a considerable drain on laboratory resources if required on a regular basis.
A solution to these problems has recently presented itself in the form of an e-gun design that allows the ionization energy to be varied on a sliding scale from conventional 70 eV to lower energies, without compromising on sensitivity.1 The physical properties of most small molecules means that relatively small differences in ionization energies between 10 and 20 eV can have significant differences in fragmentation pattern. Typically, however, an ionization energy of about 12 eV retains a useful degree of fragmentation while avoiding loss in sensitivity relating to the unavoidable dropâoff in ionization efficiency as the ionization potential is approached.
This technique has already been applied to studies of samples containing analytes that are challenging to differentiate with conventional 70 eV ionization - including hydrocarbons2 and certain groups of environmental contaminants.3 This article demonstrates the use of soft electron ionization at 12 eV to address these issues for essential oils, in which sequiterpenes can be particularly difficult to identify at 70 eV.
Experimental
Sample preparation: A sample of essential oil was diluted 200:1 in ethyl acetate prior to analysis. GC: Injector: split/splitless; liner: single taper, deactivated, 4 mm (i.d.); carrier gas: helium, constant flow at 0.8 mL/min; mode: split 200:1; temperature: 250 °C; septum purge: on, 3 mL/min. 2D column set (normal): 1st dimension: 20 m × 0.18 mm, 0.18-μm Rxi-17 column (Restek); 2nd dimension: 1.9 m × 0.15 mm, 0.15-μm VF-5ms column (Agilent Technologies); modulation delay loop: 1.0 m, as for 2nd dimension. Temperature programme (normal): main oven: 50 °C (2 min), 5 °C/min to 320 °C (12 min); secondary oven: 65 °C (2 min), 5 °C/min to 335 °C (hold time matched to total run time); hot jet: 150 °C (2 min), 5 °C/min to 400 °C (hold time matched to total run time); modulation period: 4 s, hot-jet pulse 350 ms; total run time: 68 min. 2D column set (inverse): 1st dimension: 30 m × 0.32 mm, 0.25-μm DB5 (Agilent Technologies); 2nd dimension: 1.25 m × 0.10 mm, 0.10-μm BPX50 (SGE Analytical Science); modulation delay loop: 1.5 m × 0.10 mm fused silica. Temperature programme (inverse): main oven: 50 °C (2 min), 5 °C/min to 310 °C (12 min); secondary oven: no offset; hot jet: 150 °C (2 min), 5 °C/min to 400 °C (hold time matched to total run time); modulation period: 6 s, hot-jet pulse 350 ms; total run time: 66 min. TOFâMS: instrument: BenchTOF-Select (Markes International); filament voltage: 1.8 V; ion source: 280 °C; transfer line: 300 °C; mass range: m/z 40–500; data rate: 50 Hz (200 spectral accumulations per data point). Software: Image processing: GC Image (GC Image, LLC).
Results and Discussion
An initial investigation showed that considerably better spatial separation was achieved with an inverse (polar–nonâpolar) column set than with a conventional (nonâpolar–polar) setup (Figure 1).

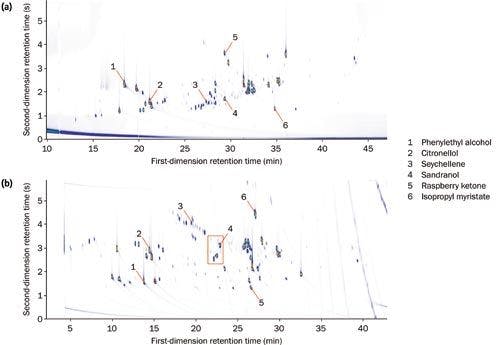
Figure 1: Colour plots for the diluted essential oil using both (a) normal and (b) inverse column sets, with a selection of compounds highlighted to show relative elution order. The red box indicates the region expanded in Figure 2. [Click image to enlarge].
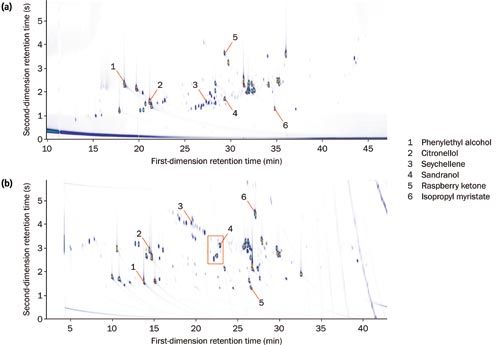
The chromatographic space occupation within a GC×GC contour plot can be calculated using a simple equation described by Omais et al.4 It was found that the normal-phase column set used 83% of the available chromatographic space, while the inverse column set gave an improvement in orthogonality, using 92% of the total space. This enhanced peak capacity enabled more confident characterization of the full chemical composition, which is required in the strict quality control of raw materials used in the production of fragrances.
With regard to the spectral quality, very good match factors (over 850) were obtained for 104 of the 119 compounds, across a range of chemical classes. This shows that GC×GC–TOFâMS is a powerful tool for confident chemical fingerprinting of complex samples that have not been subjected to extensive sample preparation.
The degree of sensitivity and spectral quality resulting from TOF-MS ensures both high loading and trace analytes can be confidently identified (Figure 2). Figure 3 illustrates the high degree of similarity between acquired and NIST 14 reference spectra for these compounds. In particular, note for nerolidol the highâquality matching of the m/z 189/190 and m/z 204/206 signals, which TOF-MS would normally struggle to detect.

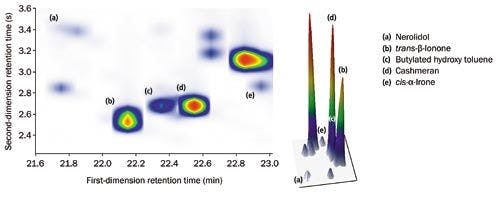
Figure 2: Colour plot (top) with 3D rendering (bottom), illustrating the high degree of separation and symmetrical peak shape for both high- and low-loading components. [Click image to enlarge].
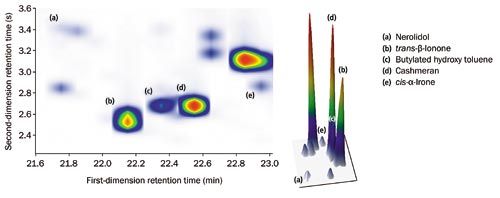

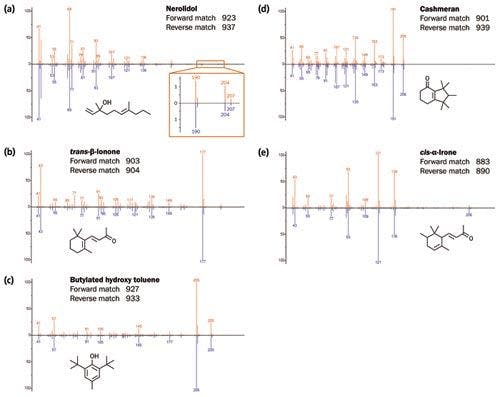
Figure 3: Comparison of the spectra for compounds a–e (top, red) with the NIST 14 library spectra (bottom, blue). [Click image to enlarge].

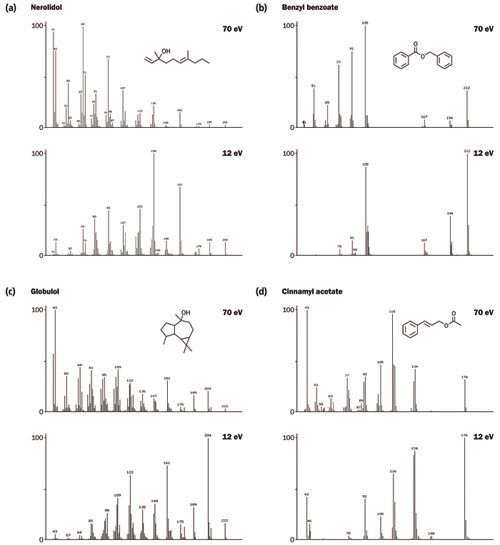
The essential oil sample was also analyzed using “soft” electron ionization energy at 12 eV - a selection of spectral comparisons are provided in Figure 4. Soft ionization at this energy was found to give both increased intensity for the molecular ion and reduced fragmentation, resulting in simplified, more selective spectra. The intensity improvement for the important “diagnostic” ions provides enhanced detection limits and increased confidence in the identification of ultraâtrace components. Moreover, unlike other soft ionization techniques, a degree of fragmentation is retained, which aids structural elucidation by highlighting minor differences in structure between similar isomers.

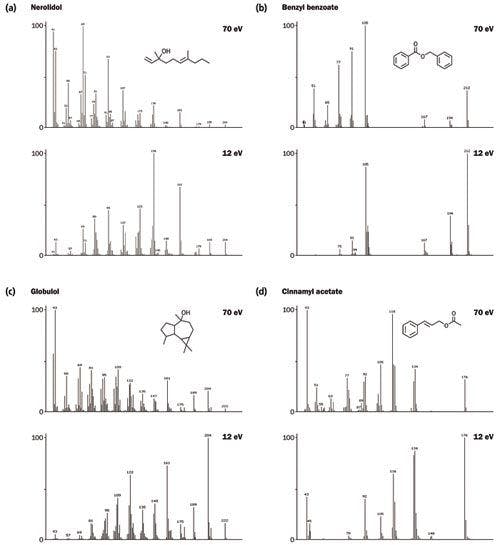
Figure 4: Spectral comparisons between 70 eV and 12 eV for a selection of compounds from the essential oil. [Click image to enlarge].
Conclusions
In this article, we have shown that GC×GC–TOF-MS can be successfully applied to the analysis of complex essential oils. Excellent compound separation was achieved, with NISTâquality spectra obtained for both high- and low-concentration components. This combination ensures that both confident identification and accurate quantitation are achieved for complex mixtures - a fact that is particularly important for quality control within the fragrance industry. The use of soft ionization delivers an extra level of information on sample composition, by providing enhanced confidence for the identification of challenging analytes, as well as improved sensitivity for lower detection limits.
References
- L. McGregor, N. Bukowski, and D. Barden, LCGC Supplement: Current Trends in Mass Spectrometry 16–19 (2014).
- L. McGregor and D. Barden, Analyzing crude oil: Improving compound speciation, Hydrocarbon Engineering, July 2014, http://www.energyglobal.com/downstream/gas-processing/31072014/Crude-oil-markes-analysis/
- L. McGregor, A. Gravell, I. Allan, G. Mills, D. Barden, N. Bukowski, and S. Smith, The Analytical Scientist April 2015.
- B. Omais, M. Courtiade, N. Charon, D. Thiébaut, A. Quignard, and M.-C. Hennion, Journal of Chromatography A1218, 3233–3240 (2011).
Laura McGregor received an M.Chem. in chemistry from the University of St Andrews, UK, followed by an M.Sc. in forensic science at the University of Strathclyde, UK. Her Ph.D. in environmental forensics, also at the University of Strathclyde, focused on the chemical fingerprinting of environmental contamination using advanced techniques such as GC×GC–TOF-MS. Laura joined Markes International in 2013 as a sales support specialist, and is now product marketing manager for Markes’ TOFâMS product portfolio.
Steve Smith studied in Bristol, UK, for both his B.Sc. and Ph.D., which he obtained in 2008 on innovative work profiling volatile organic compounds for disease diagnosis. Following post-doctoral positions at the University of the West of England and Bristol University, Steve joined Markes International as a senior applications specialist for thermal desorption and TOF-MS in 2011, where he now specializes in GC×GC–TOF-MS.
David Barden is a technical copywriter at Markes International, having joined the company in 2011. David studied natural sciences at the University of Cambridge, UK, and remained there for his Ph.D. in organic chemistry, which he received in 2003. A placement at the European Journals Department of Wiley-VCH, Weinheim, Germany, was then followed by seven years in journal publishing at the Royal Society of Chemistry, UK.
Email: enquiries@markes.com
Website: www.markes.com


New Procedures Enhance Quality Control for Large-Scale Plasma Proteomics Analyses
May 24th 2023A recent study has introduced comprehensive quality control procedures for large-scale plasma proteomics analyses. The research provides valuable insights into optimizing performance, enhancing reproducibility, and ensuring quantitative accuracy in proteomics investigations.

