LC–MS-Compatible Separation of Polar Compounds Using Silica Hydride Columns
LCGC North America
A guide to using HPLC in an iterative form to clarify decision-making during method development
Getting the most out of silica hydride columns requires knowledge of how to use them to fully exploit their unique and desirable chromatographic benefits. Examples of such benefits include extremely fast equilibration even between gradient runs, very precise retention for hydrophilic or hydrophobic analytes, and an increased range of solvent compatibility. This article discusses how to successfully use this high performance liquid chromatography approach during method development in an iterative form to clarify decision making processes along the way that are unique to silica hydride and aqueous normal phase retention.
Silica hydride is a type of stationary phase material used in a unique class of high performance liquid chromatography (HPLC) columns. Structurally, the material consists of high purity silica but uses a proprietary manufacturing process to produce a surface containing >95% fewer surface silanols than conventional silica (1). The surface of this material is slightly hydrophobic which can be functionalized if desired with various organic moieties such as cholesterol, phenyl, C8, C18, or very small carbon chains. Stationary phases made from this material are currently marketed as Type-C silica. In addition to ordinary reversed-phase or normal-phase chromatography, these stationary phases can successfully operate in aqueous normal phase (ANP) mode. ANP mode is often used for hydrophilic or polar compounds but differs from hydrophilic interaction liquid chromatography (HILIC), which is sometimes used for retention of these compounds, in that a water-rich environment is not present on the silica hydride stationary phase surface. Because this water layer is believed to play a key role in HILIC retention via analyte partitioning, the mechanism responsible for ANP retention is significantly different and requires different decisions during method development.
The nature of the adsorbed water layer in HILIC methods is thought to contribute to a lack of robustness in many instances of gradient usage. As such, HILIC columns may require lengthy equilibration (2) that consumes both time and solvents. Because the silica hydride surface is slightly hydrophobic, it will adsorb and desorb the mobile phase differently and more quickly. This leads to both faster equilibration and higher precision even when gradients are used. For this reason and others, silica hydride columns are often chosen for analyses of hydrophilic compounds via ANP chromatography.
The analysis of hydrophilic compounds has presented many challenges to chromatographers. Reversed-phase chromatography was commonly used for these applications because of the high solubility of hydrophilic compounds in aqueous-based solvents (3). However, reversed-phase chromatography is poorly suited to the retention of these types of compounds. To obtain adequate retention and selectivity, ion-pair reagents are often added to the mobile phase. In this mode, the ion-pair reagent contributes to analyte retention either by neutralizing an opposite charge on the analyte in the bulk eluent or interacting with the analyte while adsorbed onto the stationary phase surface (4). There are numerous examples of ion-pair reversed-phase chromatography successfully used in an analysis of hydrophilic compounds (5,6). The approach works for UV-based analyses, but the ion pair agents used are not compatible with liquid chromatography–mass spectrometry (LC–MS) and are known for other nondesirable issues. Furthermore, very high water content in the mobile phase is often required for retention, which is less preferable in an LC–MS method. Because retention in the ANP mode is based on an analyte's polarity, ion pair agents are not necessary to obtain retention of these types of compounds.


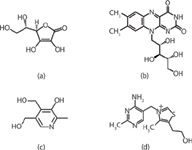
Figure 1: Structures of (a) ascorbic acid, (b) riboflavin, (c) pyridoxine, and (d) thiamine.
To demonstrate how an analyst may proceed in developing methods for hydrophilic compounds using silica hydride stationary phases, the separation of the four test solutes (ascorbic acid, pyridoxine, riboflavin, and thiamine) shown in Figure 1 was investigated for the purposes of this article. The polar/ionizable functional groups of these analytes are sufficiently diverse to be representative of other types of hydrophilic compounds that may be encountered during method development or untargeted analysis methods.
Three main goals were set for final methods for the purposes of this article. The first goal was the method could only use LC–MS compatible conditions. The second goal was to keep the analyte retention in a suitable range; methods in which retention is too low often suffer from inadequate separation of peaks while excessive retention lengthens analysis time and wastes solvents. The third goal was that the critical peak pair should be baseline-resolved. A resolution of no less than 1.5 is generally used for baseline separation (7) and therefore was the criterion we chose.
Experimental
Chemicals: Ascorbic acid, riboflavin, pyridoxine, and thiamine reference standards were obtained from the United States Pharmacopeia. Ammonium acetate was obtained from Fisher Scientific. HPLC-grade formic acid and acetonitrile were from EMD. Deionized water (DI H2O) was prepared on a Milli-Q purification system from Millipore.
Chromatographic Conditions: For HPLC–UV studies, a Hewlett–Packard 1100 HPLC system consisting of an autosampler, degasser, binary pump, and variable wavelength UV detector set at 266 nm was used. The system was interfaced with Agilent Chemstation software. The flow rate was 1.0 mL/min for all method steps. The injection volume was 1.0 µL in each method step. The mobile phase solvents used for steps 1–6 are given in Table I. The gradient programs used in steps 1–6 are given in Table II. For step 1, a 75 mm × 4.6 mm analytical column was packed with Bidentate C18 stationary phase with a particle diameter of 4 µm and a pore size of 100 Å (MicroSolv Technology Corporation). For steps 2–6, a 75 mm × 4.6 mm analytical column was packed with Diamond Hydride (low carbon-bonded silica hydride column) stationary phase with a particle diameter of 4 µm and a pore size of 100 Å (MicroSolv Technology Corporation).


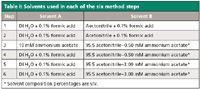
Table I: Solvents used in each of the six method steps
For the LC–MS method, the HPLC system was an Agilent 1100 Series LC system, including a degasser, binary pump, temperature-controlled autosampler, and temperature-controlled column compartment. The mass spectrometer was an Agilent Model 6210 MSD TOF with a dual sprayer electrospray ionization (ESI) source. The method consisted of an injection volume of 1.0 µL, a flow rate of 1.0 mL/min, a Diamond Hydride column of the same specifications as in HPLC–UV, and step 6 mobile phase and gradient conditions (see Tables I and II).


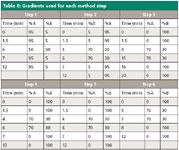
Table II: Gradients used for each method step
Standard Preparations: 1000 mg/L stock solutions of ascorbic acid, pyridoxine, riboflavin, and thiamine were prepared. The diluents used were 50:50:0.1 (v/v) acetonitrile–deionized water–formic acid for steps 1–2 and 50:50 acetonitrile–5 mM ammonium acetate for steps 3–6. These stock solutions were diluted to final concentrations in the range 10–300 mg/L for each of the analytes. For LC–MS, a mixture of all four analytes was prepared as well.
Results and Discussion
There are a number of ways to develop a chromatographic separation of a given set of compounds. One way is to graph properties such as retention or resolution as a function of a systematically controlled variable like mobile-phase pH. A resulting trend may then show an optimal value for that parameter. It is suggested that this method should be avoided for two reasons. First, it is an ad hoc investigation; in this approach, no hypothesis is proposed and tested. Only after a trend is observed is it apparent what the analyst was looking for. No understanding of chromatographic theory is used to arrive at the optimum value, but rather only a series of trial-and-error experiments. Second, the large number of runs required to generate these plots uses unnecessary time and solvents.
In contrast, the method development process described in this study is an iterative process. Based on what is known about how different variables affect retention in reversed-phase or ANP chromatography, the optimal conditions are predicted beforehand. After the data is generated, the analyst compares the results to the predictions made in the hypothesis. As with most scientific experiments, the amount of agreement between the obtained and predicted results leads to a second, more refined hypothesis from which to construct additional experiments. This process not only quickly leads to the desired results for the separation under study, but also to a more complete understanding of the chromatographic retention mechanism at work.
Reversed-phase chromatography was investigated first because of its widespread use in HPLC methodology. Because the retention is based on hydrophobicity and the analytes are very polar, it was predicted that very high water content would be required despite the known pitfalls of this combination. Thus, a 95% aqueous starting condition was selected for the gradient. A C18 stationary phase was chosen because of its strong hydrophobic character. A gradient ramp to 50% aqueous was sufficient to elute the hydrophilic analytes. For the mobile phase additive, 0.1% formic acid was chosen to keep ascorbic acid neutral and therefore more amenable to reversed phase retention. The data using the step 1 gradient with the Bidentate C18 column is shown in Figure 2.


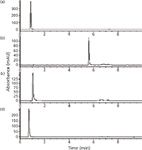
Figure 2: Individual standard injections using step 1 with the Bidentate C18 column. Standard injections are a) ascorbic acid, b) riboflavin, c) pyridoxine, and d) thiamine.
Riboflavin was well retained but ascorbic acid, pyridoxine, and thiamine all exhibited minimal retention even at 95% aqueous content in the mobile phase. The lack of retention for these compounds under highly aqueous conditions suggested that further attempts in reversed phase were not likely to be successful. Higher retention could possibly be accomplished with the use of ion pair agents such as alkyl sulfonates. However, this would make the method incompatible with MS detection. This data is what prompted investigations in the ANP mode. The analytes could then be retained based on their polarity, thereby achieving our method goals.
Using the low carbon-bonded silica hydride column, a 0.1% (v/v) formic acid mobile-phase additive was investigated. Because thiamine has a permanent positive charge, it is expected to be highly susceptible to undesirable electrostatic interactions with the very few residual silanol moieties remaining on the stationary phase surface. Operating under acidic conditions neutralizes these residual silanol groups (8). Therefore, it was predicted that an acidic mobile phase would be required to avoid these detrimental effects. A disadvantage of this mobile phase is that ascorbic acid will be neutral and therefore less hydrophilic under these conditions; thus, a lower retention time would be expected than with use of an additive such as ammonium formate or ammonium acetate.


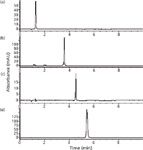
Figure 3: Individual standard injections using step 2 with the Diamond Hydride column. Standard injections are (a) ascorbic acid, (b) riboflavin, (c) pyridoxine, and (d) thiamine.
The ANP gradient separation using 0.1% formic acid (step 2) for individual standards is displayed in Figure 3. The data is a vast improvement compared to the reversed-phase approach in terms of both retention and selectivity. However, ascorbic acid shows low retention even with 95% starting organic content in the mobile phase. Therefore, the method should be modified in a manner that leads to stronger ascorbic acid retention. Because the mobile-phase composition already starts out with low solvent strength conditions, optimization of the gradient is not warranted at this stage. A better approach would be to operate at a mobile-phase pH in which ascorbic acid is fully ionized to increase its hydrophilicity. The pH of the mobile phase should be at least 1 pH unit above the pKa of ascorbic acid to ensure that it is fully ionized as ascorbate.
Ammonium acetate was chosen as the mobile-phase additive to investigate the effect of ascorbic acid ionization on its retention. The mobile phase will be at a near neutral pH with this additive so it was deemed suitable for this purpose. Also, ammonium acetate is an LC–MS-compatible mobile-phase additive and is therefore within the scope of the method goals. Data for the ANP method step using ammonium acetate in the A and B solvents (step 3) is shown in Figure 4. As the ANP retention mechanism predicts, ascorbic acid shows far better retention than with 0.1% formic acid as the mobile phase additive. The selectivity between ascorbic acid, riboflavin, and pyridoxine could be improved by further modification of the gradient. However, the primary issue with the data from this step is the thiamine retention and peak shape. Even with a lengthy hold time at strong eluting ANP conditions (70% solvent A), the compound still retains excessively and displays a very broad tailing peak. This is likely caused by undesirable electrostatic interactions with residual surface silanols, which contribute to thiamine retention. These silanols are anionic at this mobile-phase pH and therefore have a greater affinity for interaction with the cationic thiamine. This secondary retention mechanism results in both increased retention and decreased efficiency.


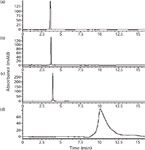
Figure 4: Individual standard injections using step 3 with the Diamond Hydride column. Standard injections are (a) ascorbic acid, (b) riboflavin, (c) pyridoxine, and (d) thiamine.
The two mobile-phase pH conditions both have advantages. The formic acid method elutes thiamine in a reasonable time frame and with good efficiency, and the ammonium acetate method exhibits good ascorbic acid retention. The data then suggest that a combination of the two approaches could provide the benefits of both methods while avoiding the drawbacks. The gradient should start out at a moderate pH to retain ascorbic acid, but would need to increase in acidity as well as water content to avoid the detrimental effects observed with thiamine using only ammonium acetate. For this reason, step 4 was devised which has formic acid in the A solvent and ammonium acetate in the B solvent. The data using this approach are shown in Figure 5. Here, the retention for ascorbic acid is improved while the thiamine peak is eluted readily and with good efficiency. Still, ascorbic acid retention is not as high as would be expected, considering its stronger retention from step 3.

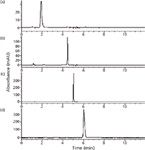
Figure 5: Individual standard injections using step 4 with the Diamond Hydride column. Standard injections are (a) ascorbic acid, (b) riboflavin, (c) pyridoxine, and (d) thiamine.
A possible reason for the lower ascorbic acid retention is that the buffer capacity or ionic strength in the B solvent is not sufficient. Therefore step 5 was investigated in which the concentration of ammonium acetate in the B solvent was increased sixfold. The A solvent used was the same as in step 4. The results from this further refined method are shown in Figure 6. Under these new conditions, the pH gradient now behaves as originally predicted. Ascorbic acid shows excellent retention and thiamine is not retained excessively. The method combines the best features of both mobile-phase pH conditions. The only obstacle left is to obtain adequate separation between ascorbic acid and riboflavin.

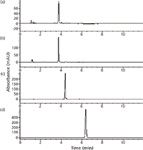
Figure 6: Individual standard injections using step 5 with the Diamond Hydride column. Standard injections are (a) ascorbic acid, (b) riboflavin, (c) pyridoxine, and (d) thiamine.
Selectivity issues such as this can often be solved with a simple change in the mobile-phase gradient program. It is best to address inadequate or excessive retention and peak shape issues first before optimizing the gradient. A more gradual gradient should provide additional selectivity between ascorbic acid and riboflavin, resulting in acceptable resolution between the two peaks. Step 6 features the same mobile-phase solvents as step 5, but now uses a more gradual gradient slope. The data for this method are shown in Figure 7. This method now addresses all the goals that were set for the analysis. The retention range of the analytes is within a suitable range and the critical peak pair is baseline-resolved.


Figure 7: Individual standard injections using step 6 with the Diamond Hydride column. Standard injections are (a) ascorbic acid, (b) riboflavin, (c) pyridoxine, and (d) thiamine.
To summarize the process of this method development strategy, Figure 8 shows a comparison of the retention times for each analyte using the six method steps that were discussed. At each step, the data is more refined and more adequately approaches the method goals:
- Step 1: Low retention for most analytes. Different retention mode needed.
- Step 2: No retention for one analyte. Suggested use of a different mobile-phase additive.
- Step 3: Excessive retention for one analyte with a broad peak shape. Suggested a combination of the two additives would allow for a total separation.
- Step 4: Good retention for three of four analytes. Lower retention than expected, suggested insufficient buffering capacity/ionic strength.
- Step 5: All analytes retained well. Co-elution of two analytes.
- Step 6: All analytes well retained and well resolved.


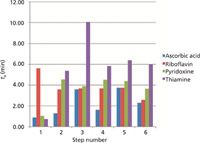
Figure 8: Retention times obtained for each of the four analytes with each of the six method steps (see Tables I and II for method conditions).
After the final method had been devised, transfer of the HPLC–UV-based methodology to LC–MS was investigated. A mixture of the four test solutes was prepared and injected using step 6 method conditions with an LC–MS system and the low carbon-bonded silica hydride column. Figure 9 shows the extracted ion chromatograms (EICs) obtained from the injection. Three of the ions are present as [M + H]+ , but thiamine is observed as [M – 2Cl – H]+ (9). This data demonstrates how the method that was developed with HPLC–UV can be successfully transferred to an LC–MS system.


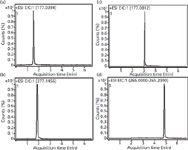
Figure 9: LCâMS extracted ion chromatograms (EICs) from a mixture of the four test solutes using step 6 method conditions with the Diamond Hydride column. EICs are (a) ascorbic acid (177.0394 m/z [M + H]+), (b) riboflavin (377.1456 m/z [M + H]+), (c) pyridoxine (170.0812 m/z [M + H]+), and (d) thiamine (265 m/z [M â 2Cl â H]+).
Because HILIC methods are sometimes reported to be prone to a lack of precision or robustness, it was important to study whether the ANP method that was developed shares similar disadvantages. For example, ANP theory predicts that retention time precision should be excellent because a large and variable water layer is not involved in the retention mechanism. In addition, robustness studies can provide insight into which variables affect the chromatography most significantly.
To study the method's intermediate precision, intra- and interday repeatability studies were conducted. Injections of the mixture were made five times a day over the course of three different days. Percent relative standard deviation (%RSD) of analyte retention times for both intra- and interday repeatability are shown in Table III. The low %RSD values obtained in each case illustrate how ANP retention is capable of producing reliable and consistent results.


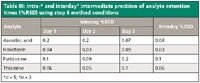
Table III: Intra-* and interdayâ intermediate precision of analyte retention times (%RSD) using step 6 method conditions
To investigate the robustness of the method, slight but deliberate changes were made to several parameters of step 6 method conditions. The investigated parameters are given in Table IV. Using the altered methods, the retention times of each analyte were then compared to the original method values obtained on the same day. The results of the robustness study are shown in Figure 10. The relative significance of each method parameter confirms what was discovered during method development. Ascorbic acid and thiamine show the most deviation of the four analytes because of pH changes in Figure 10, as was observed in data from steps 2 and 3. The pH gradient explains the higher deviation for the hold time %B and flow rate as well. Also, the directions of the trends are consistent with what was observed in method development. For example, ascorbic acid and thiamine retention increased with increasing mobile-phase pH.


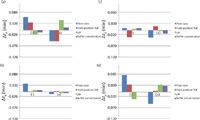
Figure 10: Differences in retention times ÎtR obtained from original step 6 method parameter values and the low (-) and high (+) adjusted values given in Table IV: (a) ascorbic acid, (b) riboflavin, (c) pyridoxine, and (d) thiamine.
Conclusions
The presented data illustrate how an LC–MS-compatible separation of four hydrophilic test solutes in 12 min can be accomplished using ANP chromatography. Using a quick six-step process, the final method was devised that produced both good separation and symmetrical peak shapes. Before each step, predictions and expectations were made on how the analytes would interact under the method conditions studied based on the appropriate retention model. After each step, the results were scrutinized in terms of their agreement with the model and the predictions made from it. Further predictions using a better understanding of the retention mechanism could then be used to refine the method. The differences observed in the data are consistent with what is known about ANP retention and how the ionization state of both the analytes and the stationary phase can affect it. Keeping these factors in mind for prediction of chromatographic behavior leads to a much more streamlined method development process.


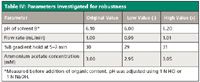
Table IV: Parameters investigated for robustness
References
(1) J.J. Pesek and M.T. Matyska, J. Sep. Sci. 28, 1845–1854 (2005).
(2) T. Ikegami, K. Tomomatsu, H. Takubo, K. Horie, and N. Tanaka, J. Chromatogr. A 1184, 474–503 (2008).
(3) L.F. Russel, in Handbook of Food Analysis: Physical Characterization and Nutrient Analysis (CRC Press, Boca Raton, Florida, 2004), pp. 487–572.
(4) T. Cecchi in Ion-Pair Chromatography and Related Techniques, (CRC Press, Boca Raton, Florida, 2009) pp. 79–90.
(5) D.E. Breithaupt, Food Chem. 74, 521–525 (2001).
(6) T. Grindberg and K. Williams, Concordia College Journal of Analytical Chemistry 1, 19–23 (2010).
(7) N. Parris in Instrumental Liquid Chromatography, 2nd Ed., (Elsevier, Amsterdam, The Netherlands, 1984) p. 15.
(8) R. Cunico, K. Gooding, and T. Wehr, in Basic HPLC and CE of Biomolecules (Bay Bioanalytical Laboratory, Inc. Richmond, California, 1998), p. 148.
(9) Z. Chen, B. Chen, and S. Yao, Anal. Chim. Acta 569, 173 (2006).
Joshua E. Young and Maria T. Matyska are with MicroSolv Technology Corporation in South New Berlin, New York. Hong Nhung Nguyen and Joseph J. Pesek are with the Department of Chemistry at San José State University in San José, California. Direct correspondence to: j.young@mtc-usa.com.