Possibilities and Limitations of Aqueous Temperature Responsive Liquid Chromatography in Comprehensive 2D–LC

In theory, comprehensive two-dimensional liquid chromatography (2D-LC) allows for significant enhanced peak capacity compared to one-dimensional high performance LC (1D-HPLC). However, reaching such a separation performance while also obtaining robust, easily implementable, and sensitive methods proves challenging. Because it can hinder the broader use of 2D-LC, there is a need for developing easier, more trouble-free approaches that feature the benefits of LC×LC while not compromising with what can be done with 1D-HPLC. Commercial 2D-LC interfaces are based on two-position multiport valves composed of two loops, which are alternatingly used either to collect the effluent from the first dimension (1D), or to inject their content to the second dimension (2D). This design implies that if large sampling volumes transferred to the second column need to be avoided, a comparatively (much) higher flow rate and broader column i.d. is required for the second column. However, doing so can lead to a loss in sensitivity because of dilution and impractical analytical chromatography as a result of the high flow rates involved. In most LC×LC column combinations, this problem is exacerbated thanks to the high eluotropic strength of transferred loop volumes. However, when the elution strength of the transferred solvent is very small, refocusing the analytes can be obtained, which allows the user to overcome such issues. For example, this is the case when a purely aqueous separation mode is combined with reversed-phase LC (RPLC) in the 1D and 2D, respectively. Temperature responsive LC (TRLC), which is an emerging LC mode requiring only water as the mobile phase and whereby retention is controlled via temperature only, is promising in this context. In this second installment about TRLC, we illustrate the unique benefits of the combination of this separation mode with RPLC in comprehensive 2D-LC. The potential of the approach is shown through the analysis of representative standard mixtures, active pharmaceutical ingredients, synthetic impurities and phenolics in natural products.
Temperature-responsive liquid chromatography (TRLC) is a separation mode in LC that allows for reversed-phase (RP)-type separations under purely aqueous conditions. As a result, retention is controlled through column temperature (gradients), and the mobile phase is unchanged and composed of only water (1–3). The columns are obtained through anchoring stimuli-responsive polymers, which depict a large variation in solubility in water over a relatively narrow temperature range, to a supporting material packed in high performance LC (HPLC) columns. The current performance and potential of TRLC in one-dimensional (1D) HPLC analyses was described in the previous column (4). In this column, the unique possibilities offered by the purely aqueous TRLC mode in comprehensive two-dimensional LC (2D-LC) are illustrated.
Comprehensive 2D-LC is increasingly used to provide additional resolving power for the separation of complex samples when 1D and heart-cutting approaches do not offer satisfactory answers. The mainstream and currently commercialized 2D-LC systems are based on two-position multiport valves composed of two sampling loops linking two independent LC separation systems. The 2D separations are then generated through the segmented transfer of the effluent of a regular HPLC separation in the first dimension (1D) to an independently operating second dimension column (2D). While a first loop is then used for collecting the 1D effluent, the second is one is positioned inline with 2D, allowing for sample transfer and rapid analysis. Subsequently, the valve position is switched, whereby the function of both loops (sampling or injection) is interchanged. Then, this alternation is repeated multiple times until the 1D analysis concludes. Ideally, 2D-LC should allow for a theoretical peak capacity equal to the product of the peak capacities of both modes. Although this statement is good in theory, this is hindered in practice by undersampling, orthogonality, and modulation issues. Undersampling refers to the loss of 1D resolution when the sampling frequency is insufficient to retain the quality of separation offered by the first dimension. Current consensus is that each 1D peak should be analyzed three to four times in the 2D to minimize the loss of 1D resolution (5). Although this requires ultrafast 2D analyses, it is attainable through ultrahigh-pressure LC (UHPLC) instrumentation, whereby second dimension cycle times as low as ~15–20 s can be applied. The orthogonality requirement refers to the need for sufficient selectivity differences between the separation dimensions (6). Because selectivity in HPLC can be easily tuned via the mobile phase and stationary phase composition, this requirement is usually manageable. Nevertheless, most combinations of the separation modes depict some degree of correlation in terms of selectivity.
However, one of the most difficult problems of 2D-LC is the effectiveness of the modulation process. This deals with the transfer of fractions between both dimensions. The large sample volume transferred to the short 2D column principally contradicts good practices in HPLC because it attempts to inject excessively large sample volumes on a short column operated at a mobile phase flow rate vastly larger than the optimal velocity. Hence, this easily leads to injection band broadening, peak splitting, or even breakthrough issues, which are challenging to mitigate. Without a refocusing mechanism, this constrains the design of most 2D-LC setups to microbore 1D columns, combined with broader conventional bore 2D columns. Consequently, 2D-LC is often hindered by a lower sensitivity compared to 1D-HPLC because of the resulting dilution, while depicting a high solvent consumption in 2D. In turn, this affects electrospray ionization–mass spectrometry (ESI-MS) performance and usually requires flow splitting prior to the detector, which leads to sensitivity losses (when various 2D column i.d.s are compared to one another, as discussed further on). Modulation challenges occur in varying degrees in most column combinations used in 2D-LC, and they can become so problematic that particular combinations are considered unusable. Although various solutions have been proposed in 2D-LC to overcome these issues, including dilution, splitting, evaporation, switching, and cooling of the 1D effluent, these either limit the applicability, separation performance, sensitivity, or ease of use of the system while increasing the systems complexity (7).
Fortunately, some column combinations are exempt from the modulation constraints because they offer inherent and complete on-column refocusing. For example, this occurs when purely aqueous 1D separations are combined with RP gradients in 2D. Because an aqueous 1D effluent has no eluotropic strength for compounds retained on a 2D-RP column, this results in excellent on-column focusing at the head of the latter column. In turn, this allows for the transfer of very large loop volumes, which leads to a variety of unique benefits and applications based on purely aqueous TRLC.
Proof of Principle
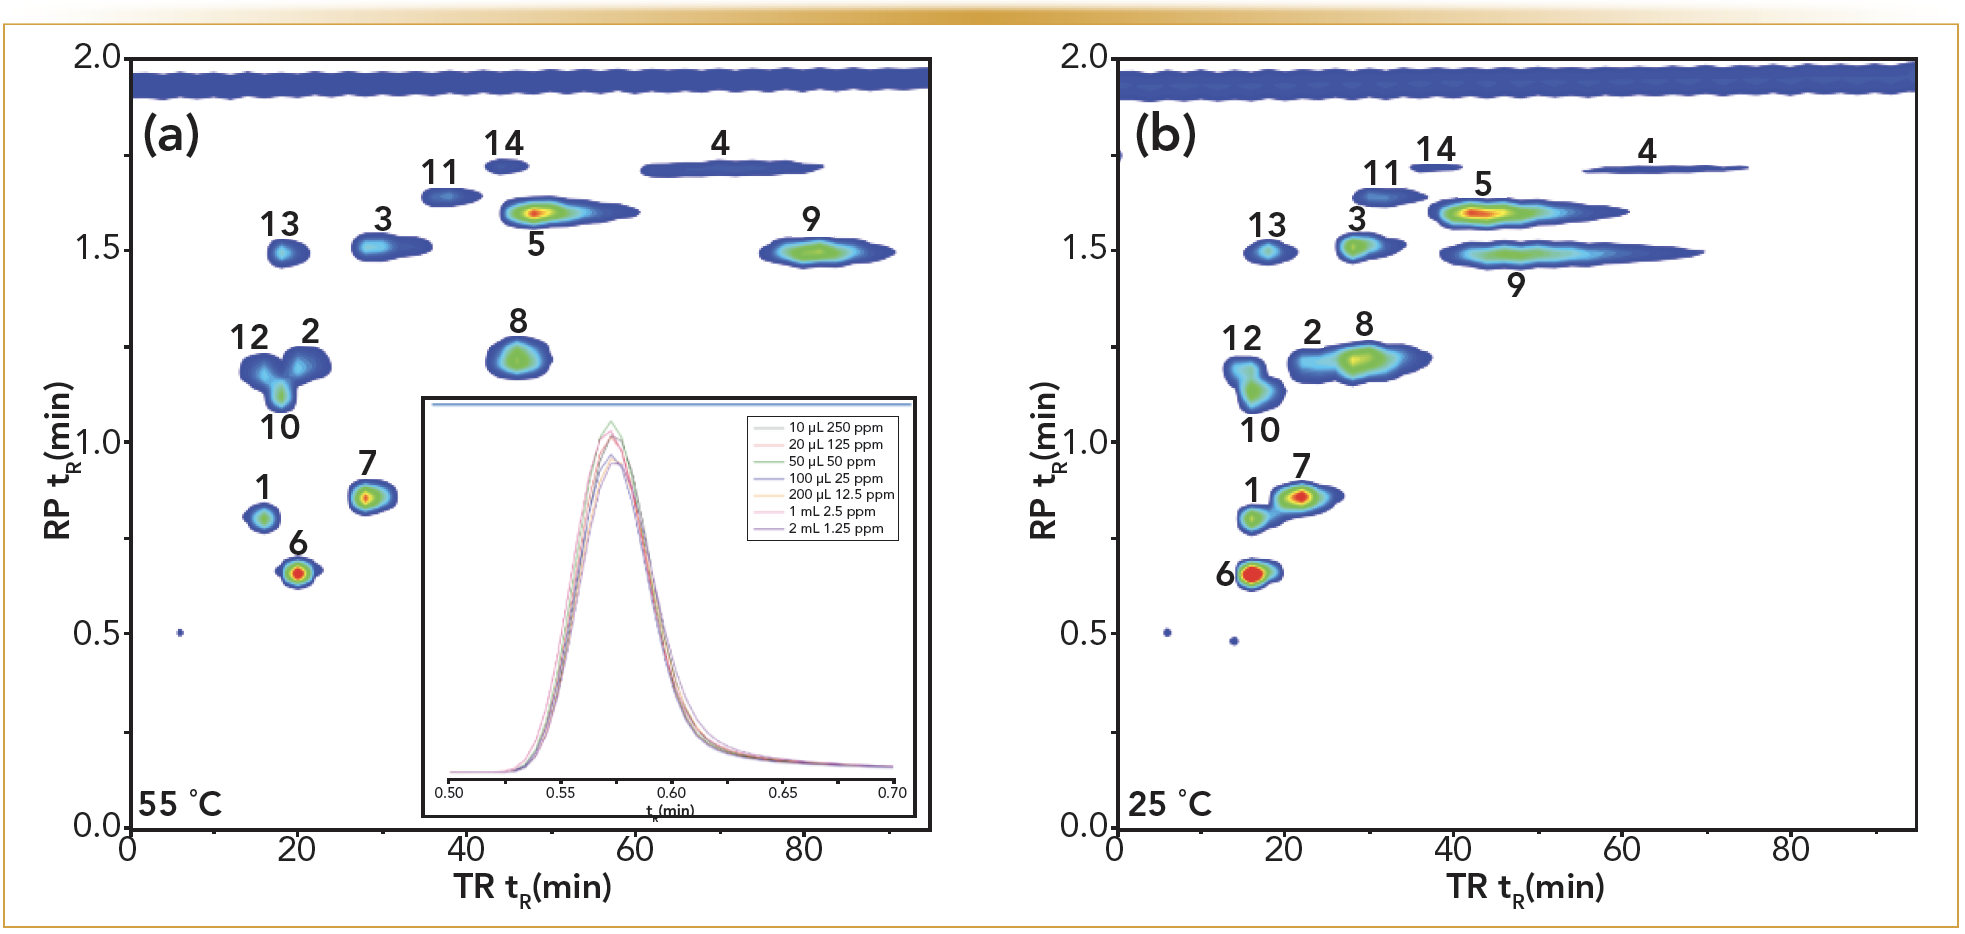
The potential of TRLC×RPLC was first introduced through analyzing test solutes such as parabens, alkoxybenzenes, and phenones, as shown in Figure 1 (2). The influence of the temperature on the retention of the used temperature-responsive column for these solutes is visible on the horizontal axis, whereby the retention decreases at lower temperatures because of the decreasing hydrophobicity of the stationary phase. This early work on homemade 2D-LC instrumentation illustrated that satisfactory, easy, and robust separations could be reached this way. Because hydrophobicity plays a large role in the retention mechanism of both RPLC and TRLC, a certain degree of correlation is observed (through the grouping of the peaks in the top left zone of the plot). However, the discrepancies in selectivity appeared to remain largely sufficient for effective 2D-LC separations. Note that the retention and selectivity can further be altered via larger changes in the TRLC column temperature or via changes in the mobile phase composition of (mainly) 2D, without affecting the effectiveness of the modulation process. These contour plots also illustrate that despite the transfer of already large loop volumes of 200 μL, this did not result in detrimentally affected peak shapes on the 2D column. The completeness of this refocusing process is also illustrated through the figure insert. The same amount of methylparaben (2.5 μg), dissolved in various injection volumes of water ranging from 10 μL up to 2 mL, was transferred on the short RPLC column and subjected to the same gradient analyses. The resulting unaffected peak widths, shapes, and areas confirmed that any amount of purely aqueous mobile phase volume could be refocused in RPLC. As a consequence, the choice of the 1D column diameter becomes much less restrained in TRLC×RPLC method development. Therefore, the sampling times also can be selected based on the undersampling criteria only, and not on the effect of 1D fraction volumes.

 55 °C and (b) 25 °C. Gradient RPLC was performed in 2D. Compound labels: 1. acetophenone; 2. propriophenone; 3. butyrophenone; 4. hexanophenone; 5. benzophenone; 6. methylparaben; 7. ethylparaben; 8. propylparaben; 9. butylparaben; 10. propylbenzoate; 11. butylbenzoate; 12. methoxybenzene; 13. ethoxybenzene; 14. butoxybenzene (2). Peak profiles of increasing volumes of methylparaben transferred to the second dimension column. See text for details.")
FIGURE 1: Contour plots at 254 nm obtained for the TRLC × RPLC separation of a test mixture, with the 1D TRLC separation operating at (a) 55 °C and (b) 25 °C. Gradient RPLC was performed in 2D. Compound labels: 1. acetophenone; 2. propriophenone; 3. butyrophenone; 4. hexanophenone; 5. benzophenone; 6. methylparaben; 7. ethylparaben; 8. propylparaben; 9. butylparaben; 10. propylbenzoate; 11. butylbenzoate; 12. methoxybenzene; 13. ethoxybenzene; 14. butoxybenzene (2). Peak profiles of increasing volumes of methylparaben transferred to the second dimension column. See text for details.
Pharmaceutical Impurity Analysis by TRLC × RPLC-Ultraviolet (UV)
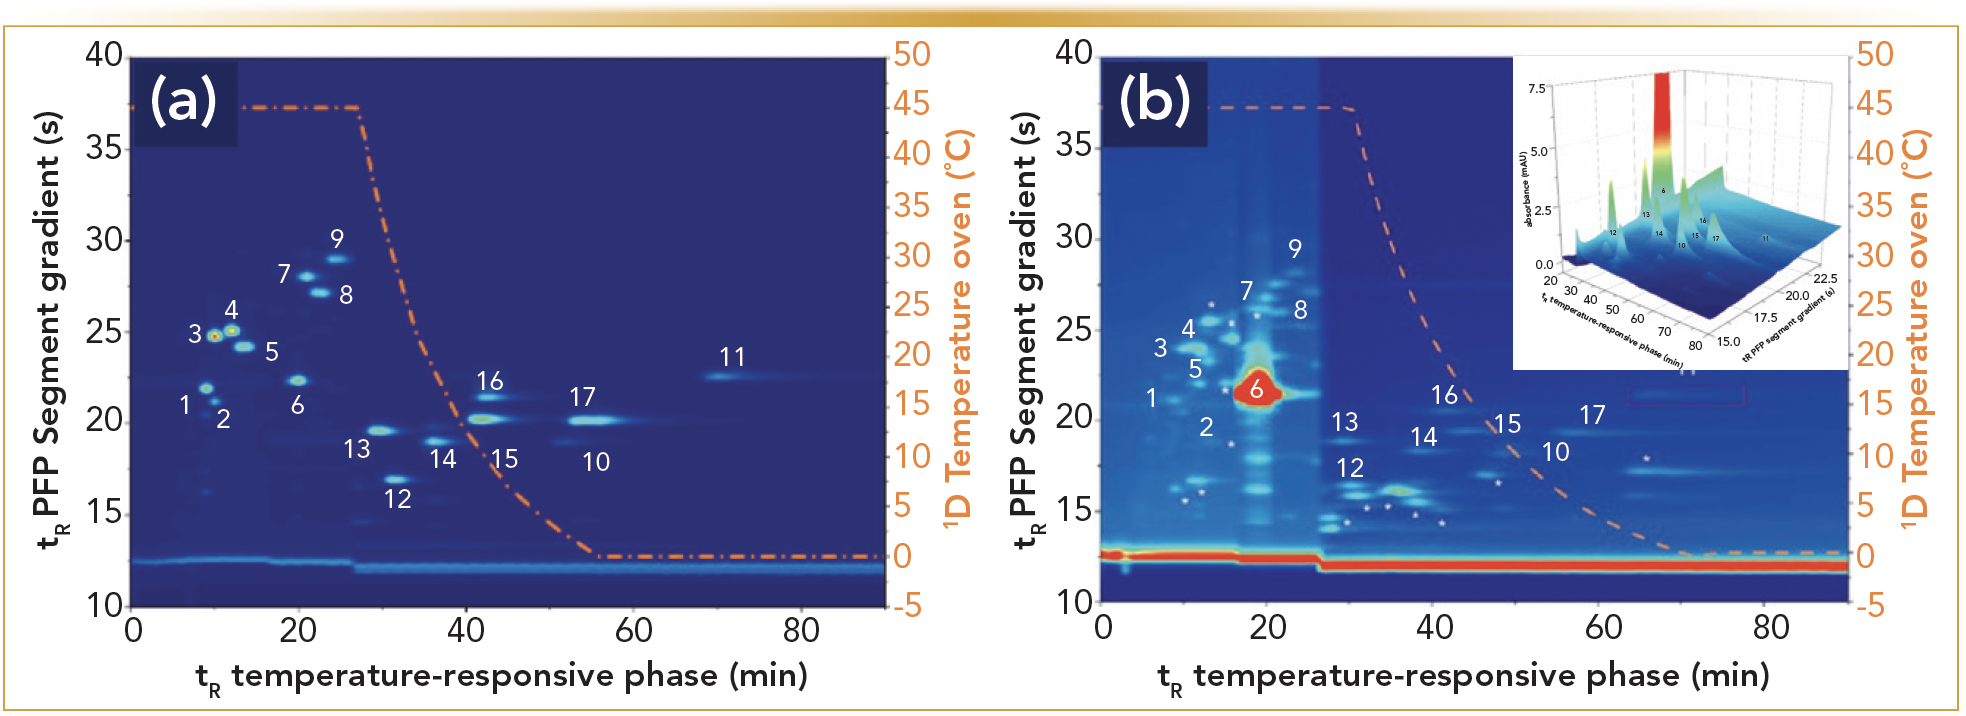
Although many studies have described the potential of heart-cutting 2D-LC in pharmaceutical analysis, the use of comprehensive 2D-LC for such purposes has been more limited. This is related to the higher methodological complexity, novelty of the approach, enhanced cost of the apparatus, and the more challenging validation of 2D-LC methods. Consequently, the use thereof in pharmaceutical analyses has been limited to qualitative analyses where the emphasis was on the separation abilities. Therefore, the separation potential of TRLC × RPLC-UV, together with its ability to determine trace amounts, was studied through the analysis of pharmaceutical impurities next to an overabundance of active pharmaceutical ingredients (APIs). In Figure 2a, a resulting contour plot is shown for 17 structurally similar steroids by TRLC × RPLC-UV (8). A downwards temperature gradient was thereby imposed on the TRLC column (to reduce analysis time) and the 2D analysis was operated on a core-shell type of RPLC column. The used commercial 2D-LC instrumentation allowed for the modification of the applied 2D gradient throughout the analysis in a continuous or segmented way. The latter was applied whereby the 2D gradient profile was altered after 17 min. The ensuing method, which allowed the separation of all solutes, was subsequently used for determining the pharmaceutical impurities set at a 1 μg/mL concentration (0.05%) compared to an API concentration (100%) of 2000 μg/mL (Figure 2b). All impurities were clearly discernable and well above the LOD next to the main compound (beclomethasone). It was also interesting to observe that the inevitable peak broadening of the overloaded API was still well contained in both dimensions in a limited time window, allowing good detection of solutes eluting close to this compound.

. The 1D TRLC column temperature profile is displayed in orange. (a) sample composed out of 17 structurally similar steroid concentrations between 30 and 60 μg/mL. (b) 0.05% experiments with the API (#6: beclomethasone) at 2 mg/mL versus the other solutes at 1 μg/mL (injection volume 6 μL). Insert: A 3D image of (b).")
FIGURE 2: The TRLC×RPLC separation of a test mixture of 17 structurally similar steroids whereby a segmented gradient was used (8). The 1D TRLC column temperature profile is displayed in orange. (a) sample composed out of 17 structurally similar steroid concentrations between 30 and 60 μg/mL. (b) 0.05% experiments with the API (#6: beclomethasone) at 2 mg/mL versus the other solutes at 1 μg/mL (injection volume 6 μL). Insert: A 3D image of (b).
Natural Product Analyses
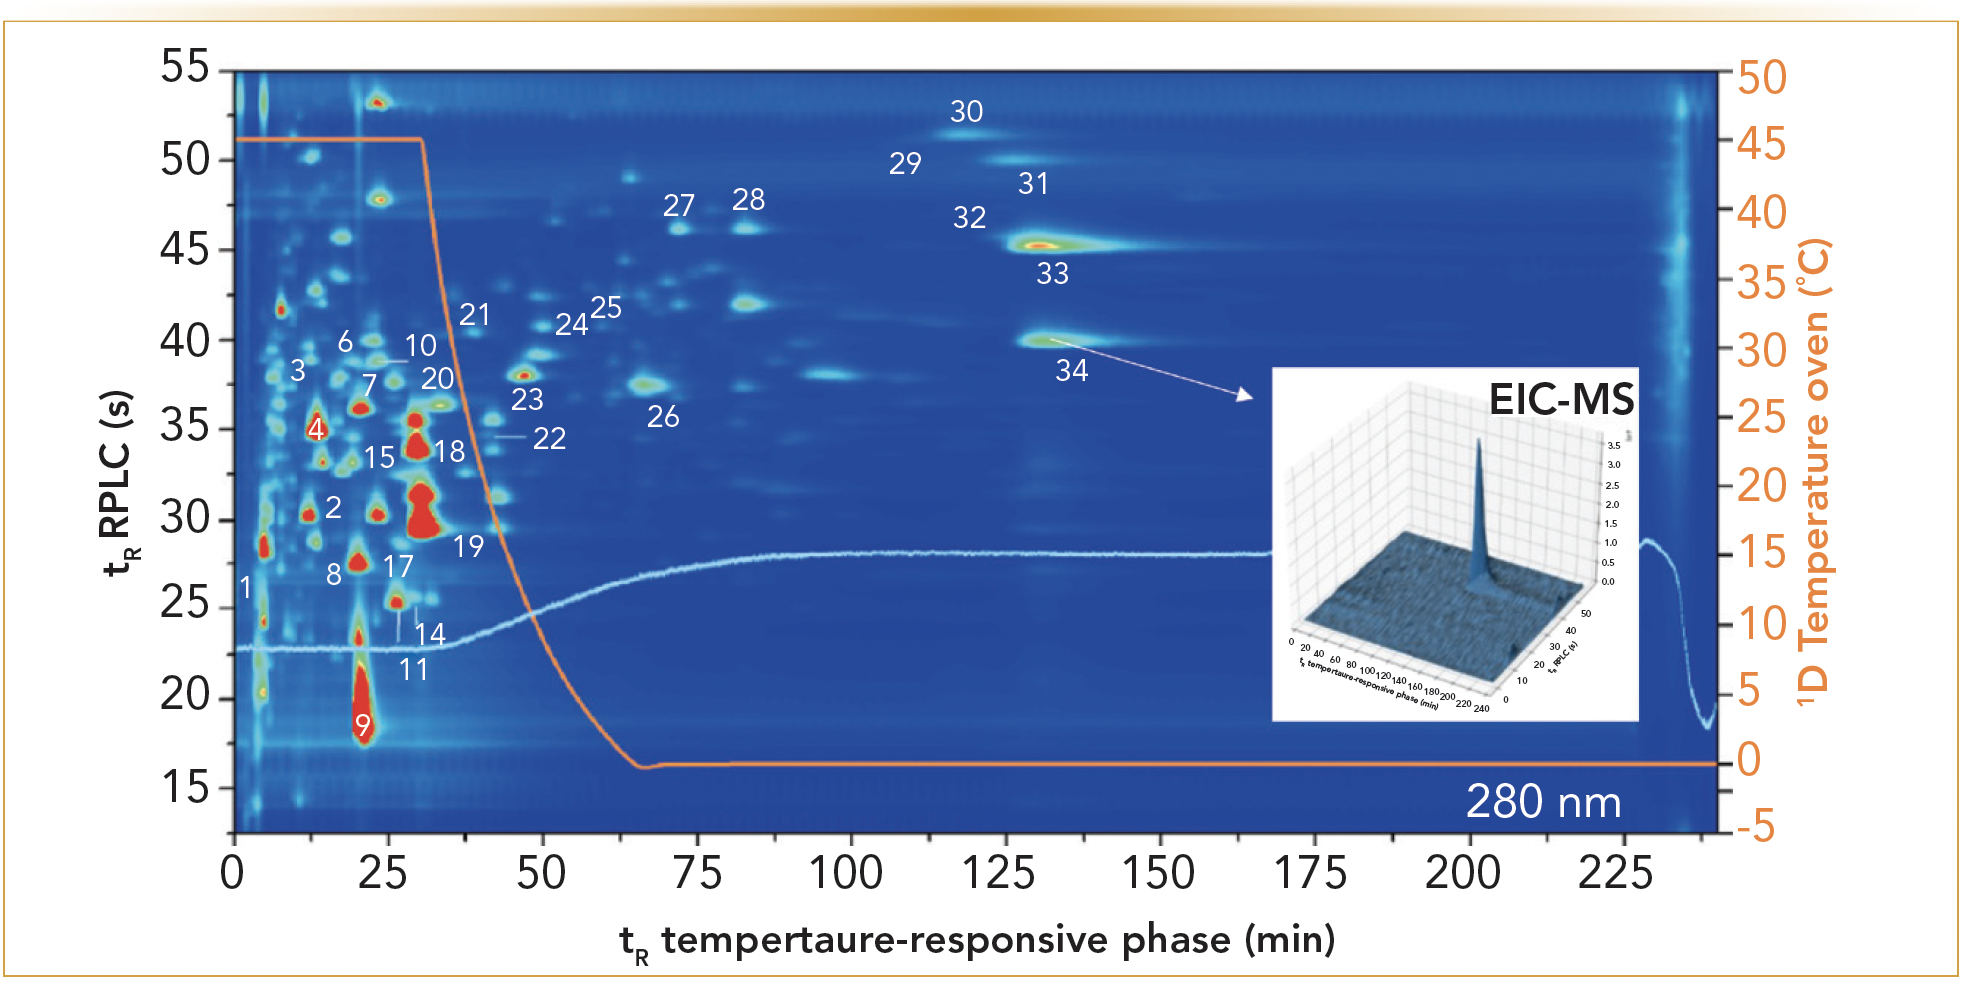
Next to such pharmaceutical samples, the methodology proved also to be applicable to more complex mixtures. Therefore, a similar setup was applied to natural products, in combination with diode-array detection (DAD) and ESI-MS detection (9). Figure 3 depicts the resulting analysis of the phenolic fraction in a red wine, where the simultaneously collected extracted ion chromatogram (EIC) of myricetin is shown as an example. The orthogonality differences between TRLC and RPLC appear better in this example mainly because TRLC can retain and subsequently elute phenolic compounds well. Note here that downward temperature gradients were imposed on the TRLC dimension to limit the analysis time. This example illustrates an excellent ability to discern, separate, and identify phenolic solutes.

. Insert: ion trap-MS based extracted ion chromatogram of myrecitin (9).")
FIGURE 3: TRLC × RPLC-UV/MS separation of the phenolic fraction of a young South African red wine at 280 nm. The first dimension was performed using a reversed temperature gradient from 45 to 0 °C at 30 min, indicated by the orange signal. The peak numbers correspond to a number identified phenolics (9). Insert: ion trap-MS based extracted ion chromatogram of myrecitin (9).
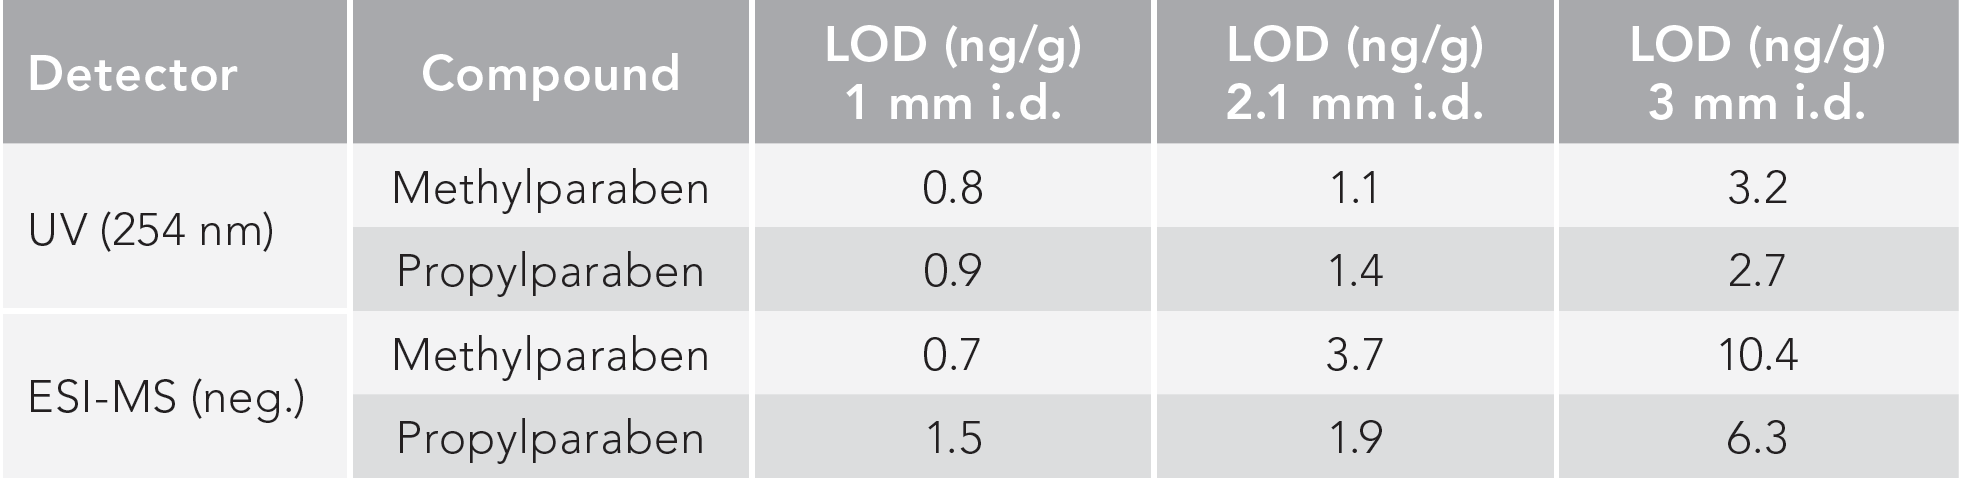
Enhanced Sensitivity via Narrow-Bore 2D Columns
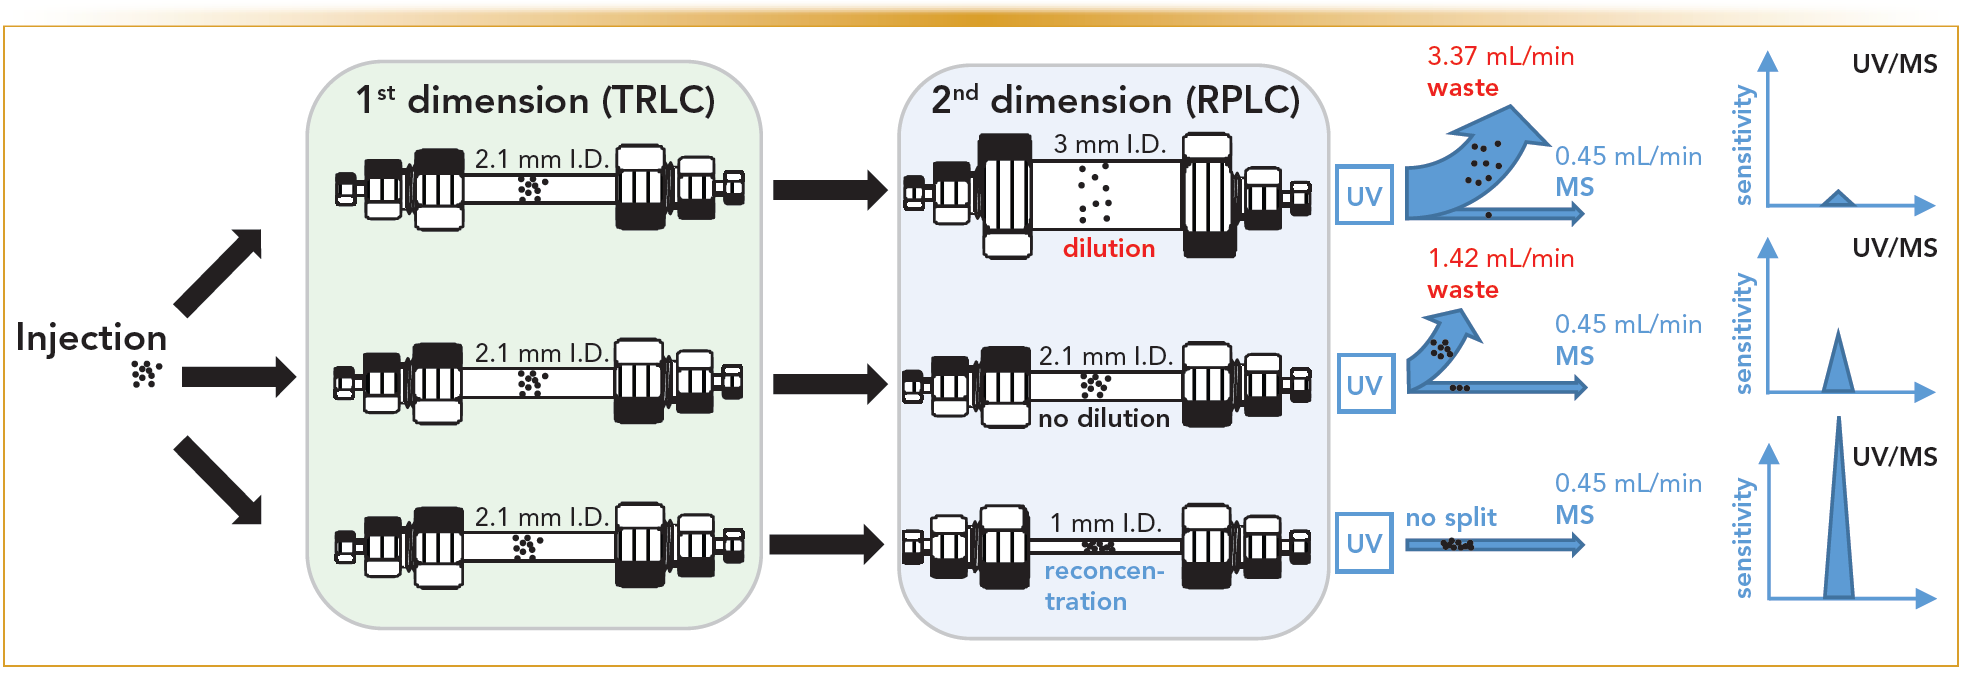
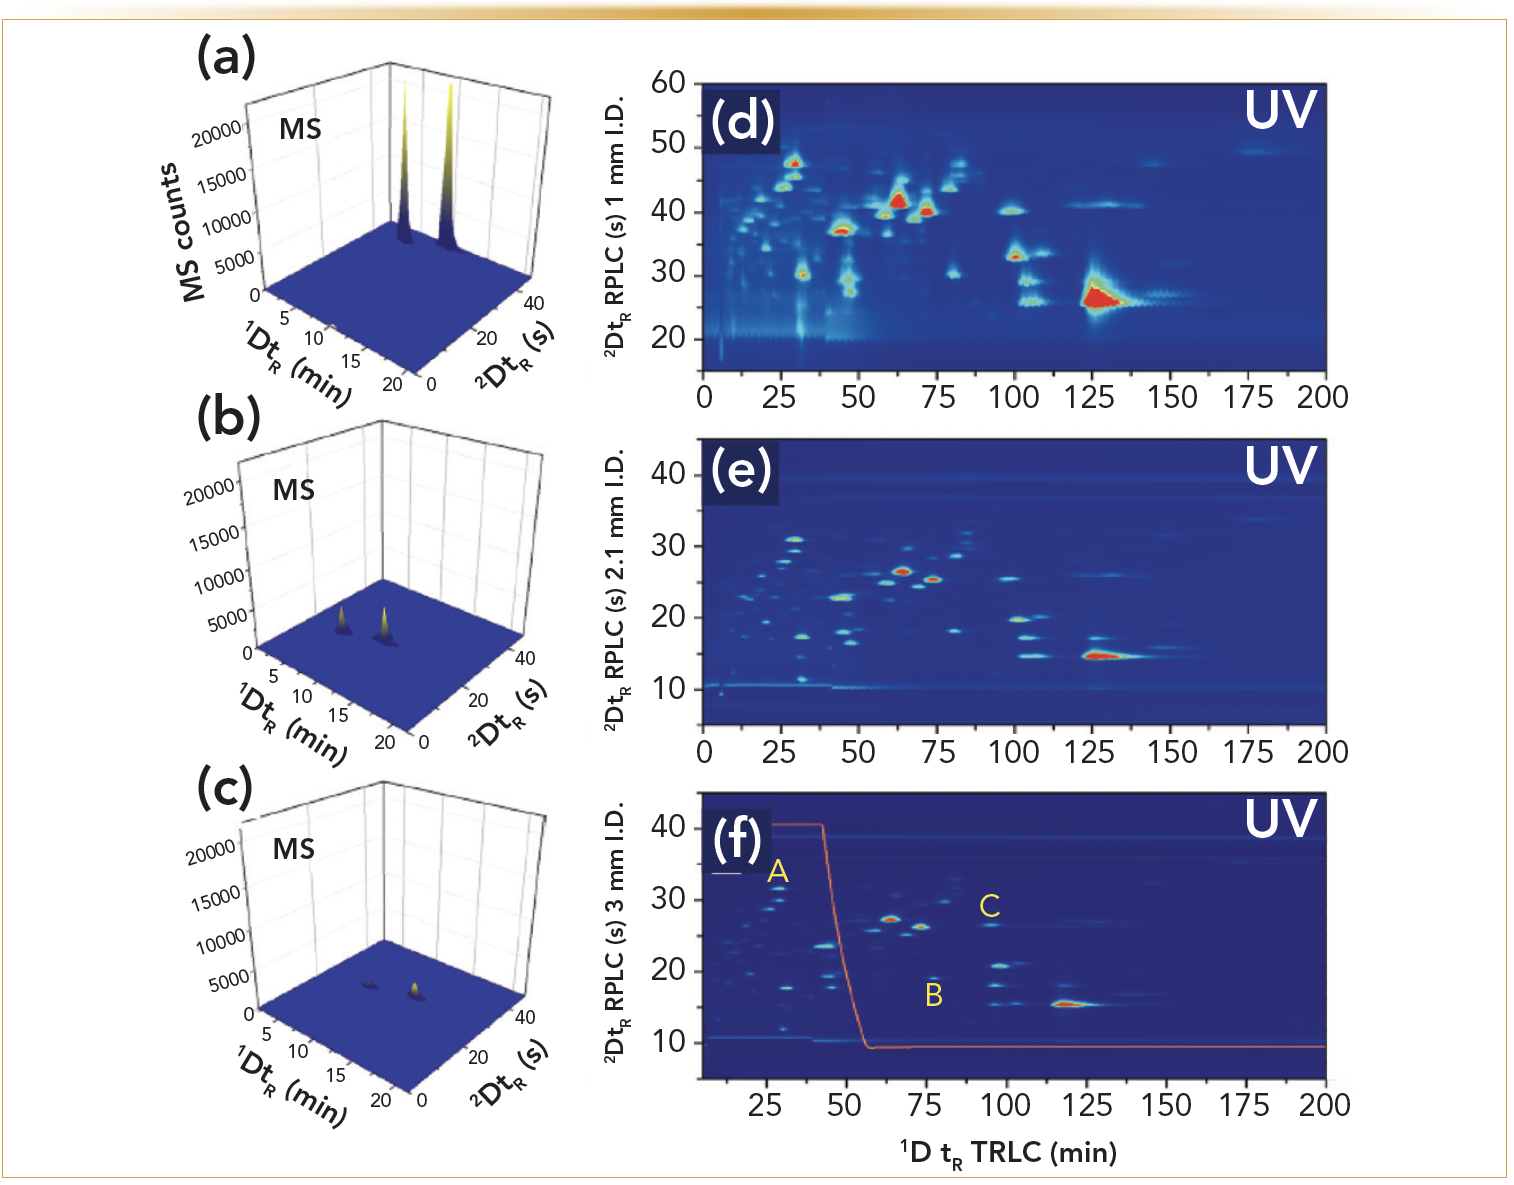
In current 2D-LC practices, with limited exceptions, the diameter of the 2D column is broader in comparison to the 1D column. This is because of the difficult transfer and refocusing of large sample plugs (loop volumes) in the 2D. This causes dilution, necessitates larger flow rates in 2D, and reduces the sensitivity of concentration sensitive detectors (such as UV or ESI-MS). When ESI-MS detection is combined with 2D-LC, flow splitting is required in most cases. To overcome these issues, the possibility to reduce the 2D column i.d. to equal, or to a more narrow i.d., compared to the 1D column (with a fixed i.d. of 2.1 mm) was investigated (10). In this way, the sensitivity achieved for the two parabens on 3, 2.1, and 1 mm i.d. 2D columns was compared using UV and mass spectrometry (MS) detection. A schematic drawing of the approach is shown in Figure 4. The LODs obtained in this way were determined under strictly comparable conditions (Table I). The benefits of this miniaturization in a concentration sensitive detector, such a UV, became apparent, whereby enhanced LOD performance proved to be in line with expectations. This confirms that, despite the comparatively larger loop volume (80 μL) transferred to narrow bore 2D column, the peak shapes are not detrimentally affected in 2D, allowing for optimal exploitation of the approach. Similarly, the MS data also shows that rather large reductions in LOD can be attained in this way. It should thereby be noted that the 1-mm 2D column allowed for direct coupling to the ESI-MS (at 450 μL/min); hence, no flow splitting was required as compared to the standard practice with the other two (2.1 and 3 mm i.d.) columns. It is important to stress that this solution allows for a generic improvement of sensitivity for any molecule analyzable with such a platform. Further compound specific improvements can then be developed based on additional sample preparation (preconcentration), or via the implementation of specific tandem MS (MS/MS) transitions. The ensuing sensitivity gains can also be observed through Figure 5, representing the corresponding three-dimensional (3D) plots obtained by ESI-MS detection for the parabens and for the analysis of a natural product extract by UV detection, respectively.

 sensitivity.")
FIGURE 4: Schematic drawing of the dilution processes taking place in the various setups, together with the necessary large split ratios required when using broader columns in 2D with ESI-MS. The cumulative effects off the complete refocusing of the solutes on the RPLC column, the smaller radial dilution and the corresponding unnecessariness of flow-splitting on narrow 2D columns allows ultimately for enhanced ESI-MS (and UV) sensitivity.

. Flow splitting was required prior to the MS for the 2.1- and 3-mm i.d. 2D columns, such that on all columns 450 μL/min was introduced in the ESI-MS.")
TABLE I: LODs obtained for methyl and propylparaben under comparable conditions for three 2D column i.d.s. The flow rates on the 1-, 2.1-, and 3-mm i.d. columns were 0.45, 1.87, and 3.82 mL/min, respectively. LODs were calculated by: LOD = 3.3 σ/slope, where σ corresponded to the residual standard deviation of calibration curves constructed close to the LODs (10). Flow splitting was required prior to the MS for the 2.1- and 3-mm i.d. 2D columns, such that on all columns 450 μL/min was introduced in the ESI-MS.

 TRLC × RPLC-ESI-MS 3D (extracted ion chromatograms) plots obtained for 15 ng/mL of methyl and propylparaben for various increasing 2D column i.d.s. (a): 1 mm, (b): 2.1 mm, (c): 3 mm). The 1 mm i.d. column allowed for direct transfer of the column effluent (450 μL/min) into the MS. (b) and (c) required flow splitting to avoid detector flooding. (d–e) Similar approach for the analysis of a blueberry phenolic extract via UV (at 280 nm) (10).")
FIGURE 5: (a–c) TRLC × RPLC-ESI-MS 3D (extracted ion chromatograms) plots obtained for 15 ng/mL of methyl and propylparaben for various increasing 2D column i.d.s. (a): 1 mm, (b): 2.1 mm, (c): 3 mm). The 1 mm i.d. column allowed for direct transfer of the column effluent (450 μL/min) into the MS. (b) and (c) required flow splitting to avoid detector flooding. (d–e) Similar approach for the analysis of a blueberry phenolic extract via UV (at 280 nm) (10).
Combined Exploitation of Temperature and Flow Rate Gradients in TRLC
Although the above shows that the combination of TRLC with RPLC in 2D-LC offers promise, it also showed that TRLC is still hindered by rather large analysis times. This is mainly because small particle UHPLC-type TRLC columns are yet to be manufactured. An alternative solution to circumvent this issue is by combining the use of temperature and mobile phase flow rate gradients. Constant flow rates are traditionally favored in HPLC because it leads to simpler methods, which are considered easier to validate. The main concerns formulated against variable (gradient) flow rate methods are the decreasing peak areas obtained at higher flow rates when concentration sensitive detectors, such as UV or ESI-MS, are used. Additionally, flow rate gradients also do not allow operation at the optimal chromatographic velocity over the entire method.
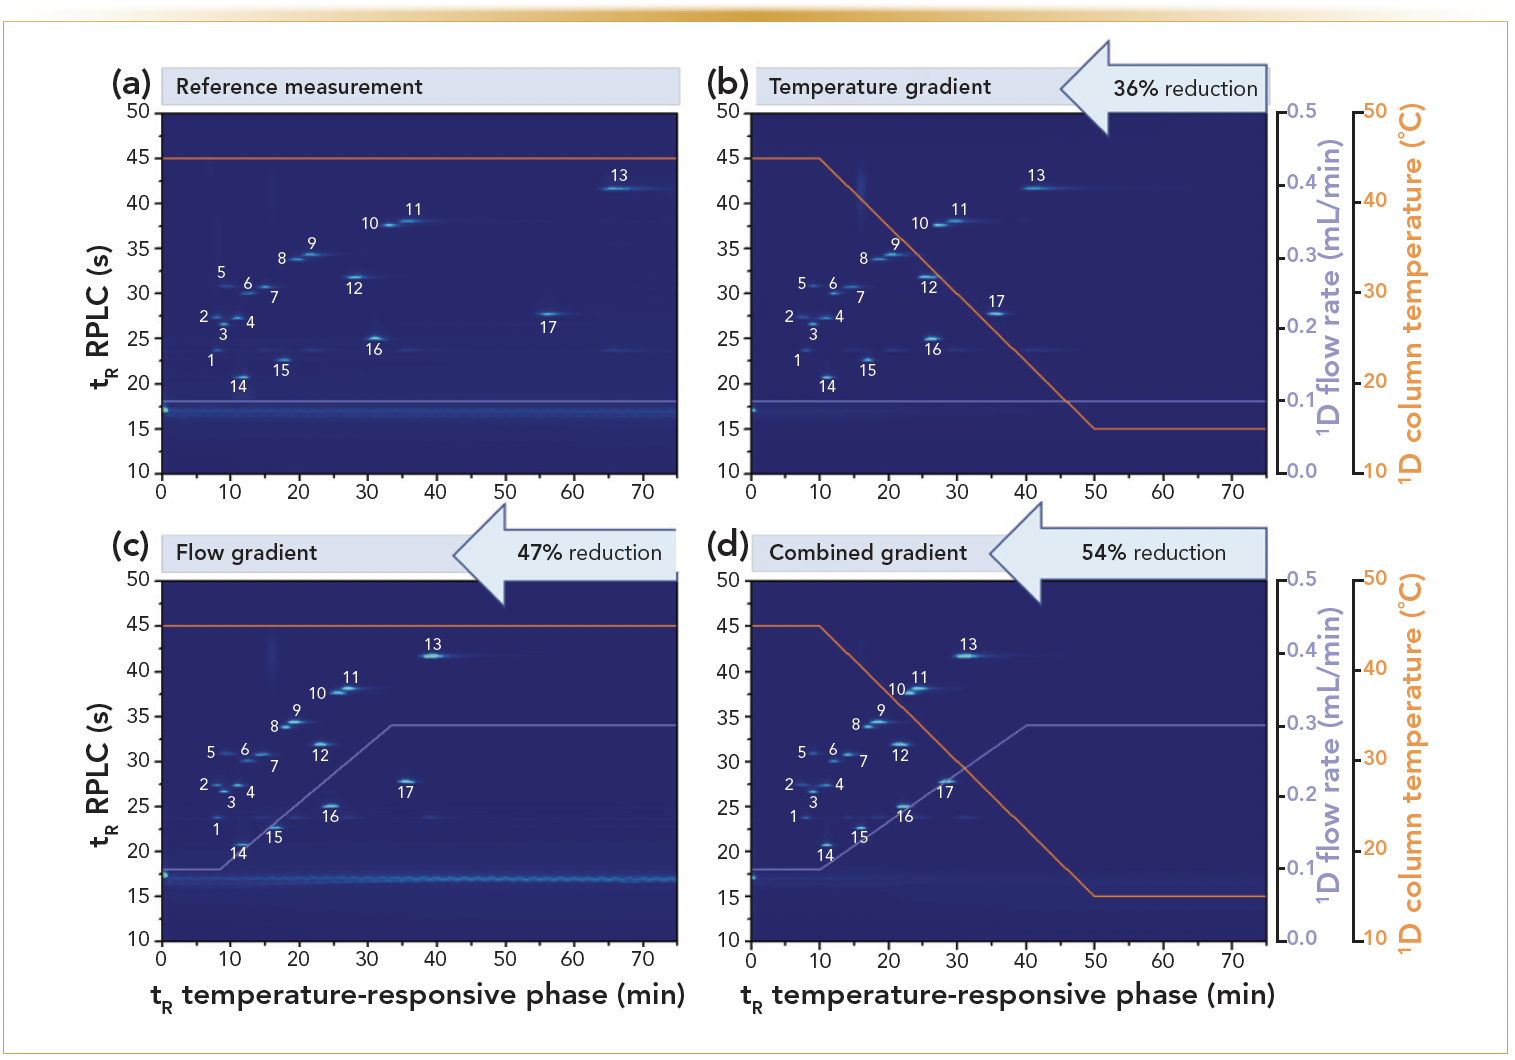
On the other hand, the benefits of the use of flow rate gradients have also been demonstrated through the operation closer to the kinetic performance limits of the chromatographic system and columns. This illustrated that performing quantitative analyses remains possible also via such approaches (11,12). In the proposed TRLC-based 2D-LC approach, increasing flow rate gradients were used in the 1D. The approach differed from the other earlier TRLC × RPLC work in the way that large 500-μL loops were now used in the modulator. This allowed performing 2D-LC under all TRLC flow rates without being confronted with losses (which would be the case if the loop volume would be too small for a given 1D flow rate) (13). Because the 2D-RPLC analyses were performed as before, and were operated at a conventional fixed flow rate, this allowed us to obtain faster 2D-LC methods because of the decreased analysis time of the 1D. The quantitative performance of the methods was also not detrimentally affected (Figure 6). Note that this approach could not work without full refocusing of the now large aqueous loop volumes at the head of the 2D column (13).

 Reference measurement, (b) temperature gradient, (c) an upwards flow gradient, (d) and a combined gradient, were used to reduce analysis time and compared to a reference measurement (a) (13).")
FIGURE 6: TRLC × RPLC separation of 17 aromatic analytes at different 1D conditions. The 2D method and the loop size were kept constant. The orange line represents the applied the 1D column temperature, the purple line corresponds to the flow rate. (a) Reference measurement, (b) temperature gradient, (c) an upwards flow gradient, (d) and a combined gradient, were used to reduce analysis time and compared to a reference measurement (a) (13).
Conclusion
Various approaches were developed based on the combination of temperature-responsive and RPLC in the 1D and the 2D of comprehensive 2D-LC, respectively. The strategy was based on the problem-free transfer and refocusing of large loop volumes of purely water-based mobile phases on the RP 2D. This offers benefits in terms of separation performance, ease of use, and sensitivity of TRLC × RPLC. The possibilities of the approach were demonstrated via the analysis of natural products, pharmaceutical impurity analyses and test solutes. It was shown that 2D-LC-UV/MS can become more sensitive as compared to 1D approaches whereby also various possibilities are available to speed up the analysis times. As both the fields of 2D-LC and TRLC are continuously evolving, many further applications and improvements are to be expected in the coming years. Based on the progress of this research, broadly applicable, yet easy to use 2D-LC techniques utilizing TRLC appear to be on the horizon.
References
(1) Lynen, F.; Heijl, J. M. D.; Du Prez, F. E.; Brown, R.; Szucs, R.; Sandra, P. Evaluation of the Temperature Responsive Stationary Phase Poly(N-isopropylacrylamide) in Aqueous LC for the Analysis of Small Molecules. Chromatographia 2007, 66 (3–4), 143–150. DOI: 10.1365/s10337-007-0301-z
(2) Baert, M.; Martens, S.; Desmet, G.; et al. Enhancing the Possibilities of Comprehensive Two-Dimensional Liquid Chromatography through Hyphenation of Purely Aqueous Temperature-Responsive and Reversed-Phase Liquid Chromatography. Anal. Chem. 2018, 90 (8), 4961–4967. DOI: 10.1021/acs.analchem.7b04914
(3) Baert, M.; Wicht, K.; Hou, Z.; Szucs, R.; Du Prez, F.; Lynen, F. Exploration of the Selectivity and Retention Behavior of Alternative Polyacrylamides in Temperature Responsive Liquid Chromatography. Anal. Chem. 2020, 92 (14), 9815–9822. DOI: 10.1021/acs.analchem.0c01321
(4) Lynen, F.; Ampe, A.; Bandini, E.; et al. Perspectives in Hydrophobic Interaction Temperature-Responsive Liquid Chromatography (TRLC). LCGC North Am. 2022, 40 (12), 566–572. DOI: 10.56530/lcgc.na.vd2373d8
(5) Murphy, R. E.; Schure, M. R.; Foley, J. P. Effect of Sampling Rate on Resolution in Comprehensive Two-Dimensional Liquid Chromatography. Anal. Chem. 1998, 70, 1585–1594. DOI: 10.1021/ac971184b
(6) Stoll, D. R.; Li, X. P.; Wang, X. O.; et al. Fast, Comprehensive Two-Dimensional Liquid Chromatography. J. Chromatogr. A 2007, 1168, 3–43. DOI: 10.1016/j.chroma.2007.08.054
(7) Chapel, S.; Heinisch, S. Strategies to Circumvent the Solvent Strength Mismatch Problem in Online Comprehensive Two-Dimensional Liquid Chromatoigraphy. J. Sep. Sci. 2022, 45 (1), 7–26. DOI: 10.1002/jssc.202100534
(8) Wicht, K.; Baert, M.; Kajtazi, A.; et al. Pharmaceutical Impurity Analysis by Comprehensive Two-Dimensional Temperature Responsive × Reversed Phase Liquid Chromatography. J. Chromatogr. A 2020, 1630, 461561. DOI: 10.1016/j.chroma.2020.461561
(9) Wicht, K.; Baert, M.; Muller, M.; et al. Comprehensive Two-Dimensional Temperature-Responsive × Reversed Phase Liquid Chromatography for the Analysis of Wine Phenolics. Talanta 2022, 236, 122889. DOI: 10.1016/j.talanta.2021.122889
(10) Wicht, K.; Baert, M.; Schipperges, S. Enhanced Sensitivity in Comprehensive Liquid Chromatography: Overcoming the Dilution Problem in LC × LC via Temperature-Responsive Liquid Chromatography. Anal. Chem. 2023, 94 (48), 16728–16737. DOI: 10.1021/acs.analchem.2c03300
(11) Verstraeten, M.; Broeckhoven, K.; Lynen, F.; et al. Quantification Aspects of Constant Pressure (Ultra) High Pressure Liquid Chromatography Using Mass-Sensitive Detectors with a Nebulizing Interface. J. Chromatogr. A 2013, 1274, 118–128. DOI: 10.1016/j.chroma.2012.12.013
(12) Verstraeten, M.; Broeckhoven, K.; Lynen, F.; et al. Comparison of the Quantitative Performance of Constant Pressure Versus Constant Flow Rate Gradient Elution Separations Using Concentration-Sensitive Detectors. J. Chromatogr. A 2012, 1232, 65–76. DOI: 10.1016/j.chroma.2011.10.019
(13) Wicht, K.; Baert, M.; von Doehren, N.; et al. Speeding Up Temperature-Responsive × Reversed-Phase Comprehensive Liquid Chromatography Through the Combined Exploitation of Temperature and Flow Rate Gradients. J. Chromatogr. A 2022, 1685, 463584. DOI: 10.1016/j.chroma.2022.463584
ABOUT THE CO-AUTHORS
Frédéric Lynen, Kristina Wicht, Ardiana Kajtazi, Elena Bandini, Gaëlle Spileers, Turaj Rahmani, Mathijs Baert, Adriaan Ampe, and Jonas Veenhoven are with the Separation Science Group at Ghent University, in Ghent, Belgium. André de Villiers is with the Department of Chemistry and Polymer Science at the University of Stellenbosch, in Stellenbosch, South Africa. Direct correspondence to: Frederic.Lynen@UGent.be
ABOUT THE COLUMN EDITOR


David S. Bell is a Research Fellow in Research and Development at Restek. He also serves on the Editorial Advisory Board for LCGC and is the Editor for “Column Watch.” Over the past 20 years, he has worked directly in the chromatography industry, focusing his efforts on the design, development, and application of chromatographic stationary phases to advance gas chromatography, liquid chromatography, and related hyphenated techniques. His main objectives have been to create and promote novel separation technologies and to conduct research on molecular interactions that contribute to retention and selectivity in an array of chromatographic processes. His research results have been presented in symposia worldwide, and have resulted in numerous peer-reviewed journal and trade magazine articles. Direct correspondence to: LCGCedit@mmhgroup.com.


Why is Open-Access Hyphenation Important for Chromatographers?
October 4th 2023At HPLC 2023, John Langley, a professor at the University of Southampton in Southampton, UK, presented a talk called "(R)evolution of Hyphenations, Through Open-Access RP-HPLC–MS, Open-Access UHPSFC–MS and 2D-LC–IMS-MS in Academia". He spoke with LCGC on the importance of open-access hyphenation, and how to implement it in your research.


