A Review of Recent Developments in Analytical Characterization of Glycosylation in Therapeutic Proteins
LCGC North America

Advanced separation and mass spectrometry methods enable comprehensive profiling of the inherent glycan heterogeneities of protein therapeutics. In particular, reversed-phase HPLC–based multiattribute methods (MAMs) provide a wealth of information, and other techniques, such as HILIC and CE-MS, also continue to evolve.
Glycosylation is a critical quality attribute of therapeutic proteins, impacting biological activity, immunogenicity, and serum half-lives of biotherapeutics. The manufacturing of these entities is inherently complex. Furthermore, the absence of reference cell lines, process changes, and other genetic and metabolic predispositions often results in considerable glycan heterogeneity in the commercial products. Given these myriad factors governing glycosylation, detailed product characterization, including that of structural isomers, is a necessary prerequisite for achieving a better understanding of the glycosylation pattern. Here, we review current developments in the analytical characterization of the glycosylation in therapeutic proteins.
Anurag S. Rathore, Ira Krull, and Niharika Budholiya
With the advances in analytical technology during the past decade, biotherapeutics or biologicals now represent an important and growing class of drugs. They require extensive characterization, due to their large size and complexity (1). Systems to produce these biologics include expression in bacteria, yeast, mammals (mostly Chinese hamster ovary [CHO]), plants, insects, and transgenic organisms (2). The final biotherapeutic product is influenced by many variables, such as type of expression system, growth conditions, purification process, actual formulation, and conditions during storage and transport (3). Many post-translational modifications (PTMs), such as glycosylation, phosphorylation, sulfation, acetylation, methylation, and hydroxylation, can occur during the production process, and these modifications are crucial for structural integrity and biological activity of the product (4). Of these PTMs, perhaps the most critical is that of glycosylation (5,6). Glycan moieties of therapeutic proteins are known to significantly affect in vivo safety and efficacy (for example, pharmacodynamics and pharmacokinetics), protein folding, protein targeting and trafficking, ligand binding, stability, protein half-life regulation, and immunogenicity (7). Therefore, robust and quantitative analytical methods are required to characterize detailed glycan structures, as well as specific glycan subsets, to evaluate known critical features of therapeutic activities.
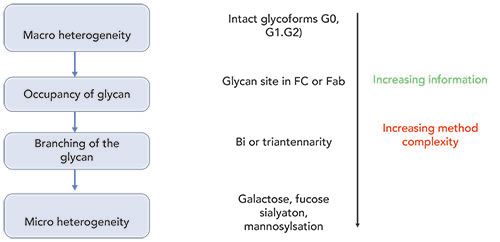
As shown in Figure 1, glycosylation analysis of monoclonal antibodies (mAbs) is performed at various levels, including intact glycoproteins, glycopeptides, glycosylated protein subunits, and released glycan levels (8). The intact-level analysis of mAbs involves mass deconvolution of the raw mass spectrometry (MS) spectrum to obtain information about the typical glycoforms distribution, such as the presence of complex type afucosylated glycan (G0/G1/G2) species (9). This information, along with the deglycosylated mass spectra, allows us to parse the relative contributions of the glycation on lysine residues of the protein (10). The released glycan analysis is facilitated by the enzymatic action of PNGase enzymes that cleave the glycan moieties attached to the protein backbone. Once released, the samples require additional processing steps, such as derivatization, to enhance fluorescence (FL) signal or ionization efficiency in MS (11). The efficiency of sample processing of the released glycans has dramatically improved over the years, both in terms of the time required for sample preparation as well as the signal obtained in both fluorescence and MS detection (11). The emergence of improved peptide ion fragmentation methods, such as electron-transfer dissociation (ETD) versus the usual collision-induced dissociation (CID), has also resulted in improvements in the accurate assignment of glycan site occupancy when analyzed at the glycopeptide levels (12). The progress in characterization of glycans at the subunit levels has greatly been facilitated by the introduction of the immunoglobulin-degrading enzyme of Streptococcus pyogenes (IdeS). This cleaves at the hinge region of mAbs (including all immunoglobulin [IgG] classes), thereby resulting in the generation of the F(ab)2 and Fc fragments (13). Further simplification of the structural characterization is achieved by subjecting these fragments to disulfide reduction by treating with dithiothreitol (DTT), resulting in the generation of six structural domains of mAbs (2x LC, 2xFd and 2xFc/2), each with molecular weights of 25 kDa (14). This article reviews recent developments in the analytical characterization of these complex entities, particularly with respect to various separation techniques, along with fluorescence-mass spectrometry (FL-MS) detection.


Figure 1: The framework for analytical characterization of glycans in therapeutic proteins, at intact, glycopeptide, subunit, and released glycan levels. With an increasing level of information, there is a simultaneous increase in method complexity. That often requires extensive method optimization and data interpretation.
Advances in Sample Preparation
Glycan characterization exploits various analytical methods to separate the glycan pool into different groups of glycans. Based on such separations, derivatized or underivatized pools can be analyzed using appropriate technologies, such as: high performance liquid chromatography (HPLC), where separation is based on physicochemical parameters such as hydrophilicity or hydrophobicity or charge; capillary electrophoresis (CE), where separation of labeled glycans is based on mass-to-charge ratio; lectin chips, where separation is based on binding strength; and MS, where separation is based on mass (8). To analyze glycans by various LC methods, the sugar chains must first be released by either enzymatic or chemical methods. PNGase is a commonly used enzyme for release of a variety of N-glycans. However, it is not specific for O-glycans; due to the variable structure of O-glycans and the narrow substrate specificity of available enzymes, the use of enzymatic methods for these glycans is limited (15). For chemical release, hydrazinolysis is the most commonly used method for the release of N- & O- glycans (16). The drawback associated with this method is degradation of reducing end monosaccharides (β elimination), and also the destruction of non-carbohydrate substituents, which can be minimized by alternative methods (17). Moreover, alditols obtained by β elimination also prevent subsequent labeling of the oligosaccharide, which may often be needed for detection of the glycans during separation and fractionation (17).
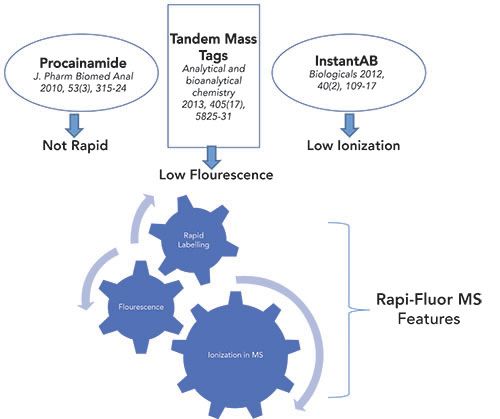
After separation by LC techniques, detection and quantification by a combination of a FL detector and a mass spectrometer are important. However, this is often impeded by a lack of chromophores or a low ionization efficiency of carbohydrates in MS. This can be overcome by introducing different chromophores or fluorescent labels, or by using reductive amination, which enables high sensitivity detection during separation. The labeling agents that are typically used are 2-aminopyridine (PA), 2-aminobenzamide (2-AB), 2-aminobenzoic acid (2-AA), 8-aminopyrene-1, 3, 6-trisulfonate (APTS), and 1,2-diamino-4,5-methylenedioxy-benzenedihydrochloride (DMB) (18). Although most of these labels perform optimally, either with FL or MS based analysis, having a label that yields a strong FL signal, as well as the ability to migrate reasonably well in MS, is relatively scarce. As shown in Figure 2, the Rapi-Fluor-MS label combines both of these attributes and therefore, sample preparation using this label is currently most suitable and preferred for LC-FL-MS workflows for glycan analysis (19).


Figure 2: Comparing various labels for conjugation with glycans for their efficient detection.
Advances in Separation of Glycans HILIC
Hydrophilic interaction chromatography (HILIC) is a method of choice for the separation of hydrophilic glycans, using neutral, polar, or ionic surfaces as stationary phases, and an organic solvent, with low percentages of water, as mobile phases (20). Glycans elute from a HILIC column in order of increasing polarity. The polarity of glycans is dependent on the size of the sugar moieties and their linkages (21). By implication, HILIC is not well-suited for the separation of glycans having similar polarity, such as G0/G0F-N and G1FS1/G2F (22).
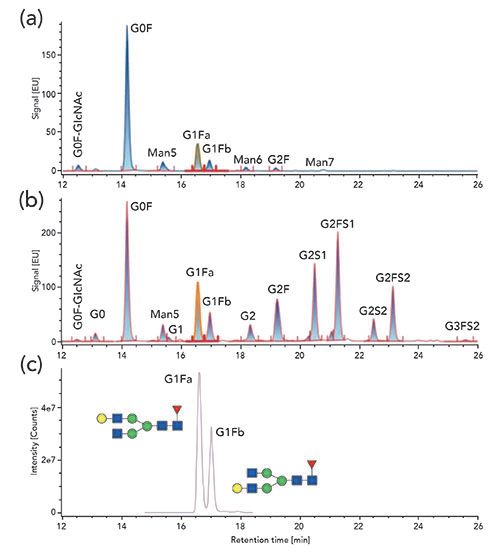
Both FL- and MS-based detection have been reported for released glycan analysis, using HILIC as the upfront separation unit operation. With HILIC-FL, nine glycans, from two different mAbs, have been reported to achieve good separation and detection, using 2-AB labeling (20). The authors reported separation of the core-fucosylated isomers, which differed from one another in terms of bonding linkages, such as α(1,6)G1F and α(1,3)G1F (Figure 3). Baseline separation of the Man6 and Man7 could not be achieved using this method, because they were partially co-eluted with the G1F and G2F. Additionally, these two mannose species were found in very low abundance, as compared to Man5, which further contributed to the suppression of the signal that prevented accurate quantification of these species. With the introduction of newer tags, such as Rapi-Fluor-MS (as above), significant improvements in the detection of the glycan species have been made. This is evident from the increased number of glycan species (14 vs. 9) that were detected with Rapi-Fluor-MS label, when compared to 2-AB based labeling (23). The use of Rapi-Fluor-MS labels, therefore, presents avenues for improvement in glycan analysis. It offers an increased number of glycans that can be detected, a precise separation of Man 6 and Man 7, which otherwise cannot be achieved with a 2-AB based label. It also provides an improved amenability to coupling with MS for detection, due to compatibility of the mobile phase used for separation. Both HILIC-FL and HILIC-MS exhibit comparable sensitivity of detection. However, the formation of adduct or multiply charged ions for higher glycans can cause a reduction in signal intensities. This then needs to be taken into consideration when employing HILIC-MS for direct quantification of glycans.


Figure 3: Comparison of the fluorescence chromatogram of the HILIC separation of Rapi-Fluor-MS labeled N-glycans of two commercial mAbs (a) and (b), and (c) the corresponding extracted mass chromatogram of α1,3- and α1,6-G1F isomers (968.8932 m/z). Adapted from reference (20).
The sample preparation for separation of glycopeptides by HILIC involves a typical workflow, as employed for a standard tryptic digestion. This usually involves protein denaturation, disulfide bond reduction, alkylation, and, finally, enzymatic digestion (24). While reversed-phase HPLC is considered to be the standard technique for peptide mapping applications, HILIC-based separations of glycans, using wide pore columns (>300 Å), have been reported to result in complete separation of glycosylated peptides (eluted later), from the non-glycosylated ones (eluted earlier) (23). In addition, the relative quantitation data, calculated using glycopeptide-based analysis, was found to be in agreement with the data obtained using released glycan based methodology. A key to successful analysis at the glycopeptide level is to ensure that peptides generated after digestion are not too long. As such, they would contain multiple glycosylation sites, which would be difficult to discern otherwise. The use of multiple enzymes, such as Glu-C and Asp-N, in addition to trypsin, would overcome this challenge (25).
The HILIC characterization of mAbs at intact levels is somewhat limited by problems arising from precipitation, often due to the high percentage of acetonitrile used during the initial gradient conditions (26). Efforts to dilute the samples with aqueous solutions, to overcome this issue, have resulted in poor retention and peak shapes (26). Nevertheless, this characteristic makes HILIC a suitable method for the analysis of hydrophobic proteins, such as lipoproteins (27).
Reversed-Phase High Performance Liquid Chromatography
Reversed-phase HPLC offers robustness, reproducibility, and the ability to separate a wide range of analytes (28). In contrast to HILIC, reversed-phase HPLC does not have a limitation on the injection volume of aqueous samples (8). In addition, the use of a relatively weaker, organic buffer, enhances the compatibility of this separation mode with MS (29).
As with HILIC, glycan analysis using reversed-phase HPLC requires a derivatization with 2-aminobenzoic acid (2-AA)/2-aminobenzamide (2-AB) or 8-aminonaphthalene-1,3,6-trisulfonic acid (ANTS), so as to ensure that the hydrophobicity required for retention on reversed-phase columns is achieved (30–33). Due to relatively earlier elution of acidic glycans, reversed-phase HPLC is not suitable for quantification and detection of sialic acid–containing glycans (32). Although the use of ion-pairing reagents, such as diethyl amine, instead of the more usual trifluoracetic acid or formic acid, improves the retention of the sialylated glycans and their isomers, this results in a decreased MS sensitivity, due to the usual ion suppression caused by amines (34). In terms of performance, 2-AA outperforms 2-AB in terms of retention, due to its ability to impart greater hydrophobicity than the latter, and because of its improved selectivity, due to its ability to clearly separate α1,3- and α1,6-G1F forms (31). In addition, the 2-AA based labeling strategy causes a satisfactory separation of the highly branched glycans, now containing terminal sialic acid, with or without core fucosylation. A good correlation has been observed when quantifying relative amounts of 2-AA labeled glycans using both FL- and MS-based methods, thus making it suitable for detection with both of these techniques to obtain supplementary information during analysis (31).
A number of reports employing MS to detect and quantify multiple attributes of mAbs, including glycan profiles, are performed using reversed-phase HPLC–based peptide mapping (35–37). These methods are often referred to as multi-attribute methods (MAMs) that yield both qualitative and quantitative information about the number of PTMs, terminal variants, and degradation products (37). However, a challenge of using reversed-phase HPLC–MS for glycan analysis is the potential to generate artificial alterations in glycoforms. This may result from the nature of the particular instrumental conditions necessary for ionization and sample storage conditions (38). For instance, under normal operating conditions, capillary temperatures in the range of 200 to 300 ºC and tube lens voltages exceeding 100V are generally used. It has been observed that, under different instrumentation sources and MS conditions, the relative abundances of the glycoforms with terminal GlcNAc, changed, even for the same amounts of sample injected. For instance, Fc G0F-N abundance varied between ~2 to 16% for different values of the capillary temperature and lens voltages (38). The varying levels of the glycoforms was attributed to in-source decay (ISD), resulting in the loss of terminal GlcNAc from G0F. To a lesser extent (<10%), sialic acid has been observed to undergo ISD. For sialic acid–containing glycans, a tryptic digestion quenching pH of 5 and storage at –20 ºC, is generally recommended (38).
For analysis at the intact protein and subunit levels, reversed-phase HPLC is considered fast and convenient (39). Despite this, issues of sample adsorption and low recovery of mAbs and other large proteins are some of the known impediments to employing reversed-phase HPLC for their routine analysis (40). A large number of factors, such as the mAb isoelectric point, molar mass, and hydrophobicity, may all impact the adsorption on reversed-phase columns (40). To minimize this, and to improve peak resolution and recovery, higher column temperatures of about 70 to 80 ºC are generally employed (41). However, at such extreme temperatures, the risk of sialic acid loss increases dramatically.
Charge-Based Separation Methods
Because carbohydrates are weak acids (pKa> 11), they are retained on a strong anion exchange column (pH>13). Therefore, they can be separated using high-performance anion exchange chromatography (HPAEC)(42). Weak anion exchange chromatography (WAX-HPLC), can also be used to separate N- and O- glycans, but only on the basis of their negative charge and the number of sialic acid residues present (43). This method is particularly well suited for underivatized glycans, as the detection is done by pulsed amperometric detection (PAD), which is based on measuring the current generated by oxidation or reduction reactions on the electrode surface (42). The detection is highly sensitive, and direct concentrations of oligosaccharides can be measured by comparing it with the calibration curve of the proper reference compounds. However, only relative quantitation is possible, because of a general lack of reference compounds for generating calibration curves (44). With the right reference standard, absolute quantitation then becomes very possible.
In comparison to all other methods, capillary electrophoresis (CE) has the distinction of high speed and the requirement of very low sample volumes (~nanoliter range) for analysis (45). However, coupling of CE to MS is nontrivial, due to low flow rates and the high conductivity of the background electrolytes used for the analysis (46). A number of interfaces, including sheath flow and sheathless interfaces, have been developed that overcome these bottlenecks. All of this now provides avenues for using CE interfaced with MS for glycan analysis with reasonable success (46).
Because CE is a charge based separation method, often sialic acid containing glycans are targeted for their comprehensive characterization (47,48). As with usual workflows, released glycans are generally derivatized for CE–MS analysis. In one such application, released glycans were derivatized using flourenylmethyloxycarbonyl group (Fmoc) and subjected to CE–MS analysis (49). Although the separation of the glycans was accomplished in 15 to 20 min, owing to other steps, such as capillary preconditioning and wash steps, the whole procedure took approximately 5 h for completion. In this method, sialylated N-glycans were eluted in the order of increasing number of sialic acid residues, when using a bare fused silica capillary and background electrolyte (BGE) at pH 6.8 (49).
CE–MS has also been used for the characterization of glycans at glycopeptide levels. CE–MS data were found to be in agreement for determining relatively abundant glycoforms, such as G0F or G1F. These usually constitute >70% of the total glycoforms in almost all the approved commercial mAb therapeutics (50). In contrast, higher levels of deviation were observed for minor glycan species. In addition, instances of ISD in CE–MS have been reported for branched glycan species, evident from the elevated levels of mono-antennary glycan species (resulting from ISD of branched glycans) vis-à-vis the levels obtained in HILIC-fluorescence. However, there was no discrepancy in the levels noted for the biantennary glycan, nor were there cases of reduction in charge, confirming that ISD does not bring about quantitation errors while analyzing branched glycans using CE–MS (51).
At the intact and subunit levels, CE–MS finds ample application for glycan characterization (52). In addition, CE–MS is very sensitive to C-terminal heterogeneity, as observed in mAbs, such as lysine loss or other PTMs, leading to charge variation, such as deamidation or succinimide formation (47). As was the case with reversed-phase HPLC based intact protein analysis, a major bottleneck with the similar analysis using CE–MS is the adsorption of the mAbs onto the fused-silica capillary walls, due to electrostatic interactions (53). Multiple strategies employing static and dynamic coatings, effectively aiming to minimize electroosmotic flow (EOF), have been employed to overcome this hurdle (54–56).
Conclusions
With the rapidly increasing use of mAbs for clinical use, there is a growing demand for fast, efficient, and reliable analytical techniques for comprehensive glycosylation analysis. Existing evidence shows that glycosylation in mAbs impacts their biological activity, physicochemical properties, and effector functions. Even small changes in linkage, position, or site occupancy of glycans can adversely influence the effectiveness of the products. Yet, the hallmark of mAb N-glycosylation is extensive heterogeneity, associated with each glycosylation site. In view of this, employment of appropriate glyco-analytical tools is necessary for the efficient development of both originator products and biosimilars. As reviewed in this paper, advances in separation methods and MS have allowed for the comprehensive profiling of the inherent micro- and macro- glycan heterogeneities. This is all in addition to obtaining branching and glycan sequence information. HILIC continues to be at the forefront of accurate quantification of released glycans. Reversed-phase HPLC–based MAM methods are providing a wealth of information, and have the potential to replace a battery of traditional quality control assays. CE–MS offers significant potential for analysis of acidic glycans but requires further improvements with respect to CE–MS interfacing, as well as the design and development of capillaries to achieve minimal surface adsorption. The next decade is likely to continue witnessing advancements in the characterizations of glycan structural heterogeneities in protein therapeutics.
References
- A. Guerra, M. von Stosch, and J. Glassey, Crit. Rev. Biotechnol. 39, 289–305 (2019).
- R. Dana, J. Adv. Pharm. Educ. Res. 8, 89 (2018).
- A. S. Rathore and S. K. Singh, Protein Therapeutics 21, 41–67 (2016).
- A. Eon-Duval, H. Broly, and R. Gleixner, Biotechnol. Prog.28, 608–622 (2012).
- H. Liu, G. Gaza-bulseco, D. Faldu, C. Chumsae, and J. Sun, J. of Pharma Sci.97, 2426–2447 (2008).
- G. Narula, V. Hebbi, S. K. Singh, A. S. Rathore, and I. S. Krull, LCGC North Am.29, 385-392 (2016).
- D. R. Burton and R.A. Dwek, Science 313, 627–628 (2006).
- X. Yang and M. G. Bartlett, J. Chromatogr. B1120, 29–40 (2019).
- A. Staub, D. Guillarme, J. Schappler, J.-L. Veuthey, and S. Rudaz, J. Pharm. Biomed. Anal.55, 810–822 (2011).
- F. Füssl, A. Trappe, K. Cook, K. Scheffler, O. Fitzgerald, and J. Bones, MAbs11, 116–128 (2019).
- M. Szigeti, C. Lew, K. Roby, and A. Guttman, J. Lab. Autom.21, 281–286 (2016)
- K. Alagesan, H. Hinneburg, P. H. Seeberger, D. V. Silva, and D. Kolarich, bioRxiv 676288 (2019).
- P. Liu, X. Zhu, W .Wu,, R. Ludwig, H. Song, R. Li, J. Zhou, L. ao, and A.M. Leone, Rapid Commun. Mass Spectrom.33, 31–40 (2019).
- A. Beck, E. Wagner-Rousset, D. Ayoub, A. Van Dorsselaer, and S. Sanglier-Cianferani, Anal. Chem.85, 715–736 (2012).
- W. Morelle, V. Faid, F. Chirat, and J.-C. Michalski, Glycomics,534, 3–21 (2009).
- A.H. Merry, D.C. Neville, L. Royle, B. Matthews, D.J. Harvey, R.A.Dwek, and P.M. Rudd, Anal. Biochem. 304, 91–99 (2002).
- T.P. Patel and R.B. Parekh, Methods Enzymology 230, 57–66 (1994).
- L.R. Ruhaak, G. Zauner, C. Huhn, C. Bruggink, A.M. Deelder, and M.Wuhrer, Anal. Bioanal. Chem.397, 3457–3481 (2010).
- M.S. Lim, M.K. So, C.S. Lim, J.W. Kim, J. Woo, and B.J. Ko, Talanta198, 105–110 (2019).
- M. Melmer, T. Stangler, M. Schiefermeier, W. Brunner, H. Toll, A. Rupprechter, W. Lindner, and A. Premstaller, Anal. Bioanal. Chem. 398, 905–914 (2010).
- M. Wuhrer, A.R. de Boer, and A. M. Deelder, Mass Spectrom. Rev.28, 192–206 (2009).
- K. Deguchi, T. Keira, K. Yamada, H. Ito, Y. Takegawa, H. Nakagawa, and S.I. Nishimura, J. Chromatogr. A1189, 169–174 (2008).
- E. Largy, F. Cantais, G. Van Vyncht, A. Beck, and A. Delobel, J. Chromatogr. A1498, 128–146 (2017).
- E. Ezan, M. Dubois, and F. Becher, Analyst 134, 825–834 (2009).
- W. Ni, M. Lin, P. Salinas, P. Savickas, S.L. Wu, and B.L. Karger, J. Am. Soc. Mass Spectrom.24, 125–133 (2013).
- V. D’Atri, E. Dumont, I. Vandenheede, D. Guillarme, P. Sandra, and K. Sandra, LCGC Europe30, 424-434 (2017).
- T. Tetaz, S. Detzner, A. Friedlein, B. Molitor, and J.-L. Mary, J. Chromatogr. A1218, 5892–5896 (2011).
- M.T.W. Hearn, HPLC of Proteins, Peptides, and Polynucleotides: Contemporary Topics and Applications (Wiley-VCH, New York, New York, 1991).
- D.V McCalley, J. Chromatogr. A 987, 17–28 (2003).
- L.A. Gennaro, D.J. Harvey, and P. Vouros, Rapid Commun. Mass Spectrom.17, 1528–1534 (2003).
- F. Higel, U. Demelbauer, A. Seidl, W. Friess, and F. Sörgel, Anal. Bioanal. Chem.405, 2481–2493 (2013).
- X. Chen and G.C. Flynn, Anal. Biochem.370, 147–161 (2007).â©
- B.D. Prater, H.M. Connelly, Q. Qin, and S.L. Cockrill, Anal. Biochem. 385, 69–79 (2009).
- M. Melmer, T. Stangler, A. Premstaller, and W. Lindner, J. Chromatogr. A1218, 118–123 (2011).
- C.H. Duke and T. Rebecca, BioPharm Int.28, 59-64 (2015).
- Y. Zhang and J. Guo, Bioanalysis 9, 499-502 (2017).
- R.S. Rogers, M. Abernathy, D.D. Richardson, J.C. Rouse, J.B. Sperry, P. Swann, J. Wypych, C. Yu, L. Zang, and R. Deshpande, AAPS J.20, 1-8 (2018).
- B. Shah, X. G. Jiang, L. Chen, and Z. Zhang, J. Am. Soc. Mass Spectrom. 25, 999–1011 (2014).
- T.M. Dillon, P.V. Bondarenko, D.S. Rehder, G.D. Pipes, G.R. Kleemann, and M.S. Ricci, J. Chromatogr. A 1120, 112–120 (2006).
- S. Fekete, A. Beck, E. Wagner, K. Vuignier, and D. Guillarme, J. Sep. Sci.38, 1–8 (2015).
- T.M. Dillon, P.V Bondarenko, and M.S. Ricci, J. Chromatogr. A1053, 299–305 (2004).
- M.J. Davies and E.F. Hounsell, Glycoanalysis Protocols76, 79–100 (1998)
- L. Royle, C.M. Radcliffe, R.A. Dwek, and P.M. Rudd, Glycobiol. Protocols347, 125–143 (2006).
- C. Ma, Z. Sun, C. Chen, L. Zhang, and S. Zhu, Food Chem.145, 784–788 (2014).
- Y. Huang, C. Huang, C. Hu, and H. Chang, Electrophoresis27, 3503–3522 (2006).
- S.K. Singh, V. Hebbi, A.S. Rathore, and I.S. Krull, LCGC North Am. 34, 720–728 (2016).
- Y.N. François, M. Biacchi, N. Said, C. Renard, A. Beck, R. Gahoual, and E. Leize-Wagner, Anal. Chim. Acta908, 168–176 (2016).
- E. Watson and F. Yao, Anal. Biochem. 210, 389–393 (1993).
- M. Nakano, D. Higo, E. Arai, T. Nakagawa, K. Kakehi, N. Taniguchi, and A. Kondo, Glycobiology19, 135–143 (2008).
- J. Giorgetti, V. D’atri, J. Canonge, A. Lechner, D. Guillarme, O. Colas, E. Wagner-Rousset, A. Beck, E. Leize-Wagner, and Y.N. François, Talanta 178, 530–537 (2018).
- D. Reusch, M. Haberger, B. Maier, M. Maier, R. Kloseck, B. Zimmermann, M. Hook, Z. Szabo, S. Tep, J. Wegstein, and N. Alt, MAbs7, 167–179 (2015).
- R. Haselberg, G.J. de Jong, and G.W. Somsen, J. Chromatogr. A1159, 81–109 (2007).
- H. Stutz, Electrophoresis 30, 2032–2061 (2009).
- R. Haselberg, V. Brinks, A. Hawe, G.J. De Jong, and G.W. Somsen, Anal. Bioanal. Chem.400, 295–303 (2011).
- J.R. Catai, H.A. Tervahauta, G.J. de Jong, and G.W. Somsen, J. Chromatogr. A1083, 185–192 (2005).
- R. Haselberg, G.J. De Jong, and G.W. Somsen, Anal. Chim. Acta678, 128–134 (2010).


Anurag S. Rathore is a professor in the Department of Chemical Engineering at the Indian Institute of Technology in Delhi, India.


Ira S. Krull is a Professor Emeritus with the Department of Chemistry and Chemical Biology at Northeastern University in Boston, Massachusetts, and a member of LCGC’s editorial advisory board.


Niharika Budholiya is a Senior Research Fellow in the Department of Chemical Engineering at IIT Delhi, India.