Tips & Tricks GPC/SEC: Cumulative Distributions and Cumulative Match Calibration
How to create a calibration curve when no chemically-matching reference materials with narrow molar mass distribution are available.

aperturesound/stock.adobe.com

Typically calibration in GPC/SEC is accomplished using narrowly distributed standards of known molar masses yielding relative molar masses for the analytes. If narrowly distributed standards having the same chemical structure as the analyte are not available, the use of broad standards for calibration is a cost-effective and easy-to-use alternative to molar mass sensitive detection. This instalment of Tips & Tricks describes the cumulative match calibration in more detail.
Size-exclusion chromatography (SEC), also referred to as gel permeation chromatography (GPC), is the method of choice for molar mass determination in research and development (R&D) and quality control (QC) laboratories. The simplicity of GPC/SEC and the detailed information it provides makes it the workhorse for molar mass characterization of macromolecules. Unlike other methods of molar mass determination, GPC/SEC does not only provide molar mass averages but allows determination of the complete molar mass distribution.
However, GPC/SEC separates by the size of the molecules in solution and not by molar mass. It therefore requires calibration, which is typically accomplished using narrowly distributed standards of known molar masses. If the chemical structure of the calibrants deviates from that of the analyte, the molar masses derived are only relative to the calibration standards applied.
If true molar masses are required, for example for registration, kinetics or research, relative molar masses are often not acceptable. GPC/SEC with expensive additional detectors, such as online light scattering (LS) or viscometry detectors, might be applied to obtain accurate results. However, apart from methodological challenges with such instrumentation, availability of such instrumentation and qualified personnel is not given in every laboratory. Therefore, affordable and easy‑to‑use alternatives to narrow standard calibration are often sought. Methods to overcome the calibration problem for those applications where no narrowly distributed standards are commercially available have been recently reviewed (1). A method that was of particular interest to many readers, was the cumulative match calibration, which is discussed in this instalment of “Tips & Tricks GPC/SEC” in more detail.
Cumulative Distributions
Distribution functions of properties are normalized mathematical functions that indicate the proportions of the variable property values. Distributions can be represented as differential or integral (cumulative) distributions.
For macromolecules, one of the most important molecular properties is the molar mass. Typically, molar mass distributions in GPC/SEC are graphically reported as differential and cumulative molar mass distributions, w(M) and Cum(M), respectively. The former usually presents a more or less bell-shaped curve, the second is a monotonic increasing function resembling the form of the error function (Figure 1).


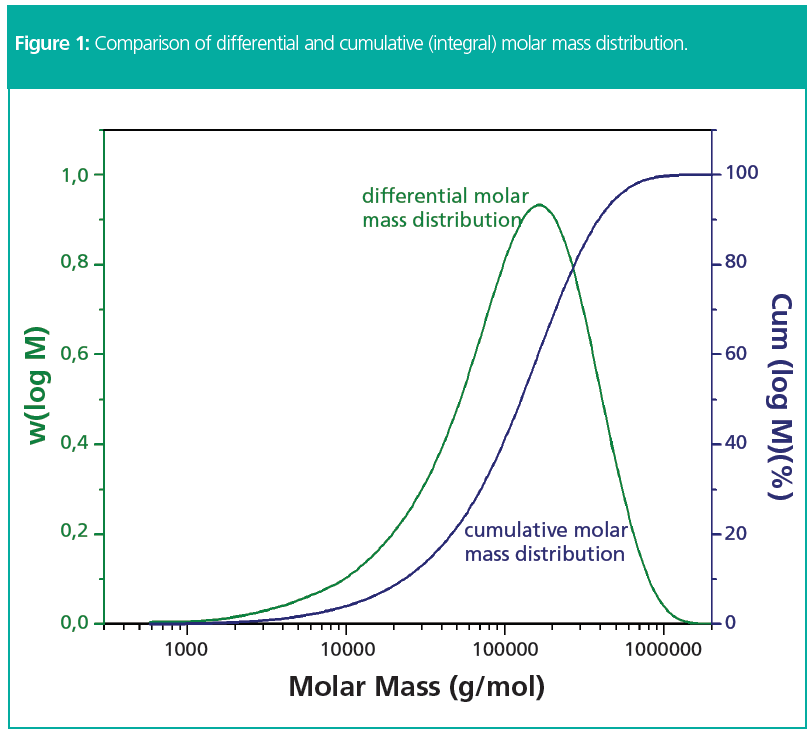
The total area below the differential distribution curve represents 100% of the mass of the sample. The area fraction from molar mass zero to a molar mass M therefore represents the fraction of all chains having a molar mass lower than M.
By plotting the area fraction as a function of molar mass, M, the cumulative or integral molar mass distribution Cum(M) is obtained. Usually, the cumulative distribution is normalized to 100%.
Thus, the cumulative distribution describes the weight fraction of all chains having a molar mass lower than M.


Though the cumulative distribution is usually shown graphically, it can easily be provided as a numeric table of data pairs M, Cum(M).
Cumulative Match (Integral) Calibration
Cumulative match calibration utilizes at least one broadly distributed reference sample of known cumulative distribution (a table of data pairs with M and Cum(M) having the same chemical structure as the sample to be analyzed.
To assign a molar mass to an elution volume, the reference sample is run on the column combination to be calibrated, to obtain the respective chromatogram, S(V).
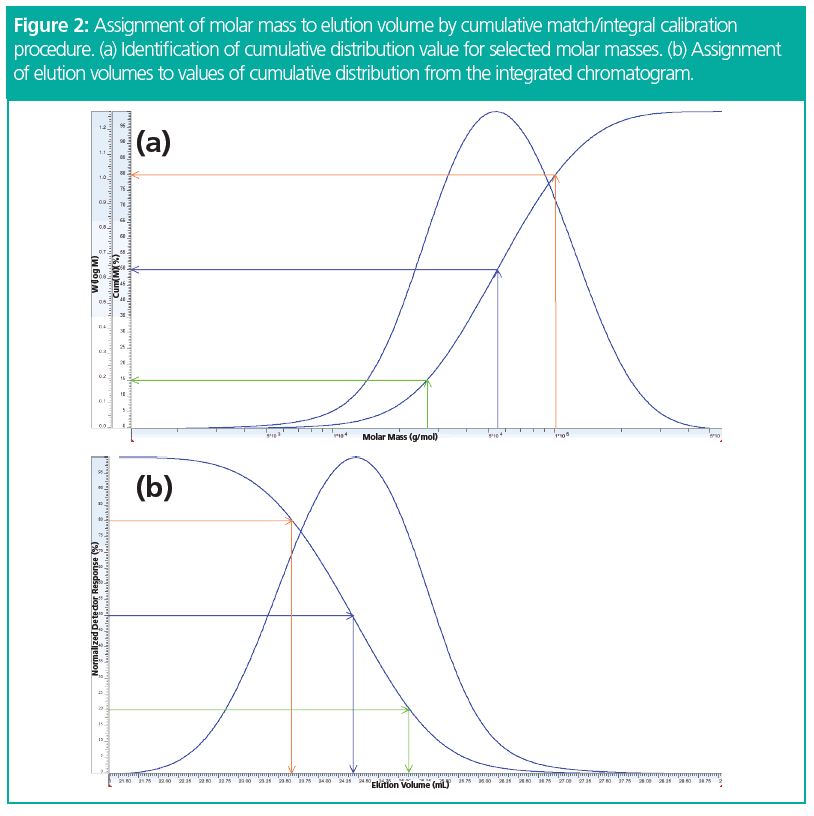
Because in GPC/SEC large chains elute first, followed by the lower molar mass chains, while molar mass distributions are usually plotted from low to high molar masses, the differential molar mass distribution at first glimpse looks like a mirrored chromatogram (Figure 2). However, this first impression is not completely correct because the chromatogram comprises both system- and sample‑related information, while a true molar mass distribution only reflects sample properties (2).


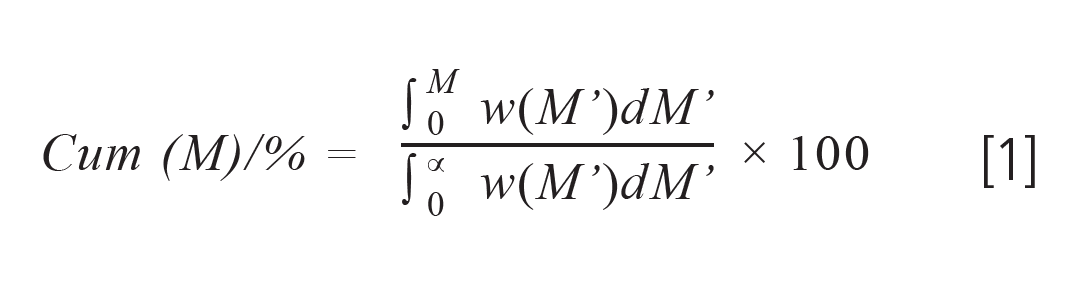
The total area below the chromatogram represents the complete sample mass injected. Macromolecules having a molar mass lower than M will elute at elution volumes larger than V(M). Consequently, the weight fraction of material having a molar mass lower than M is given by:

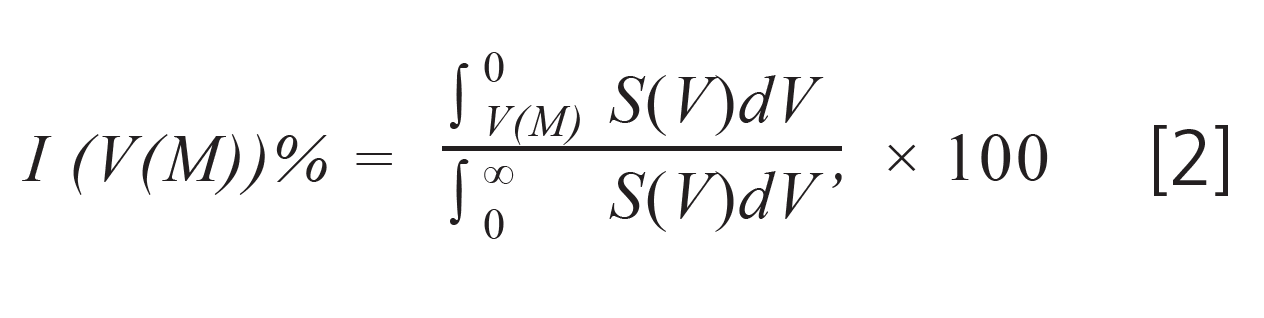

Since the weight fraction of material having a molar mass below M must equal the weight fraction of materials eluting later than V(M) we have:

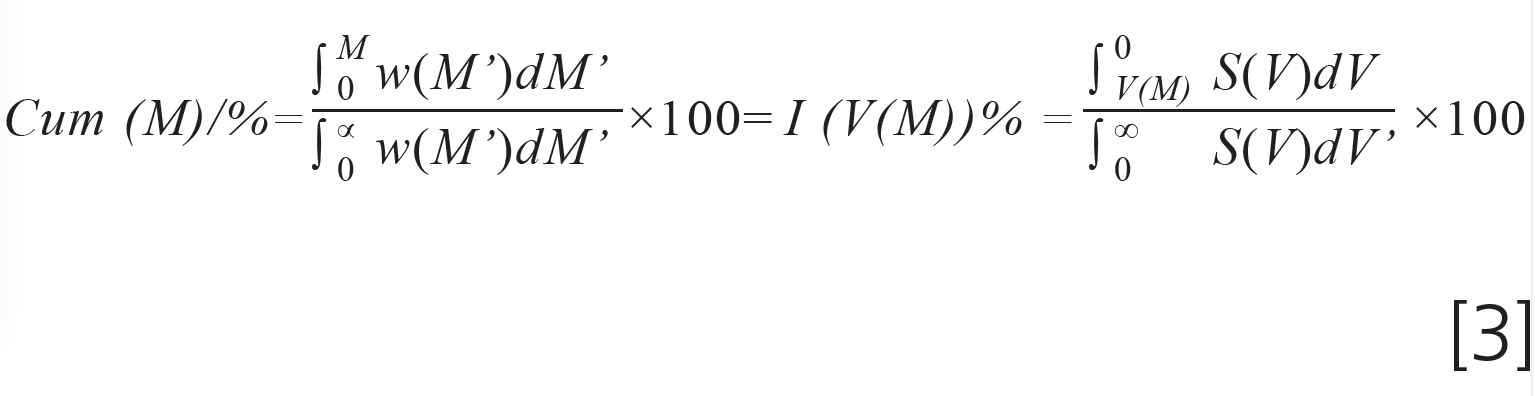

The equation assigns a molar mass M to an elution volume V(M).
In a graphical sense, one has to normalize the chromatogram and the molar mass distribution of the reference material to 100%. Afterwards one selects a molar mass from the distribution and determines the corresponding value of the cumulative distribution, Cum(M) (Figure 2[a]). In the next step one needs to identify the obtained value of Cum(M) from the integrated chromatogram I(V) and assigns the corresponding elution volume (Figure 2[b]) to the molar mass selected before.
By assigning elution volumes in that way for a series of different molar masses from the distribution of the reference material, a number of data points V(M) are obtained, which then are fitted in the same way as when running narrowly distributed standards (Figure 4).
Such manual assignment of molar masses to elution volumes by cumulative match calibration is not difficult, but tedious. Fortunately, modern GPC/SEC software allows assigning a cumulative calibration table from a file to a chromatogram and automatically performing the required assignments for a large number of molar masses in a user-friendly way.
How to Obtain Reference Material for Cumulative Match (Integral) Calibration
One example for cumulative match calibration is the characterization of low molar mass heparins according to United States Pharmacopeia (USP). USP provides the required reference materials with tabulated cumulative molar mass distribution.
However, if suitable reference materials for cumulative match calibration are not commercially available, they can be created relatively easily for a particular application. An older, but tedious approach is fractionation by either using preparative GPC/SEC columns or by solvent/non-solvent precipitation, followed by molar mass determination for each fraction. Today, utilizing GPC/SEC with advanced detection methods, such as light scattering or viscometry, presents a much more convenient method to determine the cumulative distribution for a reference material. Such analysis can be provided by appropriate contract laboratories.
Requirements and Limitations
A prerequisite for a sample intended to become a reference material for cumulative match calibration is its long-term stability.
Ideally the reference sample covers a wide molar mass range and shows a uniform distribution with just one maximum.
The cumulative match or integral calibration curve is valid only for samples covering a molar mass range within that of the broadly distributed reference material. The problem of an insufficient coverage of the molar mass range for own samples can be overcome by applying several reference materials for cumulative match calibration, which differ in the ranges covered by their molar mass distributions.
To overcome the influence of column dispersion, baseline quality, and choice of baseline and integration limits (3) on the data points at the extreme low and high weight fractions, it is recommended to concentrate on the range between approximately 2% and 98% of the cumulative distribution.
The influence of baseline quality and the choice of the limits can be further reduced by creating the calibration curve from the combined data of several injections of the same reference material.
Application Example
For the molecular weight determination, according to the Heparin Sodium monograph, the USP provides reference material together with a Certificate of Analysis (CoA). This CoA contains a table of “MW” and “% below MW” information, that is, the cumulative distribution required to perform a cumulative match calibration.
This Heparin Sodium Molecular Weight Calibrant is first injected onto the column(s) to be calibrated.


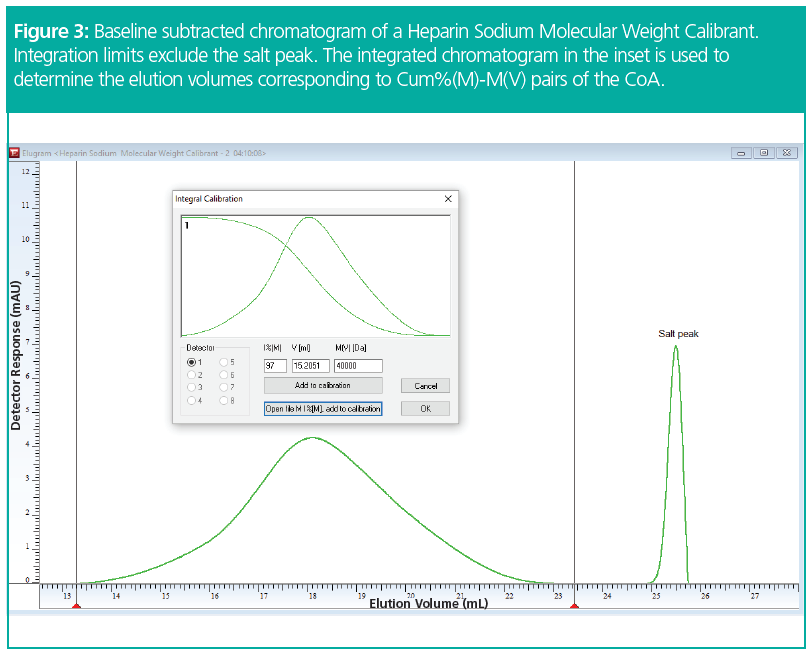
Figure 3 shows the chromatogram with subtracted baseline and integration limits set to exclude the typical salt peak. The integrated chromatogram is readily available. The inset shows only the sample peak overlaid with the integrated chromatogram starting at 100% at low elution volumes and decreasing to 0% at high elution volumes. In the example a value for Cum%(M) of 97% was entered for a molar mass of 40 kg/mol, as provided in the CoA table. The software automatically determines the corresponding elution volume (15.205 mL). Cum%(M) and the molar mass can either be entered manually or loaded from a file. By performing the assignment for molar masses, between 6 and 40 kg/mol, the elution range of approximately 15 mL to 21 mL can be calibrated (Figure 4).

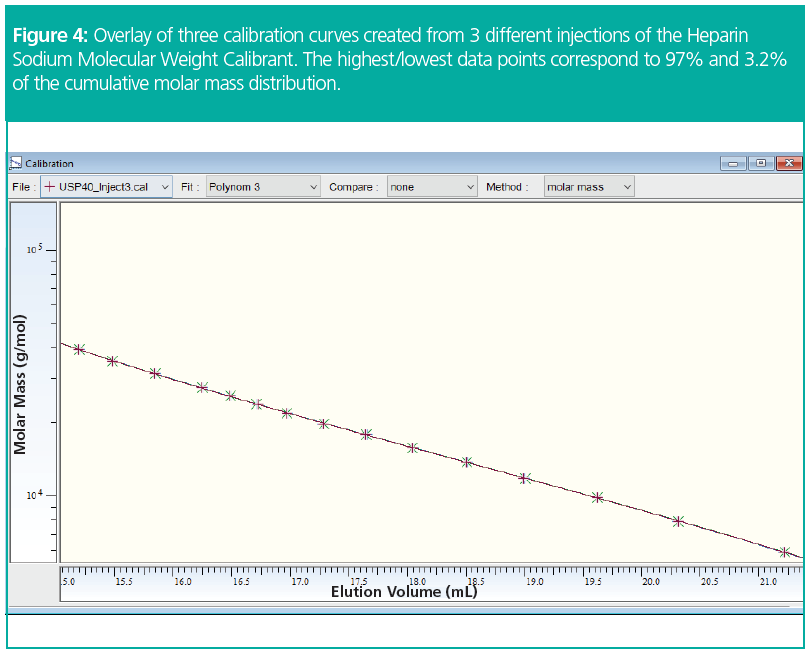

Figure 4 shows an overlay of three calibration curves created from three independent injections of the Heparin Sodium Molecular Weight Calibrant. All data have been fitted with a polynomial function of the third order. Only small deviations between the resulting calibration curves are observed. The influence of the baseline quality and the baseline and integration limits on the final result of heparin samples can be further reduced by working with a combined calibration curve comprising the data of all three injections.
Conclusions
- GPC/SEC requires calibration for molar mass determination. The molar masses derived by GPC/SEC are molar masses relative to the calibration standards applied.
- Cumulative match or integral calibration is a technique which allows the creation of a calibration curve when no chemically matching reference materials with narrow molar mass distribution are available.
- Cumulative match or integral calibration allows the determination of accurate molar masses with low‑cost single detector equipment, which does not require extensive method and data analysis training.
References
- W. Radke and D. Held, The Column 16(11), 33–36 (2020).
- D. Held and P. Kliz, The Column 3(8), To Be Confirmed (2007).
- T.D. Swartz, D.D. Bly, and A.S. Edwards, J. Appl. Polym. Sci. 16(12), 3353–3360 (1972).
Daniela Held studied polymer chemistry in Mainz, Germany, and works in the PSS software and instrument department. She is also responsible for education and customer training.
Wolfgang Radke studied polymer chemistry in Mainz and Amherst, Massachusetts, USA, and is head of the PSS application development department. He is also responsible for instrument evaluation and for customized training.


HPLC Columns")


 Xolair technical development team leader from Phase 2 through licensing. Reed is a CASSS Distinguished Fellow and has been an author of 49 publications, including 14 as corresponding author. He was a leader in the development of Roche-Genentech’s strategies for post-approval comparability exercises, clinical and commercial specifications, the identification of critical quality attributes, linking structure to function, the use of a risk-based Quality by Design approach for control strategy development, unexpected protein modification identification, and curiosity-based thinking.")


