The Top 10 HPLC and UHPLC Column Myths
LCGC North America

Evidence to demystify HPLC and UHPLC column myths
Webster's New Collegiate Dictionary defines a myth as "an ill-founded belief held uncritically, especially by an interested group." Could that group be misinformed chromatographers? This installment of "Column Watch" will look at the top 10 high performance liquid chromatography (HPLC) column myths and attempt to demystify them by presenting some evidence that they are untrue. Since ultrahigh-pressure liquid chromatography (UHPLC) has come about, new myths are popping up and these shall also be dealt with here.
In any field there are often "misconceptions" or "myths" that are perpetuated and passed on to the next generation. These myths are often driven by a lack of understanding by practitioners of the real issues. And these myths can change as time moves on. Originally, seven years ago, in a "Column Watch" installment (1), the 10 most popular myths of the time around high performance liquid chromatography (HPLC) column technology were demystified by discussing the issues at hand. Because HPLC is approaching its 50th year, many column myths have already been passed down to two generations of liquid chromatographers. Recently, ultrahigh-pressure liquid chromatography (UHPLC) has come into its own and a new set of myths are arising. The purpose of this installment of "Column Watch" is to revisit and update readers on the most popular column myths of today and try to dispel some of these myths before they get perpetuated. This column is an adaptation of an oral presentation at HPLC 2013 in Amsterdam, The Netherlands (2). In keeping with the "countdown theme," I will start with number 10 and work my way to the top myth.
Myth 10: Air Will Kill an HPLC Column
False: HPLC and UHPLC columns are shipped with plugs of either stainless steel or polymeric construction installed at both end. Users are told that a column should always be capped tightly after the column is disconnected from the instrument. The thought is that large amounts of air can get inside the column, perhaps damaging the packing material, causing bubbles in the detector flow cell when installed into the HPLC system in the future, and maybe disrupting the packed-bed morphology. First, one should realize that the tiny hole in the endfitting is less than 0.02 in. in diameter and thus has an extremely small cross-sectional area. If left open the small amount of air that diffuses into the column could hardly cause irreparable damage. Depending on the volatility of the solvent used to store the column, there could be some evaporation near the end of the column. But large quantities of air would have a hard time diffusing through the microparticles in the packed bed seeing that we need thousands of pounds per square inch of pressure to push liquid mobile phases through these micrometer-sized particles. The small amount of air that could conceivably enter into the ends of the column would be immediately dissolved once the system was pressurized or, at least be flushed out in the initial pressurization in a short time and should not cause any problems with the chromatography later on. However, if you would feel more secure by capping the endfittings by all means do so.
Myth 9: All C18 (L1) Columns Are the Same
False: All of our HPLC column surveys have shown that C18 is, by far, the most popular bonded phase in existence (3). Because the pharmaceutical manufacturers were the earliest adopters of HPLC, the United States Pharmacopeial Convention (USP), not wanting to favor any particular manufacturer of HPLC columns, developed a classification system that gave a generic description for each type of bonded phase column that was submitted under a new drug application. For HPLC columns, an "L" designation was given, and because C18 is used for a majority of submittals, its designation was "L1." As additional phases came along, they were given their own "L" number such as C8 (L7), CN (L10), phenyl (L11), and so on. The implication with this system was that each C18 column that was submitted also designated as L1, was the same as the last L1 column. Unfortunately, this system proved to be unreliable because columns from different manufacturers, produced from different base silicas and bonded with different silane reagents using different synthetic routes, chromatographically were not the same and therefore one could not be substituted for another. With more than 800 different L1 columns introduced into the marketplace, it has proven to be a confusing system. Several approaches, including the use of the hydrophobic subtraction model (4,5) that gives a more detailed classification of reversed-phase columns, have been proposed but to this day the "L" classification is still in widespread use. Thus, some chromatographers who are not really into understanding the issues still believe that "all C18 columns are the same." Simple examples that this is not the case are shown in Figures 1 and 2. In Figure 1, four different C18 silica bonded phase columns are shown for the same separation under the same operating conditions; each phase provides a different chromatogram. To demonstrate that the L system also doesn't hold for other bonded phases as well, Figure 2 provides an example of three different C8 (L7) columns, one of which (Figure 2b) was very similar to the original chromatogram and could probably be substituted in an HPLC method while the third column (Figure 2c) is quite different and might even be considered as orthogonal to the first two columns. The Fs designation shown alongside each chromatogram is a numerical classification of how "close" of a fit columns are to one another (4,5). Close Fs numbers are potentially replacement columns while large values of Fs imply that the column would not be a "drop-in" replacement in a particular HPLC method and, in fact, might be a useful column when first performing method development because it offers a different selectivity to the other columns. So, the bottom line is: All C18 (L1) and other reversed phase columns are not the same.

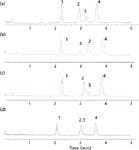
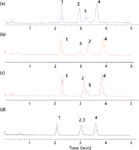
Figure 1: Chromatograms obtained using C18 bonded phases with the same base material but different chemistries: (a) Zorbax Eclipse Plus C18 (different surface treatment for same base silica, double endcapping, same bonding chemistry as Eclipse XDB-C18), (b) Zorbax StableBond SB-C18 (same base silica, sterically protected C18 phase, no endcapping), (c) Zorbax Eclipse XDB-C18 (same base silica, monomeric bonding chemistry, double endcapping), (d) Zorbax Extend-C18 (same base silica, bidentate bonding chemistry, double endcapping). Column dimensions: 50 mm à 4.6 mm, 1.8-µm dp; mobile phase: 69:31 acetonitrileâwater; flow rate: 1.5 mL/min; temperature: 30 °C; detection: single-quadrupole electrospray ionization MS, positive mode scan. Peaks: 1 = anandamide, 2 = palmitoylethanolamide, 3 = 2-arachinoylglycerol, 4 = oleoylethanolamide.
Myth 8: Never Use 100% Water with a Reversed-Phase LC Column
False: This myth came about by users who experienced a phenomenon popularly known as phase collapse of reversed-phase columns when used with low percentage of organic solvent or 100% water as a mobile phase. Phase collapse is really a misnomer since the phenomenon was better explained as phase dewetting. Phase dewetting is highly undesirable since retention times decrease and are not reproducible, peaks may become distorted and reequilibration times may be quite long. Earlier, we published two detailed papers on this subject (6,7). The phase dewetting conditions most often occur when users are trying to increase the retention of very polar compounds in reversed-phase LC by decreasing the percentage of organic solvent in the mobile phase to low values to increase the retention of these polar compounds, which have a tendency to be eluted very early in the chromatogram. Nowdays, this problem is frequently addressed by using hydrophilic interaction liquid chromatography (HILIC)

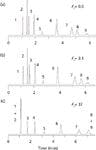
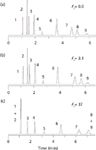
Figure 2: Separation of the same mixture on three reversed-phase columns under the same conditions: (a) Ace C8 (Advanced Chemical Technologies), (b) Precision C8 (Mac-Mod), (c) Inertsil C8 (GL Sciences). Column dimensions: 15 cm à 4.6 mm; flow rate: 2.0 mL/min; temperature: 35 °C; mobile phase: 50:50 30 mM potassium phosphate buffer (pH 2.8)âacetonitrile. Peaks: 1 = N,N-diethylacetamide, 2 = nortriptyline, 3 = 5,5-diphenylhydantoin, 4 = benzonitrile, 5 = anisole, 6 = toluene, 7 = cis-chalcone, 8 = trans-chalcone, 9 = mefenamic acid. (Courtesy of Lloyd Snyder and John Dolan, LC Resources.)
With the help of Figure 3, I will try to explain phase dewetting. Figure 3 shows two situations: situation A, when the aqueous mobile phase has a significant portion of water-soluble organic solvent, such as methanol or acetonitrile — a densely chemically bonded C18 (or other hydrophobic bonded phase) prefers to be solvated with organic solvent (for example, like-like relationship) — and situation B, when the mobile phase has a very low percentage of organic content (<10%) or even 100% water. A very simplistic visualization of phase collapse can be observed in the upper portion of Figure 3. Situation A shows the C18 bonded group being solvated with methanol and in this state the hydrophobic moieties are able to interact with the hydrophobic portions of solute molecules and provide retention. On the other hand, for the right hand side of the upper portion of Figure 3, situation B shows a C18 phase in a 100% water mobile phase. The C18 functionality prefers to be in a self-associated state (like prefers like) and folds upon itself in a collapsed state. The bottom portion of Figure 3 shows the situation as it actually happens. Because most of the interactions with an LC stationary phase occur inside the pores (rather than on the outer surface), when an organic solvent is present at higher concentrations (greater than 10%), the pores are filled with the water–organic mixture that allows the C18 bonded groups to be solvated, and everything behaves normally. However, when the solvent within a pore becomes unfriendly (for example, very low %B or 100% A), there is a tendency to force the water out of the pore, which results in a dewetting phenomenon. This dewetting doesn't occur instantaneously, but can happen over a number of column volumes as the organic solvent is leached out of the solvated bonded phase. As this is happening, the retention of organic solutes may decrease with time and retention times also decrease accordingly. Selectivity can change during this time and peak shapes can become distorted.

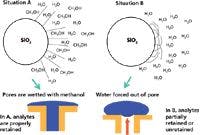

Figure 3: Phase collapse (or more correctly, phase dewetting).
Phase dewetting most often occurs with very hydrophobic, very dense chemically bonded phases. Phases that are highly endcapped with non-polar silane reagents may encourage the situation. The % organic in which dewetting may occur varies with a number of parameters including type of bonded phase, bonded phase coverage (density), pore size, and the presence and availability of residual surface silanol groups among others. Phase dewetting does not permanently damage the column and it can be recovered as described below. However, over the years, many chromatographers have been totally baffled by the presence of phase dewetting and much time has been lost trying to solve the problem of shifting retention times. Hence, they believe that one shouldn't run reversed-phase columns in highly aqueous media.
There are two approaches to overcome the phase dewetting phenomenon: subject the column to a high back pressure according to the Laplace-Young equation (see reference 6 for an example of this approach), and resolvate the stationary phase with a higher % organic in an organic–water mixture or mobile phase.
The first approach is totally inconvenient and requires a lot of experiments to get the right back pressure. The second approach is the easiest to perform because the column is already installed in the instrument and the experimental conditions can be adjusted to ensure that sufficient organic solvent is present to resolvate the phase. Of course, a third approach is to use a phase that is solvated under all mobile phase conditions (see below).
To illustrate what can happen in a phase dewetting situation, Figure 4 provides an example of the separation of procainamides on a very hydrophobic-C8 phase. The sequence of the experiments is outlined in the figure caption and will not be repeated here. Figure 4a depicts the normal isocratic separation that occurs after the stationary phase solvated with an acetonitrile-buffered water mixture. Then, the mobile phase was 90% ammonium dihydrogen phosphate buffer and 10% acetonitrile, which allowed solvation of the hydrophobic stationary phase. Next, the column was rinsed for a period of time with an aqueous buffer (no organic). The mobile phase was returned to the original conditions and the sample was reinjected. Note the greatly reduced elution times and the change in selectivity that occurred with the sample chromatogram (Figure 4b). Clearly, this separation is different from what would be expected. The water rinse caused a change in the retention characteristics of the stationary phase most likely by a phase dewetting phenomenon. Next, the column was treated with a 50:50 mixture of aqueous buffer and acetonitrile, followed by the mobile phase. Indeed, the chromatogram returned to the original one shown in Figure 4a.

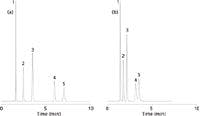
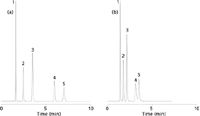
Figure 4: Inconsistent retention in a highly aqueous mobile phase as demonstrated by the separation of procainamides on a hydrophobic C18 column. Sequence of events: condition with a 50:50 mixture of phosphate buffer and acetonitrile for 15 min; run mobile phase for 5 min; inject the sample and obtain the chromatogram shown in (a); switch to 100% aqueous for 30 min; switch back to mobile phase for 5 min; inject the sample and obtain the chromatogram shown in (b); repeat the first three steps; chromatogram returns to (a). Column: 150 mm à 4.6 mm Eclipse XDB-C8; mobile phase: 90% 50 mM KH2PO4 (pH 3.5), 10% acetonitrile; flow rate: 1.0 mL/min; temperature: room temperature. Peaks: 1 = uracil, 2 = procainamide, 3 = N-acetylprocainamide, 4 = N-propionylprocainamide, 5 = caffeine.
Table I provides a list of phases that do not show the phase dewetting phenomenon. These phases all have a polar functional group of some kind close to the surface, near or on the chemically bonded phase. Polar embedded phases are among the most popular of these special phases. In this case, a polar functional group is located on the alkyl phase itself usually only a few carbon atoms removed from the silica surface. Different commercial phases utilize different embedded functional groups, the most popular being amide, urea, and carbamate. With these polar groups, the water in the mobile phase can interact and solvate the phase such that collapse or dewetting doesn't occur. Some columns have incorporated polar functional groups in other ways such as endcapping with a polar functionality (for example, diol). These phases are usually given an AQ designation. Very short chain phases (such as C2) do not show phase dewetting because they may allow residual silanol groups to hydrogen bond with the aqueous component of the mobile phase. Surprisingly, very long alkyl chain phases do not show phase dewetting, most likely because the steric requirement allow surface silanols to remain on the bonded silica; hence, water can interact with these silanols and allow surface solvation. Phases with wide pore diameters (for example, 300 Å) do not show phase dewetting because the pores are wide enough not to force water out of them, although I am not aware of any studies on the wettability of these wide-pore phases.

Table I: Phases to address the dewetting problem in reversed-phase chromatography
Figure 5 shows the use of an AQ-type phase in a situation with a low percentage of organic mobile-phase content. The sequence of experiments with this column was very similar to that shown in Figure 4. Because this phase was developed to work in mobile phases with a low percentage of organic content and 100% water, it did not undergo phase dewetting when subjected to the same conditions of the highly hydrophobic phase of Figure 4. Such phases are to be recommended for the separation of small polar compounds that are lowly retained on many reversed-phase chromatography columns.

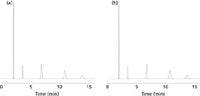
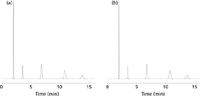
Figure 5: Consistent retention of procainamides. Sequence of events: condition with a 50:50 mixture of phosphate buffer and acetonitrile for 15 min; run mobile phase for 5 min; inject the sample and obtain the chromatogram shown in (a); switch to 100% aqueous for 30 min; switch back to mobile phase for 2 min; inject the sample and obtain the chromatogram shown in (b). Column 150 mm à 4.6 mm, 5-µm dp Zorbax SB-Aq; mobile phase: 90% 50 mM KH2PO4 (pH 3.5), 10% acetonitrile; flow rate: 1.0 mL/min; temperature: room temperature. Peaks: 1 = uracil, 2 = procainamide, 3 = N-acetylprocainamide, 4 = N-propionylprocainamide, 5 = caffeine.
Myth 7: It Takes a Minimum of 10 Column Volumes to Reequilibrate an LC Column
False: Equilibration time is very important in gradient chromatography because it is a limiting factor in the throughput of the technique. At the conclusion of gradient, the column must be returned to its original state before another injection can be made. The longer it takes for this reinstatement to occur, the longer the overall gradient run. In addition, if one takes longer to reequilibrate the column than is actually required, solvent is wasted. In modern two-dimensional liquid chromatography (2D LC×LC), the throughput is dictated by the speed of the secondary column because the flow on the primary column is not stopped during the second chromatographic step. If 10 column volumes are required instead of just a few, then the comprehensive chromatography, already a fairly slow process, is made even slower. Finally, if the reequilibration time is too short and the column has not been stabilized then repeatability of retention time, important when this parameter is used to help identify components, may be limited.
There have been a number of studies of the reequilibration times, but for the purposes of brevity, I would like to cite two of the more comprehensive ones (8,9). Schellinger, Stoll, and Carr (8) studied high-speed gradient elution in the reversed-phase liquid chromatography of neutral compounds and bases in buffered eluents with regard to retention repeatability and column reequilibration and conducted a follow-up study of full equilibrium conditions (9). There are many variables affecting the reequilibration in reversed-phase LC. In isocratic LC, there is no equilibration time at the conclusion of a chromatographic run, but there may be a considerable waiting time when changing solvent composition. In gradient LC, the eluent composition, the bonding density of the reversed-phase LC packing, the instrumental design (particularly, the gradient delay volume also known as the dwell volume), the flow rate, the use or lack of use of bonded phase additives to wet the bonded phase, and the types of solutes (ionic, ionizable, neutral) and flushing times all play a part.
I would like to summarize the major outcomes of these reequilibration studies. First, the instrument gradient delay volume, although important in the real world, must be subtracted from the total volume of the eluent passed through the column because the delay volume itself has little to do with the reequilibration time that actually occurs within the chromatography column. Earlier liquid chromatographs often had several milliliters of delay volume. The delay volume is the total volume from the point of solvent mixing to the head of the column. There are many volumes to flush out before the actual gradient reaches the column. For high-pressure mixing, the volume of the mixing tee, mixer (if present), pulse damper, pressure transducer, all the connecting tubings, injector including the loop or by-pass volume, and guard column can be substantial. For low-pressure gradient systems, the proportioning valve, inlet and outlet check valves, the pump piston chamber, and various tubing adds even more to the gradient delay volume. More recently, the newer UHPLC instruments have addressed these problems by greatly decreasing the instrumental contributions to gradient delay volume as well as extracolumn volumes.
The reequilibration study came up with several conclusions. There are two types of equilibrium: repeatable equilibrium and full equilibrium. Repeatable equilibrium means that full equilibrium may not have been achieved, but on a practical basis, if the retention time repeatability on subsequent runs is less than 0.002 min then for non-ionizable solutes in unbuffered eluents and for basic compounds using the popular trifluoroactic acid and formic acid additives, repeatable equilibrium can be achieved within two column volumes. For a non-endcapped phase, 1% (v/v) n-butanol added to the mobile phase was required to achieve rapid full equilibrium in two column volumes. For an endcapped phase, the n-butanol was not required to achieve the same.
Myth 6: Superficially Porous (Solid-Core) Particles Have a Significantly Lower Sample Loading Capacity Compared to Totally Porous Particles
False: The sample capacity of an HPLC packing material is proportional to the available surface area, which, of course, is related to the amount of bonded phase chemically attached to the available silanols through monomeric bonding. If one goes through the mathematical calculations of the volume of a 2.7-µm spherical totally porous particle (TPP) and compares the volume of a 2.7-µm superficially porous packing (SPP) with a 0.5-µm porous shell, the total volume available on the SPP particle is about 25% less than the TPP. This assumes that the porous portion of both particles has the same characteristics, which may not be the case. Nevertheless, the loss in surface volume of the SPP is nowhere near that of the pellicular packings of yesteryear in which the shell thickness was 1–2 µm and the particle size was 45–50 µm. If the surface area of the SPP is actually larger than that of the TPP, then the difference in sample capacity between the two could be less (this may be the case).
Rather than relying on mathematical estimates, experiments were actually performed on comparing the TPP and SPP with similar chromatographic conditions for basic compounds. For the basic compound dextromethorphan, successively larger concentrations were injected onto the four columns. Three of the columns were superficially porous particle columns Poroshell 120 EC-C18 (100 mm × 3.0 mm, 2.7-µm dp, Agilent Technologies); Ascentis Express C18 (100 mm × 3.0 mm, 2.7-µm dp, Sigma Aldrich/Supelco); and Kinetex C18 (100 mm × 4.6 mm, 2.6-µm dp, Phenomenex). The totally porous particle column was the Zorbax Eclipse Plus C18 (100 × 3.0 mm, 1.8-µm dp, Agilent Technologies). At the time, only a 100 mm × 4.6 mm Kinetex column was available, so adjustments were made in the experimental conditions to accommodate the different column dimensions.

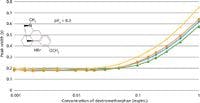
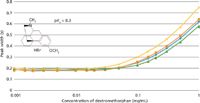
Figure 6: Sample loading of a basic compound (dextromethorphan) onto superficially porous and sub-2-µm totally porous columns. A 10% increase in peak width for the superficially porous particle columns occurs roughly at the same loading as the 1.8-µm totally porous particle column. Mobile phase: 80% 25 mM Na2HPO4 buffer (pH 3.0), 20% acetonitrile; detection: UV absorbance at 205 nm; temperature: 30 °C. Columns: blue diamonds: 100 mm à 3.0 mm, 2.7-µm dp Agilent Poroshell 120 EC-C18; orange squares: 100 mm à 3.0 mm, 2.7-µm dp Supelco Ascentis Express C18; green triangles: 100 mm à 4.6 mm, 2.6-µm dp Phenomenex Kinetex C18; yellow X’s: 100 mm à 3.0 mm, 1.8-µm dp Agilent Zorbax Eclipse Plus C18.
One definition of overload is when the sample size injected causes a 10% dropoff in efficiency (that is, or alternatively a 10% increase in peak width). One can view the results of the experiment in Figure 6, which shows a plot of the peak width vs. sample concentration injected at a constant volume. A 10% increase in peak width for the superficially porous particle columns occurred roughly at the same sample loading as for the totally porous column at a concentration value of 0.05 mg/mL indicating a comparable sample capacity for both types of columns. Interestingly, a recent similar study by Fallas and colleagues (10) came to the same conclusion. Table II is an abbreviated extract of data from their work, which shows that, for both basic and acidic compounds on the Poroshell 120 EC-C18 and the totally porous Zorbax Eclipse Plus C18 columns of the same dimensions and same conditions used, has nearly the same sample capacity. Interestingly, other superficially porous particle columns and porous particle columns were evaluated in the same study. All of them weren't very different, indicating the sample capacity of a number of porous and superficially porous particles when tested under the same conditions were essentially the same. However, with some of the newer superficially porous particles with a thinner shell thickness, there may be different sample capacities than totally porous particles of the same size.


Table II: Sample capacity for two C18 columns
Myth 5: UHPLC Packed Columns Plug More Easily Than Conventional HPLC Packed Columns
False: The continual downward movement in particle sizes for porous particles has led to some major column hardware designs. The truth is that the actual bed isn't the culprit for these pressure buildups, but more often than not it is the frit design. Many column pressure problems associated with the sub-2-µm UHPLC columns are a result of sample and mobile-phase matter lodging on the inlet frit. Why are the frits the possible problem? One must consider the particle size distribution of a typical porous particle. When a user buys a 1.8-µm column all of the particles packed inside of that column are not 1.8 µm; there is a particle size distribution (Δdp). There may be some 1.4–1.6 µm particles on the low end and 2.0–2.2 µm particles on the high end of this distribution. The manufacturer has to make sure when they pack the column that the bottom frit porosity is smaller than the smallest particle that may be in the packing particle size distribution. If not, there is the possibility that the smallest packing particles can pass through the frit or even lodge in the porous frit and cause problems later. One also must remember that the frit has its own pore distribution so manufacturers choose a frit porosity much lower, generally in the 0.3–0.5-µm region. For 3.5- and 5.0-µm columns, a 2-µm porosity frit is sufficient to hold the particles during the packing process because the smallest portion of the Δdp rarely approaches 2-µm in size. Very seldom do users complain about plugging frits on a 3.5- or a 5-µm column, unless they do something silly like injecting raw sample that may have lots of particulates.
For the sub-2-µm columns, if they are to be used for column switching or backflushed for particulate removal, the manufacturer must also install a frit on the top of equivalent porosity to the bottom frit (0.3–0.5 µm). So, if the user injects unfiltered plasma or river water samples onto this UHPLC column, there is a very good chance that the column may plug after several repeated injections. In that case, a user may try to recover the expensive column by reversing the column and attempting to flush out the particulates (see Myth 3). So the plugging problem with the UHPLC column is often not the packed bed being damaged, it is the frit being blocked.
What can be done to protect the inlet column against blockage? There are several in-line devices that can keep particulates (and even chemical contaminants which can also cause a blockage in the packed bed) out of the LC system. First, an in-line, zero-dead-volume filter can be placed between the injector and the column. These devices have replaceable 0.2–0.45 µm frits that will trap any particulates that find their way into the sample or the mobile phase. After the in-line filter becomes plugged (by evidence of rising pressure), the unit can be disassembled, the filter replaced, and, in a few minutes, the LC system is up and running. Most modern in-line filters are of very low dead volume so they shouldn't contribute any extracolumn band broadening contributions. Of course, a guard column (see Myth 4) serves to remove particulates and chemical contaminants that can damage the column. Proper sample preparation such as the use of solid-phase extraction, filtration, or centrifugation, serves to clean up the sample before injection and thereby avoid any contamination problems.
Myth 4: Guard Columns Make No Sense — In Fact, They Affect My Separation
False: There are many benefits by installing a guard column. First, the guard column protects the analytical column from chemical or particulate damage. Second, it is a lot less expensive to replace a 5-mm guard column than to replace an expensive analytical column. Modern guard column holders contribute almost no dead volume, have quickly replaceable cartridges, and are designed for the high pressures of UHPLC. After you have purchased the guard column holder, the guard column cartridges are fairly inexpensive. Figure 7 reinforces the claim that a guard column is a good idea. The accelerated lifetime test was conducted to evaluate guard column replacement frequency. A straight Similac baby formula sample was spiked with two pharmaceuticals (identified in the figure) and diluted 300:1. Unfiltered samples were placed in a vial and set up in an auto-sampler programmed to inject the sample repeatedly. In the upper portion of the figure, no guard column was used. By the 85th injection, the peak width of both pharmaceuticals had increased dramatically probably because of interactions with milk solids deposited on the column head and quantitation was no longer possible. Although there was a gradual rise in pressure, a sharp pressure build-up didn't occur as expected; perhaps at that point the column was still able to tolerate the buildup of milk solids. On the other hand, in the bottom pressure-peak width plot with a guard column installed, both pharmaceuticals showed an increase in peak width and there was a gradual rise in pressure in the guard–analytical column combination. After the guard column was replaced, both the pressure and the peak widths returned to normal. The experiment was carried on and in the bottom part of the figure, one can see a rise in peak width occurring once again around 160+ injections indicating a buildup of milk solids on the guard column. So guard columns are a good idea.

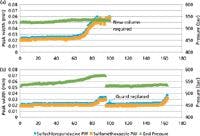
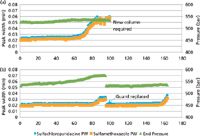
Figure 7: Accelerated column lifetime test for a milk substitute sample (Similac, diluted 300:1) containing two sulfa drugs. Shown are results obtained (a) without and (b) with a guard column in place. (a) Column failure at injection 70, (b) guard failure at injection 80 and guard replaced (same column used throughout).
Myth 3: You Can't Reverse an HPLC Column to Flush Out Particulates
False (but sometimes true): In practice, HPLC and UHPLC columns are packed at pressures much higher than its maximum operating pressure. Thus, if the proper hardware and slurry solvent was used and the time allotted for the packed bed to be well stabilized, a column should be usable in both directions. Aside from reversing a column to dislodge particulates that may have plugged the inlet frit, other reasons for reversed flow on a column would be its use in column switching experiments and rinsing a column with a stubborn, strongly sorbed sample at its entrance. In the latter case, backflushing provides a much shorter pathlength than to flush the material in a forward direction through the entire length of the column.
There is one exception in reversing the flow of an HPLC column. If the manufacturer has used a higher porosity frit at the column inlet, by reversing the column it might be possible to flush column packing particles out of the packed bed. This possibility was also mentioned earlier when I discussed Myth 5. Although the column outlet frit must be of much lower porosity than the smallest particle in the Δdp, the top frit can be of higher porosity — as long as the user doesn't try to reverse the column. Higher porosity frits (such as 2-µm frits) are more forgiving than smaller porosity frits (0.3-µm frits) and can tolerate more particulate buildup. So some manufacturers may use this approach and place an arrow on the column indicating that it must be used in one direction only. To be sure of this possibility, a chromatographer should check the column manual or data sheet or contact the manufacturer to find out if backflushing is advisable.
Myth 2: Smaller Particles and Ultrahigh Pressure Always Lead to Better Separations
False: There are many variables that affect packed column efficiency besides particle size and pressure even before the column is placed into the instrument. Table III summarizes the more important ones. Some of these variables are outside of the control of the user and must be optimized at the column factory. However, going beyond these somewhat obvious parameters, studies of column characteristics of modern columns have led to new approaches on how to evaluate a column. For example, with the newer superficially porous particles that provide column efficiencies that are as good as sub-2-µm UHPLC columns, their significantly lower pressure drop defies the conventional comparison of LC particles. The same can be said about the second generation monolithic silica columns — they, too, have significantly lower pressure drop than conventional microparticulate-packed totally porous particle columns. The conventional approaches to compare columns, such as the van Deemter equation, resolution equation, separation impedance factor, and so on, do not take into account all of the important parameters to compare modern columns: time, pressure, and efficiency.

Table III: Some variables affecting column efficiency of modern HPLC or UHPLC columns
So, to compare HPLC and UHPLC columns with one another, newer approaches such as the Poppe plot (11) and the kinetic plot (12) are becoming more popular. A detailed explanation of the generation and interpretation of a kinetic plot is well beyond the scope of this article and the reader is referred to some excellent background information (13,14). Basically, the van Deemter equation can be used to generate a kinetic plot; a sample is shown in Figure 8. A plot of log t0 versus log N at a given pressure (diagonal dotted lines in Figure 8) allows for the comparison of porous particles (1.7–1.8 µm, red; 3.5 µm, blue; and 5 µm, black), superficially porous particle (2.7 µm, pink) and the first generation silica monolith (green). Briefly, it shows that for fast separations (high velocity) at reasonable plate numbers (short columns), a superficially porous column or a sub-2-µm porous particle column performs the best with larger porous particles providing lower performance. The monolith falls on the curve closest to the 3.5 µm column. However, if one needs lots of theoretical plates (high N) and is willing to wait for a considerable time (lower velocities), then a 5-µm column may offer a better choice. The monolithic column may actually provide the best overall performance. This line is extrapolated because commercial monoliths currently are only available in 10-cm lengths and the housings are only capable of withstanding pressures as high as 200 bar. But, if a breakthrough comes along and the monoliths are able to be packed into longer columns and run at higher pressures then they may be the choice column for difficult separations. Unfortunately, recent data presented at HPLC 2013 showed that the second generation commercial silica monolith did not show the expected improvement in the position on the kinetic plot due to its high pressure drop because of changes in the porous structure (15).

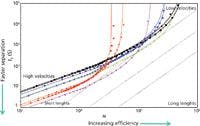
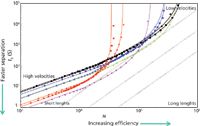
Figure 8: Kinetic plots for comparison of different particle sizes and a silica-based monolith, based on µmax. Columns in plot: Black: 5 µm (two suppliers); blue: 3.5 µm (two suppliers); red: 1.7 µm and 1.8 µm (two suppliers); green: monolith (limited to 200 bar); pink: 2.7-µm superficially porous particle. (Courtesy of G. Desmet and D. Cabooter, Free University of Brussels, Belgium.)
So, this simple example shows how kinetic plots can be used to determine the best performing column. Thus, smaller particles and ultrahigh pressures may not always be the best choice for the chromatographer!
Myth 1: Pressure Doesn't Affect LC Separations
False: There have been many studies on the effect of pressure on LC separations (16–23). In these studies, there have been many parameters that are impacted by pressure including partial molar volume of solutes, holdup volume, column porosity, retention factors, mobile phase density, mobile phase dielectric constant, stationary phase structure, pH, and ionization constants among many others. The reason why pressure is getting more attention is because of the ultrahigh-pressure instruments and columns that have appeared in the marketplace. When columns were being operated at 2000 psi or so, small differences in retention were hardly noticed, especially if the affect was repeatable and quantitation was unaffected. But when pressures are approaching 20,000 psi, these pressure effects may be quite noticeable.
Out of the most recent studies, the studies by Fallas and colleagues (22,23) were chosen to illustrate pressure effects because they examined the latest commercially available UHPLC instruments and the pressure ranges that chromatographers may encounter today. In their studies, they looked at small (22) and large (23) molecules. They investigated ionizable solutes in both the neutral (unionized) and ionized form (acids and bases). They looked at reversed-phase packings (C18, C1) and the HILIC mode. To minimize any possible frictional heating effects on their study, they used 5-µm particles rather than the more popular sub-2-µm particles. To generate back pressure on the LC column, they used capillary restrictors after the column but before the detector.
Rather than repeating their data, I would like to give a summary of their findings that illustrate the impact of pressure on retention. For low-molecular-weight neutral compounds with water–acetonitrile mixtures and water-methanol mobile phases, k values of neutral compounds changed as much as 12% over a change in pressure of 500 bar. However, for most solutes the impact was only 2–6%. For higher-molecular-weight neutral compounds, retention increases up to 50% were noted (ΔP = 500 bar). Ionized solutes (basic and acidic) in buffered systems also showed increases in retention of as much as 50% for a 500 bar increase in pressure. Most of these changes were attributed to decreases in the partial molar volume of the solute, mainly through the removal of its solvation layer as it partitions into the stationary phase. There could have been an impact on the pKa or pH by the large changes in pressure (500 bar). Although it is doubtful that most of us would experience as much as a 500-bar change in pressure on our column during method development, it serves to show that pressure-induced changes can occur to some extent and users should be aware of this possibility.
The authors showed examples in which elution reversals were observed, implying that pressure could be used as a variable in method development. A more practical implication though is that if a conversion of a method from a larger particle column (that is, a 5-µm column) to a smaller particle column (that is, a 1.7–1.8 µm column) run at higher linear velocity, pressure affects may come into play and cause shifts in retention times and even selectivity. Figure 9, provided by John Dolan (24), shows the impact of pressure on a separation of a three-compound mixture and the impact of increasing flow rate on a high pressure drop column. In this example (conditions of which are proprietary), as the flow rate was increased, pressure rose and the three compounds shifted their relative positions. Clearly, in these above studies, pressure did have an impact on the separation.

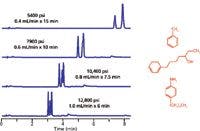
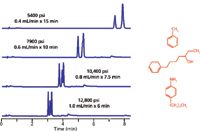
Figure 9: Selectivity and pressure. (Courtesy of John Dolan.)
Conclusion
Here, the top 10 HPLC and UHPLC column myths were demystified by providing proof statements and literature references that showed that these myths were unjustified. There are many other myths that are around, but they didn't make the top 10. However, most likely old myths will continue, some will fade away, and new myths will arise as more practitioners enter the chromatography community. Those new arrivals to this community may have to discover these myths on their own (since they don't necessarily listen to the old timers anyway). Perhaps new "Myth Busters" will take on the next generation of myths.
Acknowledgments
I would like to acknowledge my team of "Myth Busters" who provided examples or helpful suggestions for the top 10 column myths: David McCalley, University of Western England; John Dolan, LCGC columnist and LC Resources; Lloyd Snyder, LC Resources; Peter Carr, University of Minnesota; J.J. Kirkland, AMT; Gert Desmet, Free University of Brussels; Michael Dong, LCGC columnist and Genentech; Gerard Rozing, Technical Consultant at Rozing.com; Joe DeStefano, AMT; Maureen Joseph, Agilent Technologies; and Xiaoli Wang, Agilent Technologies. Thanks to Bill Long of Agilent who generated data for some of the figures.
References
(1) R.E. Majors, LCGC North Am. 24 (11), 1172–1182 (2006).
(2) R.E. Majors, "Top Ten LC Column Myths, Lecture PL2" presented at HPLC 2013, Amsterdam, Amsterdam, The Netherlands, 2013.
(3) R.E. Majors, LCGC North Am. 30 (1), 20–34 (2012).
(4) L.R. Snyder and J.W. Dolan, LCGC North Am. 22 (12), 1146–1152 (2004).
(5) L.R. Snyder and J.W. Dolan, LCGC North Am. 23 (2), 118–127 (2005).
(6) M. Przybyciel and R.E. Majors, LCGC North Am. 20 (6) 516–523 (2002).
(7) R.E. Majors and M. Przybyciel, LCGC North Am. 20 (7), 584–593 (2002).
(8) A.P. Schellinger, D.R. Stoll, and P.W. Carr, J.Chromatogr. A 1192 (1), 41–53 (2008).
(9) A.P. Schellinger, D. R. Stoll, and P.W. Carr, J.Chromatogr. A 1192 (1), 54–61 (2008).
(10) M.M. Fallas, S.M.C. Buckenmaier, and D.V. McCalley, J. Chromatogr. A 1235, 49–59 (2012).
(11) H. Poppe, J. Chromatogr. A 778, 3 (1997).
(12) G. Desmet, D. Clicq, and P. Gzil, Anal. Chem. 77, 4058 (2005).
(13) G. Desmet, LCGC North Am. 26 (6), 506–530 (2008).
(14) K. Broeckhoven, D. Cabooter, S. Eeltink, and G. Desmet, J. Chromatogr. A 1228, 20–30 (2012).
(15) D. Cabooter, R. Sterken, A. Vanmessen, S. Deridder, and G. Desmet, "Detailed Characterization of the Kinetic Performance of First and Second Generation Monolithic Silica Columns," presented at HPLC 2013, Amsterdam, The Netherlands, 2013.
(16) J.C. Giddings, Sep. Sci. 1, 73 (1966).
(17) N. Tanaka, T. Yoshimura, and M. Araki, J. Chromatogr. 406, 247 (1987).
(18) V.L. McGuffin and S.-H. Chen, Anal. Chem. 69, 930 (1997).
(19) V.L. McGuffin and C.E. Evans, J. Microcol. Sep. 3, 513 (1993).
(20) J.W. Thompson, T.J. Kaiser, and L.W. Jorgensen, J. Chromatogr. A 1134, 201 (2006).
(21) M. Martin and G. Guiochon, J. Chromatogr. A 1090, 16 (2005).
(22) M.M. Fallas, U.D. Neue, M.R. Hadley, and D.V. McCalley, J. Chromatogr. A 1209, 195–205 (2008).
(23) M.M. Fallas, U.D. Neue, M.R. Hadley and D.V. McCalley, J. Chromatogr. A 1217, 276–284 (2010).
(24) John Dolan, personal communication.
Erratum
Table I in the April 2013 installment of "Column Watch" (R.E. Majors, LCGC North Am. 31 [4], 280–298 [2013]) contained incorrect information about Thermo Fisher Scientific's Accucore columns. The columns are available in analytical, guard, and nano formats.
Ronald E. Majors "Column Watch" Editor Ronald E. Majors is a Senior Scientist in the Columns and Supplies Division at Agilent Technologies (Wilmington, Delaware), and is a member of LCGC's editorial advisory board. Direct correspondence about this column to lcgcedit@lcgcmag.com.


Ronald E. Majors


, MSc. in Pharmacognosy from the University of Illinois at Chicago, Chicago, Illinois under the supervision of Dr. Djaja Djendoel Soejarto and Dr. Cindy K. Angerhofer (1997), and Ph.D. in Pharmacognosy from the University of Lausanne, Lausanne, Switzerland under the guidance of Prof. Kurt Hostettmann (2002). Then, she conducted her postdoctorate on biomedical applications of mass spectrometry at Prof. Richard B. van Breemen’s laboratory at the University of Illinois at Chicago (2006-2008). She joined the faculty at Auburn University College of Pharmacy as an Assistant Professor in August 2008. Dr. Calderón specializes in natural drug products research, specifically applications of mass spectrometry to natural products drug discovery, and quality and safety assessment of botanical dietary supplements. Over the last sixteen years, she has authored 52 publications, 1 US patent, and 5 book chapters. She also has received research funding from agencies that include National Center for Complementary and Integrative Health (NCCIH) and the Office of Dietary Supplements (ODS) of the National Institutes of Health (NIH), American Society of Pharmacognosy, United States Pharmacopeia, Auburn University Research Initiative in Cancer (AURIC), and botanical dietary supplements industry. Dr. Calderón is currently an expert member of the United States Pharmacopeia Botanical Pan-American Expert Panel. She also was a member of the United States Pharmacopeia Botanical Dietary Supplements and Herbal Medicines Expert Committee. Additionally, she was the Section Editor of Pharmacognosy of Combinatorial Chemistry & High Throughput Screening and Pharmaceutical Biology and is a current member of the Advisory Board of Planta Medica She has been grant proposal reviewer for National Institutes of Health (NIH), National Science Foundation (NSF), USA and German Federal Ministry of Education and Research (BMBF) and Project Management Jülich (PtJ) and Deutsche Forschungsgemeinschaft (German Research Foundation), Germany, and International Foundation for Science (IFS), Sweeden.")


New HPLC, MS, and CDS Products Introduced in 2023–2024: A Brief Review
April 5th 2024This article describes newly introduced high-performance liquid chromatography (HPLC), mass spectrometry (MS), chromatography data systems (CDS), and related products in 2023–2024. It summarizes their technical specifications and significant user benefits.


