Advances in LC–MS for Food Analysis
Special Issues
In this review, the most recent LC–MS approaches are discussed, as well as the technical requirements for linking an LC system to a mass spectrometer. The advantages of on-line 2DLC in the "comprehensive" mode are also illustrated and selected applications for the analysis of common foodstuffs, such as triacylglycerols, carotenoids and polyphenols, are described. Finally, future trends for LC–MS in food analysis are reported.
Within the wide range of hyphenated techniques, liquid chromatography–mass spectrometry (LC–MS) has recently emerged to a central role in different fields, including food analysis. In this review, the most recent LC–MS approaches are discussed, as well as the technical requirements for linking an LC system to a mass spectrometer. The advantages of on-line two-dimensional liquid chromatography (2DLC) in the "comprehensive" mode are also illustrated and selected applications for the analysis of common foodstuffs, such as triacylglycerols, carotenoids and polyphenols, are described. Finally, future trends for LC–MS in the food analysis are reported.
Food products are complex mixtures containing both organic and inorganic constituents. The analysis of food products is generally directed towards the assessment of food safety and authenticity, the control of a technological process, the determination of nutritional values and the detection of molecules with a possible beneficial or toxic effect on human health.
Consequently, one of the most stringent demands of food chemistry is directed towards the continuous improvement and development of powerful analytical techniques (1) to analyse the major and minor components of food samples.
Liquid chromatography–mass spectrometry (LC–MS) is an increasingly valuable tool in food analysis and has been widely applied to the analysis of many food products (2). Recent achievements in instrumentation and data processing have allowed LC–MS to play a central role in food-related analysis. However, when dealing with the extreme complexity of many real-world samples, one-dimensional chromatography may not provide sufficient analytical results. As a consequence, considerable research has recently been devoted to the development of multidimensional LC techniques (MDLC), with enhanced resolving power (3).
The purpose of this review is to acquaint the reader with some of the existing recent applications of LC–MS-based techniques in food analysis. Topics covered will include MS analysis of LC-amenable food compounds, namely triacylglycerols, carotenoids and polyphenols. Technical sections will briefly introduce both theoretical and practical concerns of this hyphenated technique, also in the multidimensional "comprehensive" mode (LC×LC–MS).
Liquid Chromatography–Mass Spectrometry (LC–MS)
The potential benefits arising from the hyphenation of LC to MS become clear if the limitations of the two independent techniques are considered, and to what extent such a combination may alleviate them. Peak overlapping sometimes precludes unambiguous identification, even if disposing of reference standard material. Even the most widely used ultraviolet (UV) detector can rarely provide unambiguous data on the separated analytes, regardless of the degree of chromatographic separation obtained; the situation is further complicated if quantitative determination is also desired.
On the other hand, mass spectral data are, in many instances, specific enough to support positive identification and in discriminating nonisobaric compounds, providing the analyst with structural information, in addition to the molecular weight.
MS systems can also be used with non-UV absorbing analytes and can be operated in the full scan mode, viz total ion current (TIC), or, more specifically, in tandem MS (MS–MS) experiments or in the selected ion monitoring (SIM) mode. SIM operation is preferred for the development of selective and sensitive quantitative assays, while tandem MS data, generated by using soft ionization techniques, provide structural information which can help in the identification of unknown analytes.
Mass spectrometry allows for quantitative determination to be performed accurately, precisely and with high sensitivity (at the picogram level), using isotopicallylabeled compounds as internal standards (ISs). Whenever the quantification, or even the detection of a target trace component, in SIM mode, is hampered by the presence of high background ions with the same m/z values, constant neutral loss or precursor ion scanning techniques help in distinguishing the ions of interest from unspecific matrix components. The so-called selected reaction monitoring (SRM) mode enhances selectivity and lowers detection limits, therefore reducing sample consumption, analysis times and the need for clean-up procedures (4).
LC–MS plays a central role in both basic and applied research because of significant advances in interface technology and ionization techniques and it also has a broad range of applicability and high sensitivity for the analysis of high-polar and highmolecular mass compounds.
In addition, the replacement of the older sector machines with ion trapping instruments (IT), quadrupoles (Q), timeof-flight (ToF) systems and a variety of hybrid instruments characterized by high resolution, enhanced sensitivity, as well as increased mass accuracy over a wide dynamic range. Among these are the ion mobility time-of-flight (IM-ToF), quadrupole ToF (Q-ToF), ion trap-ToF (IT-ToF) and linear ion trap-Fourier transform ion cyclotron resonance (FT-ICR).
Ultimate generation singlequadrupoles allow for high speed scanning (up to 15,000 amu/sec) and ultrafast polarity switching; the small size and the possibility to perform tandem MS make them ideal for benchtop LC–MS. On the other hand, ToF instruments present a number of advantages: high speed (up to 20,000 Hz), high resolution (using a reflectron), virtually no limit on mass range, femtogram-level sensitivity, sub-ppm mass accuracy, improved in-spectrum dynamic range without loss in sensitivity, high mass resolution and feasibility to use as a second stage in tandem MS experiments, in combination with either an IT-ToF or a Q-ToF.
From the quantitative standpoint, the linear dynamic range depends on the type of source employed; electrospray ionization (ESI) is characterized by a dynamic range over 2–3 orders of magnitude, and currently represents the most common choice for routine LC–MS analysis. However, atmospheric-pressure chemical ionization (APCI) and atmospheric pressure photo-ionization (APPI) techniques offer greater sensitivity and a wider dynamic range (4–5 orders of magnitude), though their use for large bio-molecules is precluded (5). Liquid chromatography nano-electrospray ionization (LC–nano-ESI) operation has become feasible in recent years (6), boosting the sensitivity of LC–MS techniques. The newly developed interfaces are suitable for linkage with capillary-type LC columns, operated in the µL-to-nL flow range; current configurations using goldcoated capillaries or automated chips allow analyte detection down to the femtomole level.
LC–MS Applications for Triacylglycerol Analysis
Plant oils, animal fats and fish oils are natural sources of triacylglycerols (TAGs) in the human diet. Since they may contain hundreds of different TAGs, which are characterized by the total carbon number (CN), the number, position and configuration (cis/trans) of double bonds (DBs) in fatty acids (FA) acyl chains and the stereospecific position of FAs on the glycerol skeleton (sn-1, 2 or 3), tremendously complex mixtures may arise (7). Two chromatographic techniques are more widespread in the analysis of TAGs in natural samples, namely nonaqueous reversed-phase liquid chromatography (NARP-LC) and silverion chromatography (SIC).


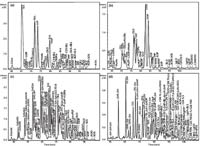
Figure 1
As shown in Figure 1, in NARP-LC, TAG retention times increase with the increasing partition number (PN) (8). In SIC, TAG separation is governed mainly by the number of DBs. Double bond positional isomers, cis-/trans-isomers or regioisomers (R1R1R2 vs. R1R2R1) can be also separated (9). APCI-MS coupled to LC represents the most powerful tool for TAG identification, because of the full compatibility with common NARP-LC conditions, easy ionization of non-polar TAGs and the attainment of both protonated molecules [M+H]+ and fragment ions [M+H–RiCOOH]+; in addition, ESI or matrix-assisted laser desorption/ionization (MALDI) have also been used (10,11). LC–MS offers possibilities for a better determination of minor compounds whose signals might otherwise be suppressed; in terms of mass spectrometric analysers, TAG analysis has been developed and implemented successfully with tandem quadrupoles and linear ion traps. Tandem mass spectrometry (MS–MS) has proved to be an essential tool for unambiguous structural characterization for mixtures of isobaric species, yielding product ions from both positive and negative fragmentation processes. Later on, the triple quadrupole mass spectrometer was found to be well suited for TAG analysis through MS–MS operation, including product ion scanning and selected reaction monitoring (SRM). High resolution mass analysis of molecular ion species and product ions after collision-induced dissociation (CID) became routinely possible with the second generation ToF analysers, FT-ICR and orbitrap mass spectrometer. Hybrid mass spectrometers such as the Q-ToF afford superior spectral resolution and mass accuracy, also overcoming duty cycle issues typically associated with other scanning instruments; the so-called MSE acquisition mode actually allows for many precursor and neutral loss acquisitions within a single experimental run. From the LC standpoint, recent advances in column technology (sub-2 µm and shellparticles) and hardware (allowing operating pressures up to 15,000 psi) have arrived to meet the expected performance in terms of resolution, speed and sensitivity with respect to conventional LC analysis. UHPLC–MS platform combining ultra high performance liquid chromatography with an orthogonal-accelerated timeofflight (oa-ToF) spectrometer offer high-throughput sample analysis, providing narrow chromatographic peaks (< 3 sec) with good ion statistics from accurate mass measurement (< 2 ppm) (12).
LC–MS Applications for Carotenoid Analysis
Carotenoids are a class of naturally occurring compounds in foods and food products, usually characterized by a C40tetraterpenoid structure, with a centrally located, extended conjugated double bond system. They are usually divided into two groups: hydrocarbon (carotenes) and oxygenated carotenoids (xanthophylls). The latter can be found in either a free form or in a more stable, fatty acid esterified form.
Several works have highlighted the preventive effect of these molecules against serious health disorders such as cancer, heart disease and macular degeneration (13). Most of the studies performed so far have been directed to the analysis of free carotenoids, usually after a saponification step, to reduce sample complexity. Major drawbacks of such a strategy consist in the strong conditions used for hydrolysis, which may lead to carotenoid loss, as well as isomerization. C18 and C30 stationary phases have been extensively used to achieve the separation of carotenoids differing in hydrophobicity within a given structural class (14).
Although widely used for carotenoid identification, photodiode array (PDA) detection nevertheless fails in the situation of analytes that exhibit similar, or even identical, spectra. To circumvent such an issue, many researchers have complemented carotenoid identification by using other detection methods (15). Among these, mass detection turned out to be a great aid for the analysis of these substances, allowing structure elucidation on the basis of both molecular mass and fragmentation pattern. Several ionization methods have been reported for MS analysis of carotenoids, including electron impact (EI), fast atom bombardment (FAB), MALDI, ESI, APCI and, more recently, APPI and atmospheric pressure solids analysis probe (ASAP). The latter can be used for the direct analysis of samples, without the need for sample preparation or chromatographic separation, thus allowing for a fast detection screen of multiple analytes.
Sometimes, LC–MS–MS or MSn can be advantageously applied to carotenoid analysis, through the use of specific transitions and daughter ions for the identification of analytes through precursor ion selection, with high mass accuracy (eventually allowing to discriminate between carotenoids having equal molecular masses, but different fragmentation patterns); an example is shown in Figure 2. Further advantages are represented by minimal sample clean-up, leading to a decrease in overall analysis time and a higher sample throughput (16).


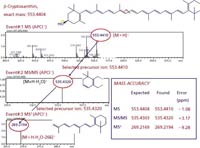
Figure 2
LC–MS Applications for Polyphenol Analysis
Occurring in many food products with enormous structural variability (5000 derivatives are known today), phenols and flavonoids are receiving special interest because of their broad spectrum of pharmacological effects (17). The identification of these polyphenol derivatives in food samples is a difficult task as a result of the complexity of the structures and the limited standards commercially available. For this reason, the most common separation techniques used to determine these kinds of bioactive compounds in such samples have been capillary electrophoresis (CE), GC and LC.


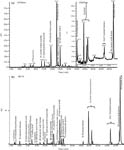
Figure 3
CE provides high efficiencies in short migration times with small amounts of reagents and sample volumes needed (18), although its main disadvantage is the low concentration sensitivity. GC is the least used technique for this purpose because a derivatization step is necessary. LC in combination with MS proved to be by far the most useful analytical approach for identification, structural characterization and quantitative analysis of these compounds. The sensitivity of the MS response is clearly dependent on the interface technology employed. As ionization interfaces, APCI and ESI, under positive and negative ionization modes, are usually adopted. In general, polyphenolic components are detected with a greater sensitivity as negative ions (protonated or not), while significant fragments are obtained in the positive ionization mode; in this regard, the two modes complement each other to provide useful information for identification purposes.
In contrast, API typically yields only a single intense ion, thus hampering analyte accurate identification. Often, spectral data from single-stage MS are combined with UV absorbance to afford positive identification of polyphenolic compounds, with the support of commercial standards and/or reference data when available (19). The employment of MS–MS and MSn achievable by ion trap or triple quadruple MS is a very powerful tool since it discriminates between positional isomers, as well as elucidates the aglycone and sugar moiety (20).
Comprehensive TwoDimensional Liquid Chromatography–Mass Spectrometry (LC×LC–MS)
The enormous complexity of realworld samples, including foodstuffs,poses high demand both in terms of separation power and sensitivity of detection. In the last few decades, much effort has been directed to the development of multidimensional LC (MDLC) systems, especially in the comprehensive mode (LC×LC), aimed at increased resolution through careful selection of independent (orthogonal) separation modes. Hyphenation to mass spectrometry represents a third, added dimension to an LC×LC system, generating the most powerful analytical tool today for non-volatile analytes. Moreover, tandem MS techniques can afford structure elucidation through characteristic fragmentation pattern; each MS stage representing an added dimension to the LC or 2DLC system in terms of isolation, selectivity or structural information. Additional degrees of freedom can be obtained by the unprecedented mass accuracy (< 1 ppm) and resolution (> 100,000) of modern ToF, triple quadrupole and FT-ICR analyzers. These high- and ultra-high resolution mass spectrometers, used in conjunction with soft ionization methods, can help to resolve highly complex samples (21,22). An increased number of spectra and improved mass resolution make ToF analysers the optimum choice for detection in 2DLC.
Technical requirements for linkage of an LC×LC system to an MS one include: the choice of the mobile phase (buffer and salts), flow rate (splitting), type of ionization (interface) and coupling mode (off-line and on-line). The choice of column sets, spatial resolution, mass resolving power, mass accuracy and tandem-MS capabilities are also crucial, both from the LC and the MS standpoint. Selectivity can be further tuned by adjusting experimental parameters, such as: mobile phase composition and pH value, ion-pairing agents, elution (either isocratic or gradient), flow rate and temperature.
When designing an on-line LC×LC–MS technique, the detector response and the limited dynamic range of the instrument must be considered also. Tubing and valves used may cause significant dilution and negatively affect the MS response, with the overall dilution factor being multiplicative of the dilution factors in each dimension. The use of trapping columns for fraction collection may alleviate such an issue, since analyte re-concentration occurs (23). Requirements for the second dimension (2D), which represent the back-end separation prior to the MS system, are the same as those for a one-dimensional LC–MS analysis; reversed phase (RP) chromatography is the most common choice, since typical mobile phases at the end of an RP separation contain a high percentage of organic solvents and volatile additives, which are beneficial for MS ionization. With regards to column dimension, miniaturization (use of a microbore, 1.0 mm i.d. or capillary, 0.1–0.5 mm i.d. column) is also beneficial as far as dilution and sensitivity are concerned; in addition, reduced mobile-phase flow rates (µL to the nL range) avoids flow splitting prior to the MS source. In LC×LC–MS platforms, a fast MS acquisition rate is often necessary, since the 2D separation can be very rapid and peak widths characterized by a few seconds or less are not unusual. To adequately sample the 2D effluent, the mass analyser should be capable of acquiring at least 6–10 data points per peak.
Maximizing the resolution is beneficial for subsequent MS detection, since it alleviates ion suppression effects due to insufficient separation, which may cause high abundant species to obscure the detection of the less abundant. On the other hand, the potential spreading of minor peaks over too many fractions must be considered, since high sampling rates may reduce the concentration of low abundant components and, therefore, hamper their detection.
LC×LC–MS Applications for Triacylglycerol Analysis
In the last few years, comprehensive two-dimensional systems in combination with mass spectrometry have been investigated for TAG separation in various food samples, namely rice oil (24), soybean and linseed oils (25), donkey milk (26) and corn oil (27), using SIC- in the first dimension (1D) and NARP-LC in 2D, respectively. The two separation modes are based on different retention mechanisms, and hence, the column combination can be considered as entirely orthogonal. For 1D separation, either a microbore (1 mm i.d.) or a narrow-bore column (2.1 mm i.d.) were employed, both lab-silvered using a Nucleosil 5-SA (strong cation exchange) column. In most cases (24–26), n-hexane modified with a small amount of acetonitrile was used in 1D, whereas isopropanol and acetonitrile, in a gradient programme, were used in 2D. The issues related to solvent incompatibility and analyte-focusing were solved by using a microbore column with a very low flow rate in the 1D and by decreasing the percentage of the weaker solvent (acetonitrile) in the 2D. The 2D chromatograms were characterized by the formation of group-type patterns, with TAGs located in characteristic positions in relation to their PN and DB values. With regards to MS conditions, a data acquisition rate of 5 Hz and a mass scan range of 400–900 amu, allowed the acquisition of approximately 10 spectra for peaks of approximately 2 sec duration; the spectral production frequency was sufficient for reliable peak identification. An innovative LC×LC system has recently been investigated by van der Klift et al. (27) for the analysis of a corn oil sample. In this work, TAGs could be rapidly and efficiently separated with a methanolbased solvent on an Ag-coated ion exchanger, avoiding the use of hexane and enabling peak focusing at the head of the 2D column. In terms of detection, the authors compared UV, evaporative light scattering detector (ELSD) and APCI-MS with the aim of improving the accuracy and precision of TAG quantitation. APCI-MS TIC data were processed both manually and automatically from the untransformed LC×LC chromatograms (Figure 4). After correction with literature-derived response factors, the quantitative values obtained were compared with values previously reported for corn oil TAGs by GC–FID analysis. The main trend coincided, but significant deviations were observed for individual components. This was probably caused by the use of correction factors obtained under different experimental conditions (both chromatographic and MS parameters). However, in terms of peak overlap, the developed LC×LCAPCI-MS system showed a remarkable increase in peak capacity, with respect to onedimensional techniques, and was of great help in the qualitative and quantitative determination of the TAG fraction in the complex food sample tested.


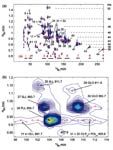
Figure 4
LC×LC–MS Applications for Carotenoid Analysis
Different LC×LC–PDA–APCI-MS systems were investigated to elucidate the carotenoid composition of complex food samples, either on free carotenoids attained after a saponification step, or on the native forms (28–31). In the first approach, a silica microbore column, operated under normal phase (NP) conditions, was coupled to a C18 monolithic column, under RP conditions (28). In the second set-up, a cyano microbore column, operated under NP conditions, was coupled to either a C18 monolithic (29,30) or shell-packed column (31), under RP conditions. In the 1D, n-hexane/butylacetate/acetone 80:15:5 (v/v/v) and n-hexane were used, whereas 2-propanol and 20% water in acetonitrile (v/v) were employed in the 2D.
Under NP-LC conditions, free carotenoids are separated into groups of different polarity, from the non-polar carotenes up to the polar polyols. In the RP-LC mode, carotenoids are eluted according to their increasing hydrophobicity and decreasing polarity. In all cases, the use of two detection systems, namely PDA and MS, proved to be a mandatory tool for carotenoid identification. Concerning MS conditions, in three out of four setups tested, a quadrupole system in the mass range of 250–1300 m/z was employed, while for the most recent application, an IT-TOF mass spectrometer, in the mass range of 200–1200 m/z, both equipped with an APCI interface. In the most recent work, special attention was devoted to the elucidation of the epoxycarotenoid fraction, whose composition could be a useful parameter to evaluate juice age and freshness (31). In fact, re-arrangements from 5,6- (violaxanthin, antheraxanthin) to 5,8-epoxides (luteoxanthin, mutatoxanthin) can occur with time, partially due to the natural acidity of the juice, which can affect the juice freshness. The attained MS and UV spectra were purer, as a result of the higher LC×LC separation power, with respect to conventional LC, thus highlighting the power of the LC×LCAPCI-MS approach (31).
LC×LC–MS Applications for Polyphenol Analysis
Polyphenol content in many food samples is high and highly variable; for this reason, conventional LC techniques are often insufficient for complete characterization. Thus, LC×LC–MS techniques were considered for the study of such compounds in beer (32), wine and juices (33,34), as well as apple and cocoa extracts (35). Hajek et al. optimized an LC×LC method for the analysis of polyphenols, using UV, electrochemical coulometric and MS detection (32). A polyethylene glycol (PEG) column was used in the 1D, and different C18 and C8 stationary phases were tested in the 2D. The combination of the columns tested, under matching gradient profiles, provided a high degree of orthogonality for 27 natural antioxidants. A similar set-up, in combination with PDA and MS (ESI-ITTOF) detection, has been investigated (33) for the separation of polyphenolic antioxidants in a commercial red wine. A microphenyl column in the 1D, while a partially porous C18 and a monolithic C18 column of identical dimensions (30 × 4.6 mm; 2.7 µm) were compared for the 2D separation.
The high resolution and accuracy of the IT-TOF-MS was beneficial for identification, with an ESI source operated under both positive and negative ionization conditions; the general MS accuracy was lower than 3.1 ppm. A novel RPLC×RPLC system was developed (34) for the quantification of polyphenolic antioxidants in wine and juice. In the configuration described, the well separated components in the 1D were directed to the detector, while the more complex part of the sample was diverted to the 2D via a ten-port valve. Two C18 columns, the second with an ion-pair reagent (tetrapentylammonium bromide), were used. Compound identification was performed using LC–ESI-TOF-MS for primary-column analytes, since the ionpair reagent used in the 2D was not compatible with MS. A comprehensive HILIC×RPLC approach was investigated by Kalili and de Villiers for the analysis of procyanidins in cocoa and apple extracts (35). Depending on the degree of polymerization, these structures, composed of flavan-3-ol monomeric units, can be very complex and their separation challenging. Oligomeric procyanidins were separated according to molecular weight using a HILIC and RP-LC columns, respectively, in the 1D and 2D. The combination of the two separation modes provided very high orthogonality, and a significant improvement in the resolution of oligomeric procyanidin isomers (Figure 5). Positive confirmation was then achieved by the combination of both MS and fluorescence data, dramatically decreasing the probability of false identification.


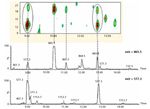
Figure 5
Conclusions
In the last years, there has been a notable increase in the amount of literature pertaining to LC–MS analysis of several food products. Several methodologies have been developed to detect, identify and quantify various foodrelated naturally occurring substances. Instrumentation incorporating ESI sources has recently come to dominate many areas of MS. Predictably, both ESI-MS and MALDIMS will continue to have expanding roles in the future. It is expected that the automation of the entire LC–MS system (benchtop instrumentation inclusive of on-line sampling treatment) will favour its diffusion for routine analysis. In this scenario, scientists involved in producing new analytical instrumentation and developing new analytical methods play a crucial role in order to give a correct answer to these new needs and expectations.
Francesco Cacciola1,2, Paola Donato3,1, Marco Beccaria1, Paola Dugo1,3 and Luigi Mondello1,3 1 Dipartimento Farmaco-chimico, Università degli Studi di Messina, Messina, Italy, 2Chromaleont s.r.l. A spin-off of the University of Messina, c/o Dipartimento Farmaco-chimico, Università degli Studi di Messina, Messina, Italy, 3Centro Integrato di Ricerca (C.I.R.), Università Campus Bio-Medico, Roma, Italy.
References
(1) H.-D. Belitz and W. Grosch, Food Chemistry, Springer-Verlag, Berlin, (1999).
(2) M. Careri, F. Bianchi and C. Corradini, J. Chromatogr. A, 970(1–2), 3–64 (2002).
(3) P. Dugo, F. Cacciola, T. Kumm, G. Dugo and L. Mondello, J. Chromatogr. A, 1184(1–2), 353–368 (2008).
(4) S.H. Hoke II, K.L. Morand, K.D. Greis, T.R. Baker, K.L. Harbol and R.L.M. Dobson, Int. J. Mass Spectrom., 212(1–3), 135–196 (2001).
(5) S.S. Cai, K.A. Hanold and J.A. Syage, Anal. Chem., 79(6), 2491–2498 (2007).
(6) M. Wilm and M. Mann, Anal. Chem., 68, 1–8 (1996).
(7) W.C. Byrdwell, E.A. Emken, W.E. Neff and R.O. Adlof, Lipids, 31(9), 919–935 (1996).
(8) M. Lisa and M. Holcapek, J. Chromatogr. A, 1198–1199, 115–130 (2008).
(9) M. Lisa, H. Velinska and M. Holcapek, Anal. Chem., 81(10), 3903–3910 (2009).
(10) N.L. Leveque, S. Heron and A. Tchapla, J. Mass Spectrom., 45(3), 284–296 (2010).
(11) M. Malone and J.J. Evans, Lipids, 39(3), 273–284 (2004).
(12) J.M. Castro-Perez, J. Kamphorst, J. DeGroot, F. Lafeber, J. Goshawk, K. Yu, J.P. Shockcor, R.J. Vreeken and T. Hankemeier, J. Proteome Res., in press (10.1021/pr901094j).
(13) C.E. Scott and A.L. Eldridge, J. Food Comp. Anal., 18(6), 551–559 (2005).
(14) F. Khachik, Analysis of carotenoids in nutritional studies in Carotenoids. Nutrition and Health (Vol. 5), G. Britton, S. LiaaenJensen and H. Pfander, Eds. (Basel, Boston, Berlin: Birkhauser Verlag), 7–44 (2009).
(15) Q. Su, K.G. Rowley and N.D.H. Balazs, J. Chromatogr. B, 781(1–2), 393–418 (2002).
(16) S.M. Rivera and R. Canela-Garayoa, J. Chromatogr. A, 1224, 1–10 (2012).
(17) M. Ganzera, Electrophoresis, 29(17), 3489–3503 (2008).
(18) V. García-Canas and A. Cifuentes, Electrophoresis, 29(1), 294–309 (2008).
(19) B.F. Zimmermann, S.G. Walch, L.N. Tinzoh, W. Stühlinger and D.W. Lachenmeier, J. Chromatogr. B, 879(24), 2459–2464 (2011).
(20) P. Dugo, F. Cacciola, P. Donato, R. Assis Jacques, E. Bastos Caramão and L. Mondello, J. Chromatogr. A, 1216(43), 7213–7221 (2009).
(21) F.W. McLafferty, Int. J. Mass Spectrom., 212(1–3), 81–87 (2001).
(22) R.W. Kondrat, Int. J. Mass Spectrom., 212(1–3), 89–95 (2001).
(23) K. Horvath, J. Fairchild and G. Guiochon, J. Chromatogr. A, 1216(12), 2511–2518 (2009).
(24) L. Mondello, P.Q. Tranchida, V. Stanek, P. Jandera, G. Dugo and P. Dugo, J. Chromatogr. A, 1086(1–2), 91–98 (2005).
(25) P. Dugo, T. Kumm, M.L. Crupi, A. Cotroneo and L. Mondello, J. Chromatogr. A, 1112(1–2), 269–275 (2006).
(26) P. Dugo, T. Kumm, B. Chiofalo, A. Cotroneo and L. Mondello, J. Sep. Sci., 29(8), 1146–1154 (2006).
(27) E.J.C. van der Klift, G. Vivo-Truyols, F.W Claassen, F.L. van Holthoon and T.A. van Beek, J. Chromatogr. A, 1178(1–2), 43–55 (2008).
(28) P. Dugo, V. Skerikova, T. Kumm, A. Trozzi, P. Jandera and L. Mondello, Anal. Chem., 78(22), 7743–7750 (2006).
(29) P. Dugo, M. Herrero, T. Kumm, D. Giuffrida, G. Dugo and L. Mondello, J. Chromatogr. A, 1189(1–2), 196–206 (2008).
(30) P. Dugo, M. Herrero, D. Giuffrida, T. Kumm and L. Mondello, J. Agric. Food Chem., 56(10), 3478–3485 (2008).
(31) P. Dugo, D. Giuffrida, M. Herrero, P. Donato and L. Mondello, J. Sep. Sci., 32(7), 973–980 (2009).
(32) T. Hajek, V. Skerikova, P. Cesla, K. Vynuchalova and P. Jandera, J. Sep. Sci., 31(19), 3309–3328 (2008).
(33) P. Dugo, F. Cacciola, M. Herrero, P. Donato and L. Mondello, J. Sep. Sci., 31(19), 3297–3308 (2008).
(34) M. Kivilompolo and T. Hyotylainen, J. Chromatogr. A, 1145(1–2), 155–164 (2007).
(35) K.M. Kalili and A. de Villiers, J. Chromatogr. A, 1216(35), 6274–6284 (2009).


Analytical Challenges in Measuring Migration from Food Contact Materials
November 2nd 2015Food contact materials contain low molecular weight additives and processing aids which can migrate into foods leading to trace levels of contamination. Food safety is ensured through regulations, comprising compositional controls and migration limits, which present a significant analytical challenge to the food industry to ensure compliance and demonstrate due diligence. Of the various analytical approaches, LC-MS/MS has proved to be an essential tool in monitoring migration of target compounds into foods, and more sophisticated approaches such as LC-high resolution MS (Orbitrap) are being increasingly used for untargeted analysis to monitor non-intentionally added substances. This podcast will provide an overview to this area, illustrated with various applications showing current approaches being employed.


 - stock.adobe.com")
Investigating PFAS in Plastic Food Storage Bags Using LC–MS/MS
May 3rd 2024Yelena Sapozhnikova from the United States Department of Agriculture spoke to The Column about her innovative research investigating PFAS in plastic food storage bags using targeted and non-targeted liquid chromatography–tandem mass spectrometry.


