Advances in Multidimensional LC–GC for Food Analysis
Special Issues
On-line heart-cut LC–GC and, more recently, comprehensive LC–GC (LC?GC) are very powerful analytical techniques because of the combination of the selectivity features of LC with the high efficiency of GC. This article presents an overview of the most recently used interfacing systems, as well as applications in the food analysis.
On-line heart-cut LC–GC and, more recently, comprehensive LC–GC (LC×GC) are very powerful analytical techniques because of the combination of the selectivity features of LC with the high efficiency of GC. Such a combination can overcome the drawbacks related to sample manipulation in off-line approaches because of the automation of the transfer procedure. Dirty samples, or non-volatile components, can be pre-purified in the LC step, allowing the transfer to the GC system of the volatile fraction, or of selected fractions, exploiting the high selectivity of the LC process. This article presents an overview of the most recently used interfacing systems, as well as applications in the food analysis.
Food samples are often formed of compounds belonging to numerous chemical groups, present in a wide range of concentrations; thus, one-dimensional gas and liquid chromatographic techniques often cannot provide the required efficiency and selectivity for safety or quality assessment.
Nowadays, great attention is being devoted to the application and development of multidimensional chromatographic techniques because of their higher separation power and selectivity. Among the chromatographic combinations, the hyphenation of liquid and gas chromatography in a heartcut system, or, in the last decade, in a comprehensive one, has proven to be of considerable interest. The reason for this attractiveness is related to the capability of such methods to elucidate samples, or sample fractions, characterized by high complexity; furthermore, in many situations the LC process acts as a sample preparation step, avoiding the presence of nonvolatile components in the GC system.
The main strength of multidimensional LC–GC lies in the high selectivity of LC and the enhanced separation power of GC. On-line LC–GC methods are particularly suited for the separation of compounds with similar physico-chemical properties, or of target components from a complex matrix. The coupling of the second dimension to a mass spectrometer generates a very powerful three-dimensional analytical method, heart-cut LC–GC or comprehensive LC×GC coupled to MS (LC–GC–MS or LC×GC–MS), characterized by the potential to generate highly pure spectra, which enables a much easier interpretation compared to those generated from GC–MS analysis.
The main problem, from an instrumental point of view, is to introduce a large volume of liquid effluent into a GC injector. As a consequence, the coupling of these two techniques is a more difficult compared to multidimensional GC or LC approaches. However, technological developments have enabled the development of efficient interfaces for on-line applications. Fully automated interfacing is now possible by using commercially available hardware, enabling either heart-cut or comprehensive analysis.
On-line LC–GC and LC×GC Transfer Devices
In modern-day multidimensional LC–GC analysis, loop-type and syringe-based interfaces are mainly used for efficient solvent removal and chromatography band transfer, coupled to on-column or vaporizing injectors. For a detailed description of LC–GC interfaces and instrumental features, detailed contributions are present in the literature (1,2).
The selection of the most suitable interface and injection system is mainly based on the analytical problem at hand, and on the selected LC conditions. The amount of solvent to be eliminated depends on the column dimensions and can vary between a few microlitres and 1 mL. On the other hand, the nature of the solvent is of the utmost importance and very polar solvents, such as methanol or water, are difficult to remove effectively. For this reason, often relatively highly volatile apolar to medium-polar solvents are used, even though different approaches have been developed to allow the use of reversed-mode LC.
The programmable temperature vaporizing (PTV) injector is, from a practical point of view, the easiest to use. In the PTV injector, the solvents are removed via the split vent, while non-volatile components remain in the liner, a part that can be easily cleaned. The PTV injector is the most commonly used solvent-removal device in LC×GC, where a high number of transfers are performed. On-column injection is particularly suitable in the presence of low boiling components because of the capability of such an injector to reduce discrimination during the solvent evaporation step. A brief description of current-day interfaces for LC–GC systems now follows.
Flow-cell Interface
A flow-cell system, combined with a PTV injector (3), can be used to efficiently transfer LC fractions to the GC dimension [Figure 1(a)].


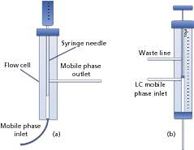
Figure 1
The LC effluent flows continuously into the flow cell from the bottom, reaching a waste line located on one side. In correspondence of the fraction of interest, a large-volume autosampler syringe is introduced into the flow cell through a septumless head, allowing the fraction to be collected inside the syringe via the needle.
Once the fraction is collected, the autosampler directs the syringe to the GC injector; the latter is commonly equipped with a packed liner to increase the contact surface, thus enabling easier solvent evaporation and, at the same time, the entrapment of the more volatile components. By using such a system, it is possible to either transfer a part, or the total fraction, to the GC, as the heart-cuts can be collected in different vials prior to GC injection.
Dual Side-Port Syringe Interface
Another system, commonly used in combination with a PTV injector, is the dual side-port syringe interface (4). The latter, controlled by an autosampler, is characterized by two entrances: the lower port is used to transfer the fraction from the LC to the GC inlet via the syringe needle, while the upper port is used to direct the effluent to a waste line. The syringe is characterized by a plunger with a smaller outer diameter, with respect to the internal diameter of the barrel, and by the presence of a plug situated at the bottom of the plunger [Figure 1(b)].
Depending on whether the standby or cut mode is selected, the LC mobile phase is allowed to flow freely inside the syringe needle, either to the GC or to the waste line depending on the plunger position. In fact, when the plug is located between the LC effluent entrance and the needle, the mobile phase is directed to the upper waste line through the barrel; on the other hand, when the plug is located between the two ports, the LC effluent is directed to the GC injector.
Through Oven Transfer Adsorption Desorption (TOTAD) Interface
The TOTAD interface is a modified PTV injector, with regards to pneumatics, sample introduction, solvent elimination and operation mode, and was developed to allow the large volume injection (LVI) of both polar and non-polar solvents (5). The interface enables the focusing of analytes in a trap, held at a chosen temperature, while a continuous flow of helium maintains the column flow and eliminates the solvent from the trap. A scheme of the system during the transfer step is reported in Figure 2: the TOTAD interface is connected to the HPLC system by a six-port valve, and is equipped with a liner packed commonly with Tenax TA between two glass wool plugs.


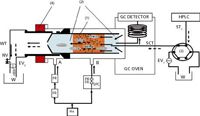
Figure 2
Initially, the interface is stabilized at a fixed temperature and a helium flow rate is used both to push the eluent from the LC through the sorbent and to prevent condensation of the vented solvent. The GC oven temperature is maintained at a lower temperature, with respect to the interface, during the transfer; once the transfer step is completed the temperature and helium flow are kept constant for 1 min to ensure that all the remaining solvent is eliminated from the glass liner and the transfer tubing. After, the helium flow is changed by means of the electrovalves (EV1-2) and the TOTAD interface is quickly heated, leading to the thermal desorption of the analytes, which are pushed by the helium towards the GC column.
On-column Based Interfaces
On-column injection systems involve fully or partially concurrent eluent evaporation, depending on the eluent evaporation and transfer rate, using an uncoated column or a syringe. Commonly, concurrent eluent evaporation is more suitable for higher boilers, such as wax esters, performed in the on-column injection mode using a syringe (5), while the retention gap and the loop-type techniques, using the on-column interface, were the method of choice for LC fractions containing volatile components (6). When using an uncoated column, the effluent is either directed to the GC or to a waste line by a switching valve.
A 0.32–0.53 mm i.d. uncoated widebore column is commonly used as the transfer line, permanently installed in the GC injector. In 2009, Biedermann and Grob presented an interesting article on the memory effects that are commonly observed with such an on-column transfer system and in the case of subsequent transfers (7); the authors provided a solution to such a drawback, namely the "Y" interface. The latter consists of a Y press-fit, commonly located outside the GC oven, which connects the end of the LC transfer line, a capillary tube fed by the GC carrier gas, and a precolumn located inside the GC injector.
Using such a configuration, memory effects can be reduced even though, when the Y-piece is installed outside the GC oven, a layer of effluent can persist in the portion of the pre-column located outside the GC oven. In such a case, high boiling solutes remain in the precolumn until they are flushed onto the heated part of the pre-column inside the oven by the subsequent transfer.
On-line LC-GC and LC×GC Applications In Food Analysis
On-line heart-cut LC-GC has been extensively described in the literature, while comprehensive applications have been reported only in the last decade. Following the case of the Ukrainian sunflower oil (2007/2008), contaminated with mineral oil at concentrations often above 1000 mg/kg, an increased attention on this type of contamination has been observed. The quali/quantitative analysis of mineral oil contamination, namely saturated hydrocarbons (MOSH) and/or aromatic hydrocarbons (MOAH), represents a challenging task due the complexity that often characterizes food samples. LC–GC is a prime choice for such applications because of the capability of the LC system to preseparate the mineral oil fraction from the rest of the sample.
Different approaches and food samples have been analysed for the determination of mineral oil contamination: grape seed oil (8), human body fat and milk (9), olive oils (4,5–10), sunflower seeds and oil (12–15). Tranchida et al. described a rapid heart-cutting LC–GC 4saturated hydrocarbons (MOSHs) in eighteen vegetable oil samples (4). The analyses were performed using an LC–GC system equipped with a dual side-port syringe interface. The LC was operated in the normal phase (NP) mode, under isocratic conditions, using hexane as mobile phase and a silica column; a 175 µL fraction, corresponding to a 30-s fraction, was transferred to the GC system equipped with a programmed temperature vaporizer. The total GC analysis time was less then 10 min because of the use of a micro-bore GC column and a fast oven temperature programme ramp. Various degrees of MOSH contamination were discovered, ranging from 7.6 mg/kg to 180.6 mg/kg. A chromatogram, related to contaminated pomace oil, is illustrated in Figure 3.


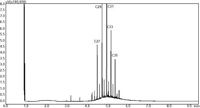
Figure 3
In 2009, Grob et al. reported a procedure to eliminate the interference of plant n-alkanes (10), typically from C23 to C33, for the accurate determination of mineral paraffins, consisting for the main part in isoalkanes. Mineral oil paraffins are usually quantified by measuring the area of a broad hump of unresolved iso-alkanes, characterized by the presence of alkanes of plant origin, with a strong predominance of the odd-numbered species. In some instances, the n-alkanes can be present in amounts that lead to GC column overloading, hindering the precise determination of the hump contour line. The authors proposed a method to isolate the paraffins from the sample matrix using a silica gel HPLC column. The hydrocarbon fraction was then transferred to a column packed with activated aluminium oxide: the latter retained the n-alkanes, whereas the iso-alkanes passed unretained. The mineral paraffins were finally analysed by GC-FID, using an on-column interface and the retention gap technique. The silica gel pre-separation did not provide a clear picture of the hump in a corn oil sample, while after the removal of the n-alkanes of plant origin the hump become clearly visible.
LC–GC has been used for the analysis of the edible-oil wax esters using different interfaces such as the on-column (15), or the TOTAD devices (16,17). Straight-chain wax esters have been shown to be useful indicators for the quality of edible oils (15). Such compounds are concentrated in the waxy surface layer of the olive and are poorly extracted by the oil derived from fruit pressing. The amounts extracted are higher for soft, possibly degraded olives, which give low quality oil. In 2007, the EU established a legal limit for total wax esters (C40–C46) in extra virgin oil (250 mg/kg) and refined olive oil (350 mg/kg) (18). The EU official method involves a pre-separation on a silica gel column, collection of the wax fraction and finally GC analysis; such a procedure requires a long sample preparation period and can be inaccurate as a result of sample manipulation.
On-line LC–GC, operated in the NP mode, has proved to be a powerful tool for the separation of the triglycerides from the wax ester fraction, and for the automated transfer of the same fraction to the GC, greatly reducing the sample preparation time. Biedermann et al. (15) reported the LC–GC–MS and comprehensive 2D GC (GC×GC) analysis of waxes contained in different edible oils. Concurrent eluent evaporation and an on-column interface were used because such high-boiling analytes were well-retained in the precolumn.The LC–GC–MS (TIC) and GC×GC–FID chromatograms showed the wax ester fractions from safflower and sunflower oils, namely two sampletypes difficult to distinguish based on other constituents; in particular, geranylgeraniol behenate was used to determine the presence of sunflower oil up to a level of 3%.
The authors concluded that even if GC×GC can be considered an excellent tool for separation and identification capabilities, it is preferable to perform quantitative determinations of such marker components through LC–GC, to increase the selectivity and MS sensitivity.
For the same analytical determination, the TOTAD interface was used by Aragòn et al. (16,17) for the evaluation of six monovarietal olive oil samples. The TOTAD interface has been described as suitable for the large volume GC injection of reversed phase (RP) polar solvents for the analysis of minor olive oil components (sterols, tocopherols, squalene, erythrodiol and uvaol) (11). The same interface has been used to determine pesticide residues in olive oil, through on-line reversed-phase (RP) LC–GC (5). In that investigation, the sample was analysed without any pretreatment, apart from filtration. Methanol and water were used as mobile phase in the LC step (a C4 column was used), while a column coated with 5% phenyl methyl silicone was used in the GC analysis. The RP LC conditions enabled the isolation of the pesticide fraction from the triglycerides, with the latter strongly retained on the hydrophobic stationary phase. All the pesticides eluted within the first 2 min under such conditions; the fraction volumes transferred to the GC ranged between 0.34 mL for atrazine and 2 mL for lindane.
The limits of detection reported for the pesticides analysed were lower than 0.5 mg/L, and were therefore lower than the maximum residue levels set by the FAO/WHO Codes Committee for several pesticides in olives and olive oil and by the European Union for olives. Figure 4 displays the GC chromatograms, after the LC preseparation, relative to the pesticide fraction of two olive oil samples.


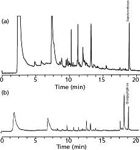
Figure 4
LC×GC instrumentation is much more complex than either GC×GC or LC×LC because of the necessity of an interface to allow the fractionation of the whole sample by LC, and the subsequent on-line transfer of each fraction to the GC device. However, the most important requisites that must be considered are essentially the same as in LC–GC. An additional aspect requiring consideration is related to the separation times in both dimensions. In GC×GC, the ratio between the analysis time of the first dimension versus the second dimension is very high, typically in the 600–800 range. Consequently, the fractionation of the first-dimension effluent and the second-dimension GC separation process are achieved simultaneously. On the contrary, in LC×GC techniques, such a ratio is very low (usually less than 10), and therefore the LC and GC processes cannot be performed at the same time and are decoupled.
At present, only a few LC×GC papers have been published in the food field. A completely automated LC×GC system, developed after an off-line optimization study, was applied to the analysis of food triacylglycerols (TAGs) (19) and fatty acid methyl esters (FAMEs) (20).
The LC×GC system was coupled to a time-of-flight (ToF) MS and a flame ionization detector, while the analyses were performed using LC stop-flow conditions. Two interfaces were used: the dual side-port syringe described above and a six-port switching valve, both of which provided satisfactory performance. The first-dimension effluent was split inside a hot PTV injector chamber to avoid overloading of the GC column; consequently, only a minor percentage of each LC fraction was transferred to the secondary column. Comprehensive LC–GC can be used to obtain a general overview of a sample because, in such an analysis, the classes of compounds are separated in different zones of the 2D space, generating a compositional fingerprint. Figure 5 shows an example of a fingerprint analysis of an olive oil achieved with LC×GC by using a diolmodified silica HPLC column in the first dimension and a non-polar GC column in the second dimension.


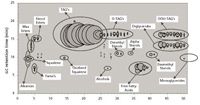
Figure 5
It must be added that, even if the amount of information achieved was considerable, the total run time (≈ 20 h) was not compatible for routine applications.
Danilo Sciarrone1,2 , Peter Quinto Tranchida1 , Paola Dugo1,3 and Luigi Mondello1,3 1Dipartimento Farmaco-chimico, Facoltà di Farmacia, Università di Messina, Messina, Italy, 2 Chromaleont s.r.l. A spin-off of the University of Messina, c/o University of Messina, Messina, Italy, 3 Centro Integrato di Ricerca (C.I.R.), Università Campus Bio-Medico, Roma, Italy.
References
(1) K. Grob, J. Chromatogr. A, 892(1–2), 407–420 (2000).
(2) T. Hyötyläinen and M-L. Riekkola, J. Chromatogr. A., 1000(1–2), 357–384 (2003).
(3) http://www.chem.agilent.com/Library/technicaloverviews/Public/5990-8025EN.pdf
(4) P.Q. Tranchida, M. Zoccali, G. Purcaro, S. Moret, L. Conte, M. Beccaria, P. Dugo and L. Mondello, J. Chromatogr. A, 1218(42), 7476–7480 (2011).
(5) R. Sanchez, A. Vàzquez, D. Riquelme and J. Villèn, J. Agric Food Chem., 51(21), 6098–6102 (2003).
(6) E. Boselli, K. Grob and G. Lercker, J High Resol Chromatogr., 22(6), 327–334 (1999).
(7) M. Biedermann and K. Grob, J. Chromatogr. A., 1216(49), 8652–8658 (2009).
(8) D. Fiorini, K. Fiselier, M. Biedermann, R. Ballini, E. Coni and K. Grob, J. Agric. Food Chem., 56(23), 11245–11250 (2008).
(9) N. Concin, G. Hofstetter, B. Plattner, C. Tomovski, K. Fiselier, K. Gerritzen, S. Fessler, G. Windbichler, A. Zeimet, H. Ulmer, H. Siegl, K. Rieger, H. Concin and K. Grob, Food Chem. Toxicol., 46(2), 544–552 (2008).
(10) K. Fiselier, D. Fiorini and K. Grob, Anal. Chim. Acta, 634(1), 102–109 (2009).
(11) J.M. Cortès, R. Sànchez, J. Villèn and A. Vàzquez, J. Agric Food Chem., 54(19), 6963–6968 (2006).
(12) K. Fiselier and K. Grob, Eur. Food Technol, 229(4), 679–688 (2009).
(13) M. Biedermann and K. Grob, J. Sep. Sci., 32(21), 3726–3737 (2009).
(14) M. Biedermann and K. Grob, J. Lipid Sci. Technol, 111(4), 313–319 (2009).
(15) M. Biedermann, P. Haase-Aschoff and K. Grob, Eur. J. Lipid Sci. Technol.,110(12), 1084–1094 (2008).
(16) A. Aragòn, R.M. Toledano, J.M. Cortès, J. Villèn and A. Vàsquez, Food Chem., 129(1), 71–76 (2011).
(17) A. Aragòn, J.M. Cortès, R.M. Toledano, J. Villèn and A. Vàsquez, J. Chromatogr. A, 1218(30), 4960–4965 (2011).
(18) EU: Commission Regulation (EC) No 379/1999 amending Regulation 2568/91 on the characteristics of olive oil and olive-residue oil and on the relevant methods of analysis. Office J Eur Commun., L46, 15 (1999).
(19) H-J. Janssen, W. Boers, H. Steenbergen, R. Horsten and E. Flöter, J. Chromatogr. A, 1000(1–2), 385–400 (2003).
(20) S. de Koning, H-J. Janssen, M. van Deursen and U.A.Th. Brinkman, J. Sep. Sci., 27(5–6), 397–409 (2004).


Analytical Challenges in Measuring Migration from Food Contact Materials
November 2nd 2015Food contact materials contain low molecular weight additives and processing aids which can migrate into foods leading to trace levels of contamination. Food safety is ensured through regulations, comprising compositional controls and migration limits, which present a significant analytical challenge to the food industry to ensure compliance and demonstrate due diligence. Of the various analytical approaches, LC-MS/MS has proved to be an essential tool in monitoring migration of target compounds into foods, and more sophisticated approaches such as LC-high resolution MS (Orbitrap) are being increasingly used for untargeted analysis to monitor non-intentionally added substances. This podcast will provide an overview to this area, illustrated with various applications showing current approaches being employed.


