Resolving Separation Issues with Computational Methods: What Is the Retention Time, Exactly?
Our attention is typically focused on chromatography in the laboratory, yet ultimately, a liquid chromatograph (LC) or gas chromatograph (GC) only produces a signal—a chromatogram—from which information still must be distilled. Fortunately, software tools can generally help us quite well with our contemporary data sets. However, as separation technology improves, both the challenges and the need for methods to obtain information from the data increase. In this series of articles, we will discuss different aspects of data analysis and learn how to extract different pieces of information from our chromatograms, while also understanding the assumptions and risks used to help us interpret the value of the information. We start with simple, yet important, information bits, which we will tie together in future articles. In this way, we can continue solving separation problems beyond the limits of our chromatographs. Each article contains a reference to a web tutorial where the gained knowledge and skills can be practiced and applied to a real signal (1).
Relevance of the Retention Time
In this first article, we inspect the determination of the retention time, which is—next to the peak area—arguably the most basic information of interest from a peak. Its most elementary application is the qualitative identification of a known compound by means of reference information. For example, if our analyte of interest is usually eluted at 3.7 min for a given method, then we tend to identify it in a new measurement by looking for a peak at that specific time point.
The retention time is also of importance for fundamental research, including (i) the prediction of retention times in method development; (ii) retention modeling to characterize selectivity; and (iii) assessing the performance of chromatographic systems. In future articles, we learn about how data processing affects the retention time and subsequent properties of our signal (see Figure 1).


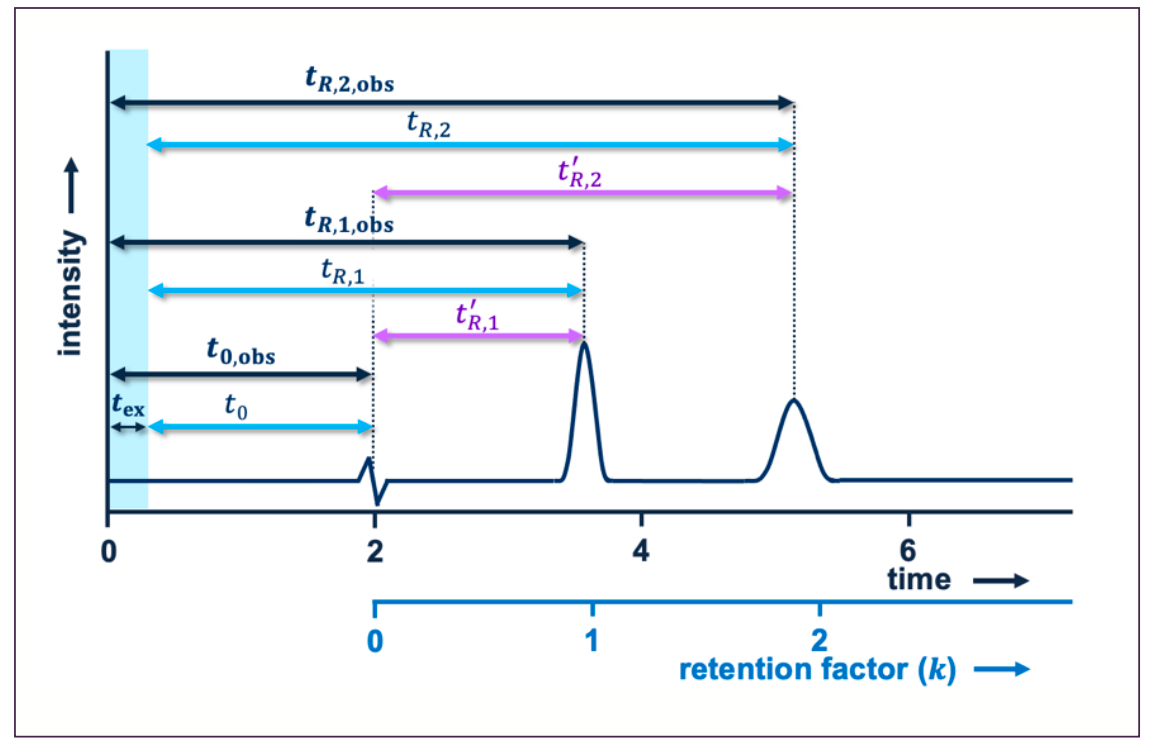
FIGURE 1: Schematic example of a chromatogram that presents different presentations of the retention time.
How do we determine the retention time? To understand our computational task, it is first relevant to refresh our perspective on what the retention time actually represents for our situation. The retention time is the time it takes for the analytes to be transported through a chromatographic column.
At this point, it is important to realize that the recorded chromatogram reflects the time at which the analytes are observed at the detector (tr,obs), not at the exit of the column. For fundamental studies of retention, it is thus important to subtract extra-column time (tex) from the observed retention time. The tex may be easily obtained by simply removing the column and measuring the elution time of an analyte. However, for most practical applications, its value is so small that it may reasonably be ignored. In some cases, the net retention time (t'R) is used where the dead time
(t0 or tm) is subtracted. Other cases use the relative retention time, where the retention time of one compound is compared to another.
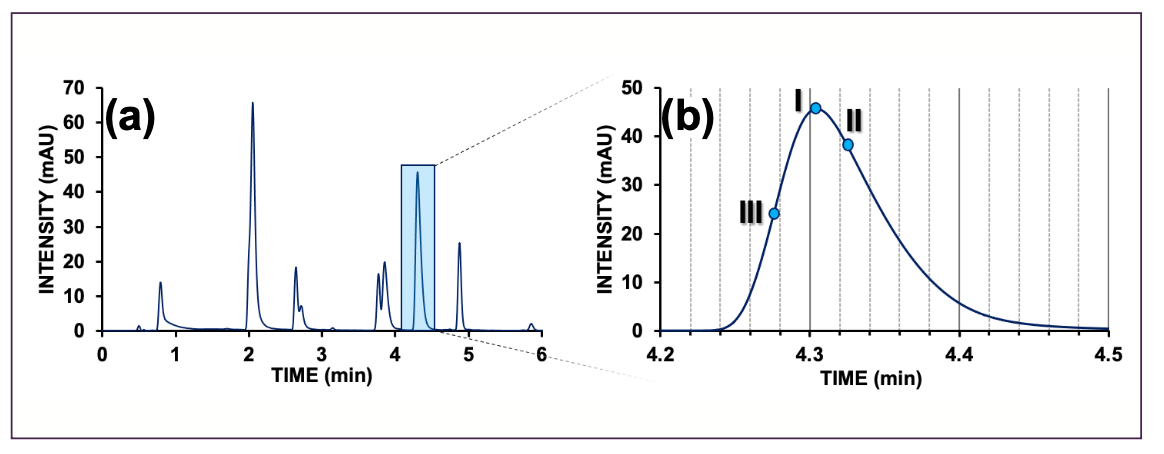
From the moment that we inject our analytes, various band broadening processes occur as the analytes migrate through the chromatographic system. This results in our chromatographic peak, which never represents a singular discrete retention time, but rather a distribution of retention times. This is depicted in the chromatogram shown in Figure 2b, which highlights one of the peaks.
The most convenient method to determine the retention time is by simply regarding the apex, or maximum, of the peak (Figure 2b, Point I). This is especially correct when the peak is symmetrical, as is the case with the well-known Gaussian distribution (also known as normal distribution).
Intuitively, the peak apex may be found by finding the maximum value of a peak. This can be literally the time associated with the point of the peak with the highest y-value and is typically identified by functions that seek data points that are larger than (multiples of) its neighbors. Alternative methods include taking the derivative and identifying when it crosses zero, finding the minimum of the second derivative, and fitting a bell curve to the signal and interpolating its maximum. The strategy highly hinges on the characteristics of the chromatogram and the degree of robustness required.
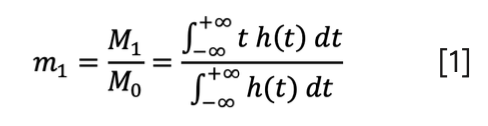
However, peaks in chromatography are—especially in the case of LC—rarely symmetrical. An arguably more appropriate method to determine the retention time is by computing the mean of the chromatographic distribution (Figure 2b, Point II), which represents its center of gravity. The most accurate way to obtain this value is through the use of the first statistical moment (equation 1).

 Example of a small molecule separation by reversed-phase. (b) Highlighted peak with different retention time definition points references on the peak. See text for explanation. AU = arbitrary units.")
FIGURE 2: (a) Example of a small molecule separation by reversed-phase. (b) Highlighted peak with different retention time definition points references on the peak. See text for explanation. AU = arbitrary units.
The first normalized statistical moment (m1) is equal to the integral of the product of the peak signal and time (the gross first moment, M1), divided by the integral of the peak (that is, its area, M0).


The advantage of the first-moment method is that it accounts for any peak asymmetry, but the challenge is that it is not easily and robustly obtained. We will see in a future installment that the statistical moments rely heavily on a correct definition of the start and end of the peak, which is especially tricky when peaks are partially co-eluted. This explains why it is more robust and, thus, more common to use the apex of the peak.
Finally, a rare determination of the retention time considers the start or frontal slope of the peak (Figure 2b, Point III). Although this is never useful for calculating the retention factor, it can sometimes be useful in cases of preparative separations, when the column is intentionally overloaded. Here, the interest is to identify when the peak is starting to elute so that it may be fractionated.
Having determined the retention time correctly, you are now able to compare the value between chromatograms or against reference standards. You may also consider tables or databases of retention values. However, in that case, it is essential to transform the retention time to dimensionless parameters that are much less dependent on experimental conditions, such as column dimensions and flow rates.
Reference
(1) LCGC Data Tutorials. Chemometrics & Advanced Separations Team 2020. http://lcgc.cast-amsterdam.org/ (accessed 2023-11-27)
About the Author
Bob W.J. Pirok is an assistant professor of analytical chemistry at the Van ‘t Hoff Institute for Molecular Science (HIMS) at the University of Amsterdam. Direct correspondence to: B.W.J.Pirok@uva.nl


TD-GC–MS and IDMS Sample Prep for CRM to Quantify Decabromodiphenyl Ether in Polystyrene Matrix
April 26th 2024At issue in this study was the certified value of decabromodiphenyl ether (BDE 209) in a polystyrene matrix CRM relative to its regulated value in the EU Restriction of Hazardous Substances Directive.

LC–MS/MS-Based System Used to Profile Ceramide Reactions to Diseases
April 26th 2024Scientists from the University of Córdoba in Córdoba, Spain recently used liquid chromatography–tandem mass spectrometry (LC–MS/MS) to comprehensively profile human ceramides to determine their reactions to diseases.

High-Throughput 4D TIMS Method Accelerates Lipidomics Analysis
April 25th 2024Ultrahigh-pressure liquid chromatography coupled to high-resolution mass spectrometry (UHPLC-HRMS) had been previously proposed for untargeted lipidomics analysis, but this updated approach was reported by the authors to reduce run time to 4 min.


Traditional Chinese Medicine’s Effects on Liver Cancer Measured Using New UHPLC–QTOF-MS System
April 22nd 2024Scientists from Anhui University of Chinese Medicine in Hefei, China recently investigated the mechanisms behind what makes huachansu tablets, a type of traditional Chinese medicine (TCM), effective against liver cancer.

