Separation of All Classes of Carbohydrates by HPAEC-PAD

High performance anion-exchange chromatography coupled with pulsed amperometric detection (HPAEC-PAD) is a potential method of choice for the analysis of carbohydrates.
Carbohydrates are essential to a wide range of industries, including food, pharmaceuticals, and consumer goods. Within the food industry, carbohydrates stand out as one of the key factors in determining the nutritional value of a product. Consequently, the analysis of carbohydrates has become an indispensable tool in the food industry. Various techniques are available for carbohydrate analysis, each with its own merits and disadvantages (1). This article focuses on high performance anion-exchange chromatography in combination with pulsed amperometric detection (HPAEC-PAD) as a preferred technique for carbohydrate analysis. HPAEC allows the separation of complex mixtures of carbohydrates, for example between mono-, di-, oligo-, and polysaccharides. Furthermore, isomeric sugars such as epimers, or disaccharides with different linkage positions, are known to be separated using HPAEC (2,3). The use of pulsed amperometric detection (PAD) in combination with HPAEC enables the direct analysis of carbohydrates, eliminating the necessity for derivatization (2,3). Additionally, PAD enables sensitive detection of carbohydrates down to pico- or femtomole levels (2).
The history of carbohydrate analysis using HPAEC-PAD started in the late 1950s when the ionization of hydroxyl groups of carbohydrates in alkaline conditions was shown, revealing the potential for carbohydrate separation using anion-exchange chromatography (AEC) (4). At that time, the lack of strong and commercially available anion-exchange resins capable to withstand the harsh alkaline conditions limited the practical use of this discovery. It was not until 1983 that Rocklin and Pohl introduced the first AEC for carbohydrates using a 10-µm particle coated with a monolayer anion-exchange latex (5). Since then, the development of carbohydrate analysis using HPAEC-PAD has significantly progressed through improvements in both the chemistry of the anion-exchange resins and the reduction in particle sizes.
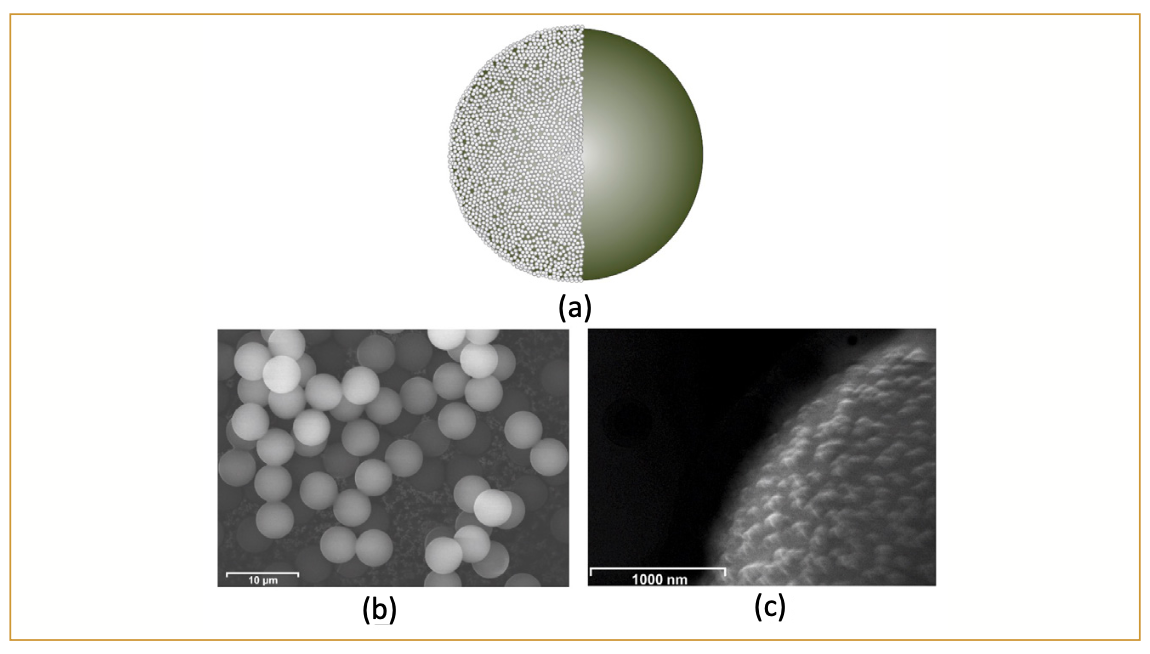
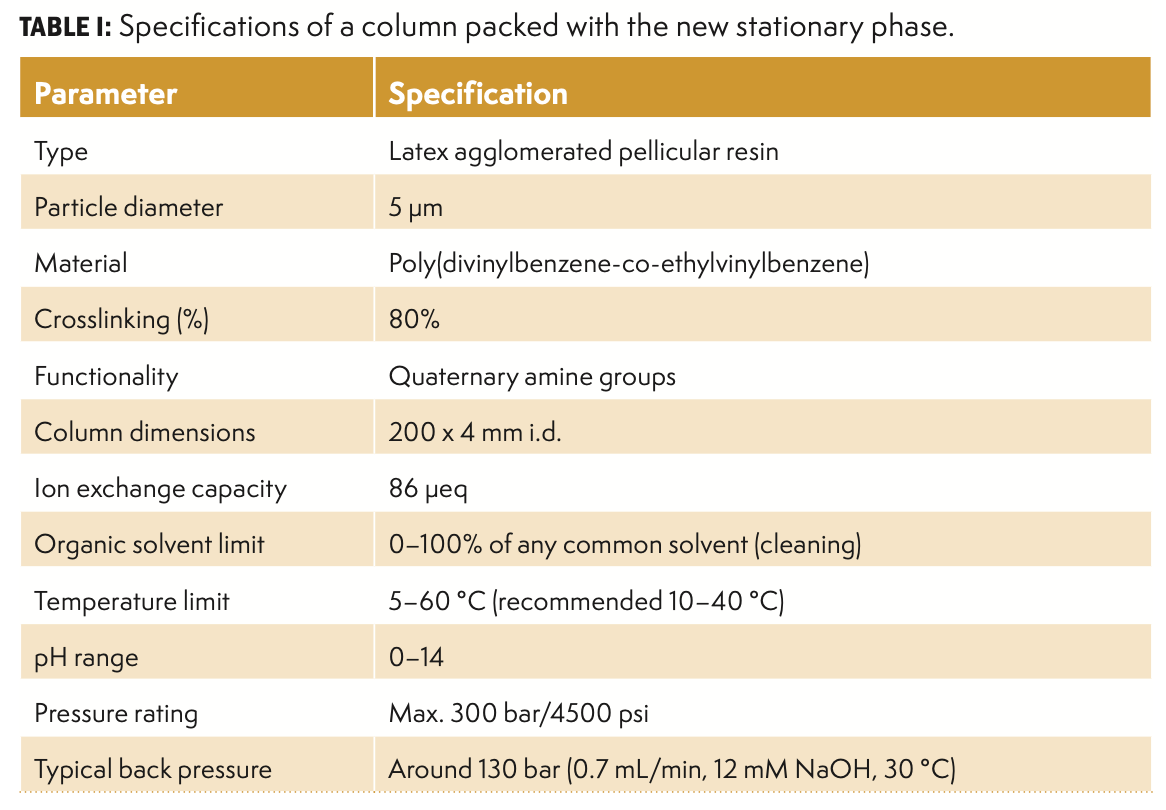
The separation capability of a stationary phase depends on several factors, such as the type of porous resin (microporous, macroporous, or super macroporous), particle sizes (substrate and latex bead diameters), crosslinking degree of the substrate and latex beads, and type of anion-exchange group. For instance, the particle sizes have evolved from 10 µm to smaller dimensions, such as 8.5 µm, 6 µm, 5.5 µm, 4 µm, and sub-4-µm particles, to improve separation efficiencies and shorten analysis time (6–8). Using smaller particle sizes with improved chemistries and stationary phase architecture enabled fast, high-resolution anion-exchange separation of complex carbohydrate samples (6–8). Nevertheless, it is evident that smaller particle sizes will give rise to higher column back pressures, especially the use of columns with sub-5-µm particles, which puts some limitations on the metal-free ion chromatography (IC) instrumentation that can be used for fast, high-resolution HPAEC-PAD analysis. The construction materials of the equipment, capillaries, and column blanks should have a sufficiently high maximum pressure rating to operate with such columns. Therefore, a novel agglomerated pellicular anion-exchange stationary phase for carbohydrate analysis has been developed and evaluated. The new stationary phase is based on a monodisperse 5-µm resin of a highly crosslinked poly(divinylbenzene-co-ethylvinylbenzene) copolymer coated with quaternary amine functionalized latex nanoparticles. A 200 × 4 mm i.d. column packed with these highly uniform 5-µm resin particles produces relatively low column back pressures, reaching only approximately 130 bar under typical separation conditions (0.7 mL/min, 12 mM NaOH, 30 °C). The schematic in Figure 1 illustrates the particle architecture of the new stationary phase, and the monodispersity of the particles is evident from the provided scanning electron microscope (SEM) image. The monodisperse particle size of the resin should enable high-resolution separation in contrast to resins with a larger particle size distribution. In this article, we demonstrate the performance of this new stationary phase in the separation of all classes of carbohydrates, ranging from mono-, di-, and trisaccharides to oligo- and polysaccharides. The separation was performed using a 200 × 4 mm i.d. analytical column packed with this new stationary phase. The specifications of the column are shown in Table I.

 Schematic of the individual resin particle of the new stationary phase (SweetSep AEX200). The particle consists of a 5-μm non-porous poly(DVB-co-EVB) core (green) coated with latex particles (white) with quaternary amine anion-exchange groups (for clarity, only half of the nano-beads are shown). (b) SEM picture of mono-disperse resin particles, scale bar 10 μm. (c) SEM picture of the latex agglomerated surface of the mono-disperse resin particles, scale bar 1000 nm.")
FIGURE 1: (a) Schematic of the individual resin particle of the new stationary phase (SweetSep AEX200). The particle consists of a 5-μm non-porous poly(DVB-co-EVB) core (green) coated with latex particles (white) with quaternary amine anion-exchange groups (for clarity, only half of the nano-beads are shown). (b) SEM picture of mono-disperse resin particles, scale bar 10 μm. (c) SEM picture of the latex agglomerated surface of the mono-disperse resin particles, scale bar 1000 nm.


Materials and Methods
Materials
All chemicals were purchased from Sigma-Aldrich, Carbosynth, or Alfa Aesar unless stated otherwise. All carbohydrate standards were of analytical grade. Sodium hydroxide solution (50% w/w), high performance liquid chromatography (HPLC) grade sodium acetate trihydrate, and LC–mass spectrometry (LC–MS) grade acetonitrile were purchased from Fisher Scientific. Ultrapure water was obtained using a Merck Synergy Water Purification UV System (resistivity 18.2 MOhm/cm, TOC ≤5 ppb). All mobile phases were manually prepared, sparged, and blanketed with nitrogen 5.0 (nitrogen ≥ 99.999%) to minimize the build-up of carbonate ions and to ensure a reproducible analysis.
General Methods
All analyses were performed using the ALEXYS Carbohydrate Analyzer (Antec Scientific). This metal-free, bio-inert analyzer consists of a quaternary low-pressure gradient (LPG) pump, autosampler, column thermostat, eluent tray, and electrochemical detector. During the preparation of the mobile phase, borate ions may be present in low parts-per-billion (ppb) concentrations, which can lead to peak tailing of some carbohydrates such as fructose and lactulose. Therefore, as a precaution, a borate ion inline trap column (50 × 4 mm i.d., Antec Scientific) was installed between the pump and the injector. A 200 × 4 mm i.d. analytical column packed with the new stationary phase (SweetSep AEX200) was used for all experiments. The separation temperature was set to 30 °C and an injection volume of 10 µL was used in all applications. For pulsed amperometric detection, the SenCell electrochemical flow cell was used (9). This flow cell has a confined wall-jet design and consists of a gold working electrode (WE), HyREF (Pd/H2) reference electrode (RE), and stainless-steel auxiliary electrode (AE).
The flow cell has an adjustable spacer and was set to position 2, which corresponds to a 50-µm spacing and a 160-nL working volume. A four-step potential PAD waveform was applied for detection: E1, E2, E3, and E4 were +0.10, –2.0, +0.6, and –0.1 V, respectively, with pulse duration of t1 = 400 ms, t2 = 20 ms, t3 = 10 ms, and t4 = 70 ms. The signal (cell current) is acquired for 200 ms with a sampling rate of 10 ms during t1 between t = 0.20–0.40 s. The signal output is the average cell current in nA measured during this 200-ms time period. The data rate of the signal output is 2 Hz, which corresponds to the 500-ms pulse time duration of the applied four-step potential waveform. This particular four-step waveform has several benefits: (1) long-term reproducible response factor for all analytes and (2) minimal electrode wear (10). The detection temperature was set to 35 °C. The stock solutions of the individual standards were prepared in 95:5 (v/v%) water/acetonitrile with a concentration of 10 mM. Acetonitrile was added to prevent fast degradation and minimize bacterial or fungal growth. The stock solutions of the standards were stored in the freezer at −20 °C and were stable for more than a month. The working standard mixes were prepared by serial dilution of the stock standards with deionized (DI) water.
Evaluation of Column Performance And Long-Term Stability
Separations of a mix of 10 sugar standards were performed on the aforementioned analytical column to evaluate its performance and long-term stability. The mix of standards consists of fucose, arabinose, galactose, glucose, sucrose, fructose, allolactose, lactose, lactulose, and epilactose in DI water. The final concentration of the mix was 10 µM. The separation was based on a step gradient. During the first 20 min, the sugars are eluted under isocratic conditions using 12 mM NaOH as the mobile phase at a flow rate of 0.7 mL/min. The isocratic elution step was followed by a column clean-up step using 100 mM NaOH for 5 min at 0.8 mL/min and equilibration to the starting conditions for 17.5 min, resulting in a total run time of 42.5 min. The long-term stability of the column was assessed by repetitive 10 µL injections of the standard mix solution for about 4 months, resulting in more than 2600 chromatographic runs.
Application 1: Sugars in Honey
A 10 µM mix of 14 sugars in DI water commonly found in honey (trehalose, glucose, fructose, isomaltose, sucrose, kojibiose, gentiobiose, turanose, palatinose, melezitose, raffinose, 1-kestose, maltose, and erlose) was used as the working standard for this application. A wild honey obtained from a Swiss beekeeper was used as a sample. The honey sample was harvested during the summer season of 2023. The honey samples were prepared by weighing 100 mg of the honey and dissolving it in 100 mL DI water to achieve a concentration of 1 g/L. Subsequently, the samples were filtered over a 0.22-µm polyethersulfone (PES) syringe filter (GVS Filter Technology) into the vials for injection. The separation was performed on the HPAEC-PAD system described above, using the following step-gradient program: isocratic elution at 0.7 mL/min using 68 mM NaOH for 25 min, followed by a 5-min column clean-up step using 100 mM NaOH + 100 mM NaOAc (sodium acetate), and equilibration to the starting conditions for 15 min. The total run time of each run was 45 min. For quantification purposes, the honey sample was diluted into concentrations of 0.1 g/L and 0.01 g/L using serial dilution with DI water.
Application 2: Profiling of Fructooligosaccharides (FOS)
Inulin from chicory was used as a sample to obtain the fructooligosaccharides profile. The sample was prepared by dissolving a known amount of inulin powder in DI water, followed by filtration over a 0.22-µm PES syringe filter and dilution to the final concentration of 200 ppm. The separation was performed on the same HPAEC-PAD system as mentioned earlier, using a gradient program with a flow rate of 0.8 mL/min. The gradient program started with 100 mM NaOH, and a linear gradient to 100 mM NaOH + 180 mM NaOAc was applied until t = 12 min. Subsequently, a more gentle linear gradient to 100 mM NaOH + 450 mM NaOAc was applied until t = 60 min. The system was equilibrated to the starting condition for 15 min, resulting in a total run time of 75 min. Initial peak assignments were based on the elution pattern of glucose (G), fructose (F), sucrose (GF), 1-kestose (GF2), nystose (GF3), and fructosyl nystose (GF4). Because of the lack of commercial standards for sugars with a high degree of polymerization (DP), further assignments were based on the assumption that the retention of a homologous series of carbohydrates increases as the DP increases.
Results and Discussion
Column Performance and Long-Term Stability
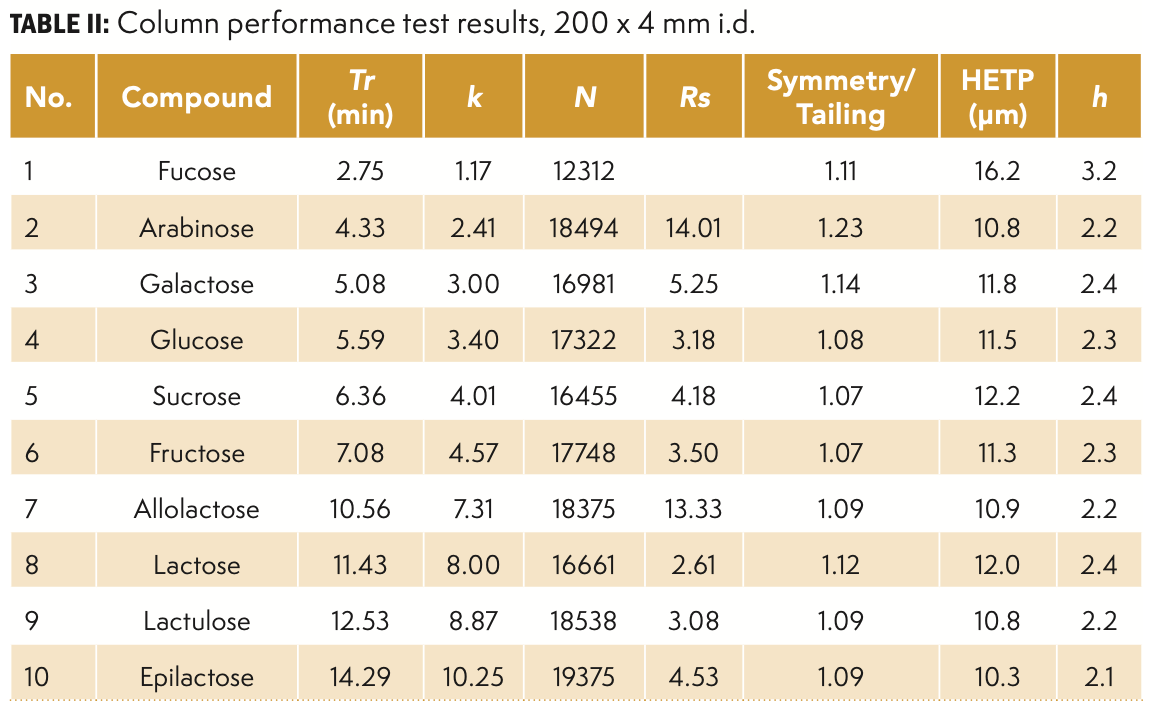
The column performance and long-term stability assessment of a 200 × 4 mm i.d. column were conducted based on the separation of 10 sugars. The 10 sugars were carefully chosen to cover a range of molecular structures of saccharides: (1) monosaccharides (glucose) or disaccharides (sucrose); (2) isomers (allolactose and lactose); (3) epimers (galactose and glucose); (4) hexose (fructose) or pentose (arabinose) for monosaccharides; and (5) deoxy sugars (fucose). The separation of the 10 sugars on the analytical column was achieved under isocratic elution condition with 12 mM NaOH at the flow rate of 0.7 mL/min. Under this condition, all 10 sugars were baseline separated (resolution ≥1.5). The symmetry and tailing factors for the 10 sugars were excellent, with a value of approximately 1.1 for most sugars except for arabinose (1.2). The plate numbers of all sugars range between about 12300 to 19300, and the reduced plate heights (h) for most of the sugars were close to the ideal value of 2.0 for a 200 mm column with a 5-µm particle size. All column parameters are provided in Table II.


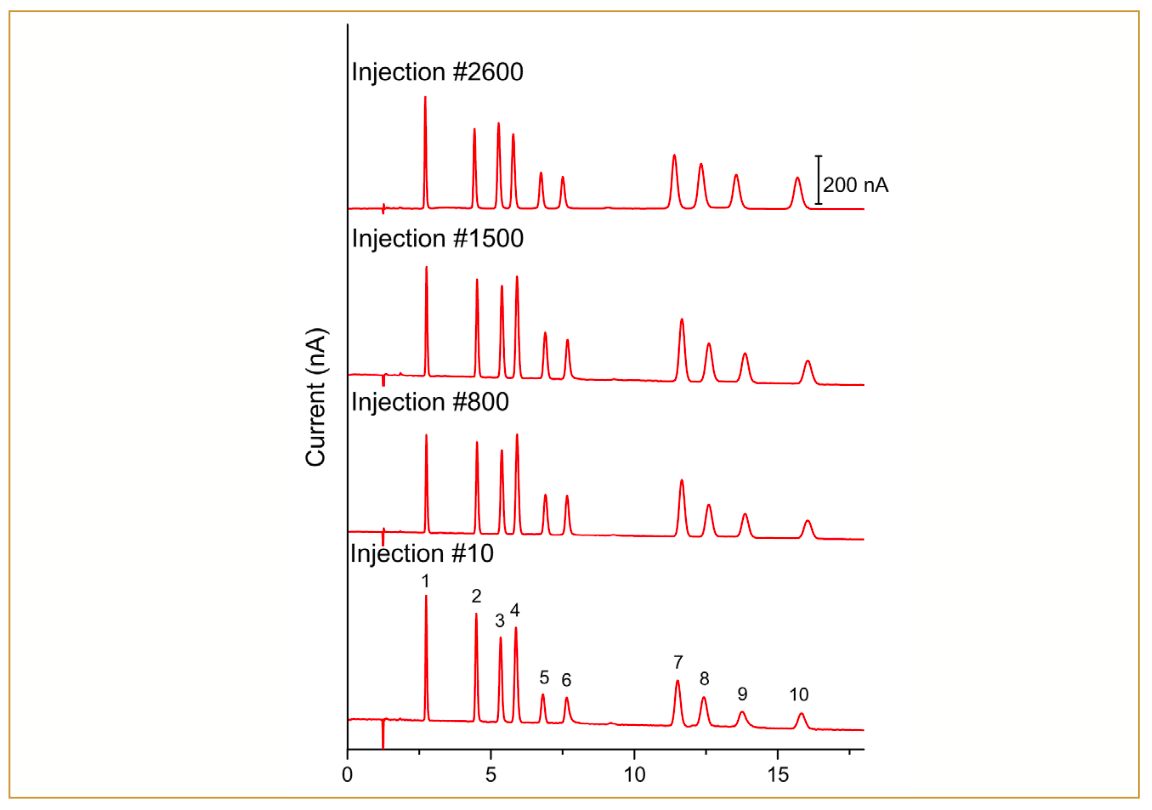
The long-term stability of the 200 × 4 mm i.d. column was assessed using the same 10-sugar mix under the same conditions. The overlay chromatograms of several selected injections over four months, during which more than 2600 injections were conducted, are provided in Figure 2. The retention times for all 10 compounds remained stable over this period. The small variations in peak height and peak area were caused by differences in the manual preparation or aging (degradation) of the standard mix. The long-term stability of the column was also assessed based on the loss of the plate numbers and changes in tailing factors. There was no observed loss in plate numbers nor increase in tailing factors, which indicates that columns packed with this resin result in very stable columns with outstanding lifetime.

 fucose; (2) arabinose; (3) galactose; (4) glucose; (5) sucrose; (6) fructose; (7) allolactose; (8) lactose; (9) lactulose; and (10) epilactose.")
FIGURE 2: Overlay of injections #10, #800, #1500, and #2600 after 4 months of continuous injections of a carbohydrate mixture. Peak labels: (1) fucose; (2) arabinose; (3) galactose; (4) glucose; (5) sucrose; (6) fructose; (7) allolactose; (8) lactose; (9) lactulose; and (10) epilactose.
Sugars in Honey
Honey is a complex natural substance with a promising potential for various health benefits, and it consists of approximately 80% carbohydrates (11). Because of its economic appeal, honey is susceptible to food fraud and adulteration. For instance, in 2021 the value of imported honey was 2.32 €/kg, whereas commonly used adulterants such as rice syrups cost approximately 0.40–0.60 €/kg in the European Union (EU) (12). The composition and definition of honey in the EU are regulated by the EU Honey Directive 2001/110/EC (13). The directive specifies the criteria for unadulterated honey products including the threshold of sugars in honey. Therefore, HPAEC-PAD is an attractive method that can quantify sugars in honey to check the authenticity of honey samples.
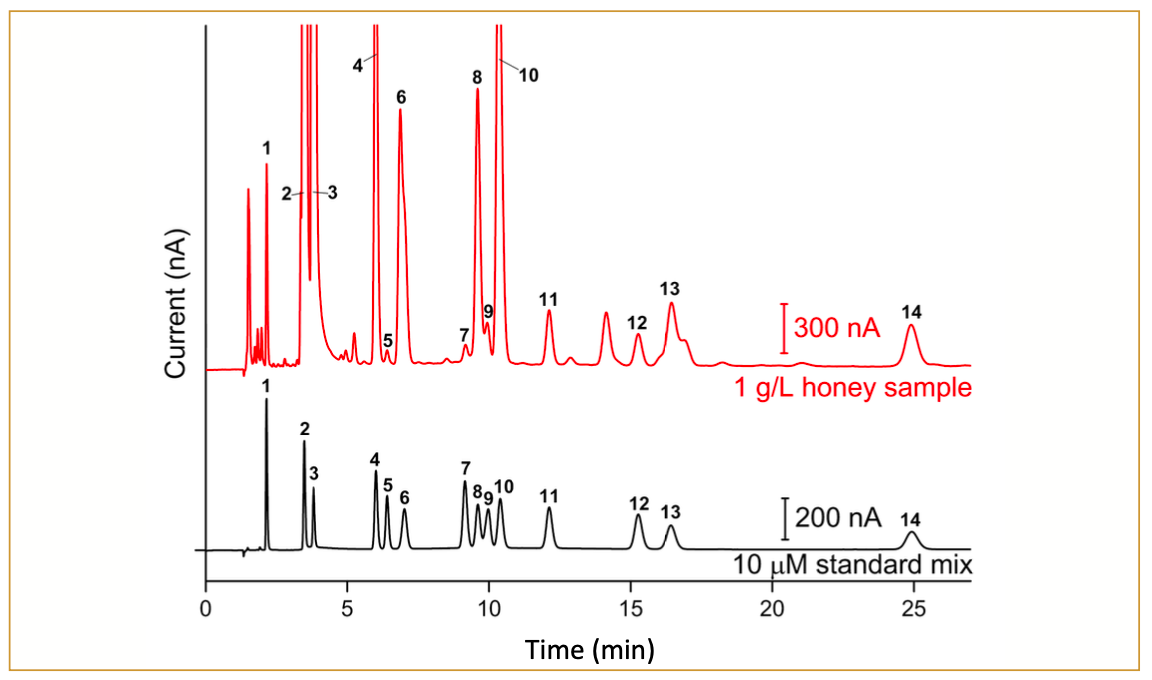
The separation of the 14 sugars commonly found in honey using the aforementioned column is depicted in Figure 3. Out of the 14 sugars, two are monosaccharides (glucose and fructose), eight are disaccharides (trehalose, isomaltose, sucrose, kojibiose, gentiobiose, turanose, palatinose, and maltose), and four are trisaccharides (melezitose, raffinose, 1-kestose, and erlose). All sugars were eluted within 25 min, and most of the sugars were baseline separated (R ≥1.5), except for palatinose and melezitose (resolution 1.1 and 1.2, respectively). The peak efficiency for all sugars ranged between 8000–16000 plates, and all peaks exhibited no significant tailing (tailing factor between 1.0–1.2).

 and 1 g/L honey sample obtained from Swiss beekeeper (red lines). Peak labels: (1) trehalose; (2) glucose; (3) fructose; (4) isomaltose; (5) sucrose; (6) kojibiose; (7) gentiobiose; (8) turanose; (9) palatinose; (10) melezitose; (11) raffinose; (12) 1-kestose; (13) maltose; and (14) erlose.")
FIGURE 3: Overlay chromatograms of 10 μL injections of 10 μM standard mix of 14 sugars commonly found in honey (black lines) and 1 g/L honey sample obtained from Swiss beekeeper (red lines). Peak labels: (1) trehalose; (2) glucose; (3) fructose; (4) isomaltose; (5) sucrose; (6) kojibiose; (7) gentiobiose; (8) turanose; (9) palatinose; (10) melezitose; (11) raffinose; (12) 1-kestose; (13) maltose; and (14) erlose.
The presented method was validated by testing the linearity, repeatability, and determining the limits of detection (LODs). The linearity of the method was investigated in the concentration range of 0.01–50 µM. In this concentration range, the linearity is excellent with the correlation coefficients (r) >0.999 for almost all sugars except for turanose (r = 0.9986). A total of 10 repetitive injections of the 10 µM standard mix in DI water were performed to assess the repeatability of the method. Excellent repeatability was found as shown by the very small relative standard deviations (RSDs) of the retention times, peak heights, and peak areas (<0.3%, <0.5%, and <0.6%, respectively). The LODs were calculated based on the International Council for Harmonization (ICH) guidelines (that is, LODs were calculated as the analyte response corresponding to 3× the ASTM noise, with an average peak-to-peak baseline noise of 10 segments of 0.5 min). The excellent sensitivity of the method is evident from the low detection limits for all sugars (<70 nM).
To demonstrate the applicability of the method, a summer honey sample obtained from the Swiss beekeeper was tested. The chromatogram of the 10 µL injection of the honey sample is shown in Figure 3. All 14 sugars were detected in the honey, with glucose and fructose being the most dominant sugars. Quantification of the sugars shows that the glucose, fructose, sucrose, and maltose contents are 27.4 g, 31.9 g, 0.1 g, and 0.8 g per 100-g honey products, respectively. These values align with the specified criteria of unadulterated honey defined by the EU Honey Directive 2001/110/EC (13). Overall, the presented method shows the outstanding separation of sugars using the new stationary phase and sensitive detection of the sugars in honey using pulsed amperometric detection.
Profiling of Fructooligosaccharides (FOS)
Fructooligosaccharides are polymers consisting of fructose found widely distributed in nature as plant storage carbohydrates. Fructooligosaccharides are a form of dietary fiber, and they can serve as an energy source for the gut microbiota (14). Many plant species, including wheat, onion, bananas, garlic, and chicory, contain inulin-type fructooligosaccharides (ITF). ITF exists as a blend of polymers with degrees of polymerization (DP) ranging from 2 to 60 subunits (14). Some ITFs in plants have a glucose unit at the reducing end, while others do not include a glucose residue at all. Therefore, all ITFs can be described with the generic chemical structure GFn (with G as optional glucose, F as fructose, and n indicating the number of fructose moieties).
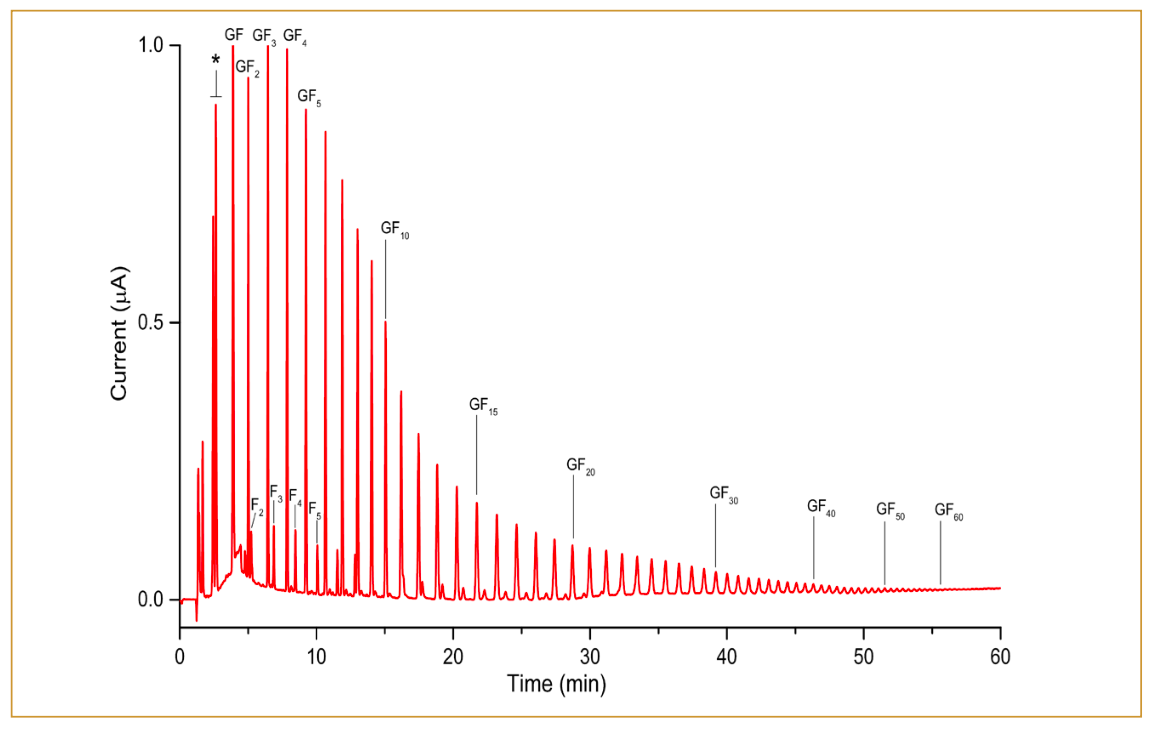
The column described earlier was employed to obtain a fructooligosaccharides profile in inulin from the chicory sample. A chromatogram in Figure 4 illustrates the profile of fructooligosaccharides from the sample. Based on the chromatogram, inulin predominantly consists of GFn-type fructooligosaccharides ranging from DP3 (GF2) to approximately DP61 (GF60). Additionally, this sample contains a substantial amount of free sugars (glucose, fructose, and sucrose). Although the GFn and Fn type fructooligosaccharides are baseline separated until GF7 and F7, they exhibit slightly different retention behavior. Consequently, they unavoidably overlap, leading to the coelution of components starting from GF8 and F8. The GF12 and F12 were observed to be baseline separated again until approximately GF22 and F22. Further, F23 onwards was not observed, whereas GFn-type was still detected up to approximately GF60. It is important to note that the chain-length distribution should only be interpreted qualitatively because the response factor decreases with increasing chain length, and therefore, it does not represent the exact quantitative distribution. Overall, the presented method demonstrated excellent separation of inulin-type fructooligosaccharides.

 are labeled with an asterisk.")
FIGURE 4: Chromatogram of 10-μL injections of 200 ppm inulin from chicory. Monosaccharides (glucose and fructose) are labeled with an asterisk.
Conclusion
A new anion-exchange stationary phase based on 5-µm particles was developed, and it enables fast, high-resolution separation of carbohydrates at moderate column back pressures. A 200 mm × 4 mm i.d. analytical column based on the stationary phase demonstrated a superior performance with reduced plate heights for nearly all sugars close to the ideal value of 2.0. The column showcased great stability in retention times, peak efficiencies, and tailing factors over an impressive span of 2600 injections. The versatility of this new stationary phase was evident in its ability to achieve high-resolution separation of carbohydrates from mono-, di-, tri-, oligo-, up to polysaccharides. In conclusion, the newly introduced column provides high-resolution separation of all classes of carbohydrates using HPAEC-PAD and will help to achieve accurate identification and quantification of carbohydrates in food products, including detection of adulteration and fraud.
References
(1) Herrero, M.; Cifuentes, A.; Ibáñez, E.; Castillo, M. D. del. Advanced Analysis of Carbohydrates in Foods. In Methods of Analysis of Food Components and Additives; CRC Press, 2012.
(2) Lee, Y. C. High-Performance Anion-Exchange Chromatography for Carbohydrate Analysis. Anal. Biochem. 1990, 189, 151–162. DOI: 10.1016/0003-2697(90)90099-u
(3) Lee, Y. C. Carbohydrate Analyses with High-Performance Anion-Exchange Chromatography. J. Chromatogr. A 1996, 720 (1–2), 137–149. DOI: 10.1016/0021-9673(95)00222-7
(4) Frahn, J. L.; Mills, J. A. Paper Ionophoresis of Carbohydrates. I. Procedures and Results for Four Electrolytes. Aust. J. Chem. 1959, 12 (1), 65–89. DOI: 10.1071/ch9590065
(5) Rocklin, R. D.; Pohl, C. A. Determination of Carbohydrates by Anion Exchange Chromatography with Pulsed Amperometric Detection. J. Liq. Chromatogr. 1983, 6 (9), 1577–1590. DOI: 10.1080/01483918308064876
(6) Rohrer, J. Carbohydrate Analysis by High-Performance Anion-Exchange Chromatography with Pulsed Amperometric Detection (HPAE-PAD). Thermo Fisher Scientific application note 70671.
(7) Corradini, C.; Corradini, D.; Huber, C. G.; Bonn, G. K. Synthesis of a Polymeric-Based Stationary Phase for Carbohydrate Separation by High-pH Anion-Exchange Chromatography with Pulsed Amperometric Detection. J. Chromatogr. A 1994, 685, 213–220. DOI: 10.1016/0021-9673(94)00665-2
(8) Wouters, S.; Dores-Sousa, J. L.; Liu, Y.; Pohl, C. A.; Eeltink, S. Ultra-High-Pressure Ion Chromatography with Suppressed Conductivity Detection at 70 MPa Using Columns Packed with 2.5 µm Anion-Exchange Particles. Anal. Chem. 2019, 91 (21), 13842–13830. DOI: 10.1021/acs.analchem.9b03283
(9) Louw, H. R.; Brouwer, H.-J.; Reinhoud, N. J. Electrochemical Flow Cell. US9310330B2.
(10) Rocklin, R. D.; Clarke, A. P.; Weitzhandler, M. Improved Long-Term Reproducibility for Pulsed Amperometric Detection of Carbohydrates via a New Quadruple-Potential Waveform. Anal. Chem. 1998, 70 (8), 1496–1501. DOI: 10.1021/ac970906w
(11) Samarghandian, S.; Farkhondeh, T.; Samini, F. Honey and Health: A Review of Recent Clinical Research. Pharmacogn. Res. 2017, 9 (2), 121–127. DOI: 10.4103/0974-8490.204647
(12) Ždiniaková, T.; Loerchner, C.; De Rudder, O.; et al. EU Coordinated Action to Deter Certain Fraudulent Practices in the Honey Sector, 2023. https://publications.jrc.ec.europa.eu/repository/handle/JRC130227 (accessed 2023-11-20).
(13) Council of the European Union. Council Directive 2001/110/EC of 20 December 2001 Relating to Honey, 2001. https://eur-lex.europa.eu/legal-content/EN/ALL/?uri=celex%3A32001L0110 (accessed 2023-11-20).
(14) Niness, K. R. Inulin and Oligofructose: What Are They? The J. Nutr. 1999, 129 (7), 1402S-1406S. DOI: 10.1093/jn/129.7.1402S
ABOUT THE COLUMN AUTHOR


David S. Bell is a Research Fellow in Research and Development at Restek. He also serves on the Editorial Advisory Board for LCGC and is the Editor for “Column Watch.” Over the past 20 years, he has worked directly in the chromatography industry, focusing his efforts on the design, development, and application of chromatographic stationary phases to advance gas chromatography, liquid chromatography, and related hyphenated techniques. His main objectives have been to create and promote novel separation technologies and to conduct research on molecular interactions that contribute to retention and selectivity in an array of chromatographic processes. His research results have been presented in symposia worldwide, and have resulted in numerous peer-reviewed journal and trade magazine articles.
LCGCedit@mmhgroup.com.

ABOUT THE AUTHORS


Christian Marvelous has a Ph.D. from Leiden University. He joined Antec Scientific as a research scientist in 2022. His work focuses on carbohydrate analysis using HPAEC-PAD.
c.marvelous@antecscientific.com


Hendrik-Jan Brouwer obtained his Ph.D. from the University of Groningen in the field of polymer chemistry and joined Antec Scientific in 2000. He is currently leading the R&D team at Antec Scientific.

Daniel Vetter, Martin Eysberg, Nico Reinhoud, and Jean-Pierre Chervet are members of Antec Scientific.


LC–MS/MS-Based System Used to Profile Ceramide Reactions to Diseases
April 26th 2024Scientists from the University of Córdoba in Córdoba, Spain recently used liquid chromatography–tandem mass spectrometry (LC–MS/MS) to comprehensively profile human ceramides to determine their reactions to diseases.


High-Throughput 4D TIMS Method Accelerates Lipidomics Analysis
April 25th 2024Ultrahigh-pressure liquid chromatography coupled to high-resolution mass spectrometry (UHPLC-HRMS) had been previously proposed for untargeted lipidomics analysis, but this updated approach was reported by the authors to reduce run time to 4 min.


Traditional Chinese Medicine’s Effects on Liver Cancer Measured Using New UHPLC–QTOF-MS System
April 22nd 2024Scientists from Anhui University of Chinese Medicine in Hefei, China recently investigated the mechanisms behind what makes huachansu tablets, a type of traditional Chinese medicine (TCM), effective against liver cancer.

