

|Articles|June 1, 2022
Py-GC–MS Investigation of Pyrolysis Behaviours and Decomposition Products of α- and β-2,7,11-Cembratriene-4,6-Diols
Advertisement
To study the thermal stability of cembratriene, α- and β-2, 7, 11-cembratriene-4, 6-diols (α- and β-CBT) were isolated from tobacco leaves. Thermogravimetric (TG) and differential thermogravimetric (DTG) analyses were used to evaluate the cleavage differences between the two compounds. The TGA results showed the peak temperatures (Tp) were 263.3 ¡C and 254.1 ¡C with the largest weight loss rate; the significant weight losses were 90.96% and 99.45%. Pyrolysis gas chromatography–mass spectrometry (Py-GC–MS) was employed for the pyrolysis products at different temperatures (300, 600, and 900 ¡C) under either N2 or an O2–N2 (10%:90%) mixture. The results showed that the major pyrolysates from α- and β-CBT were simple hydrocarbons, such as toluene, 1, 4-pentadiene, and p-xylene, as well as several important flavour compounds, such as 2-methylfuran, benzaldehyde, and 4-methylbenzaldehyde. More pyrolysis products were obtained at higher temperatures, and almost all of the harmful aromatic ingredients were produced at 900 ¡C. Importantly, solanone, a significant flavour component, was only obtained from the pyrolysis of α-CBT under 10% O2 in N2 at both 600 and 900 ¡C. The number of the pyrolysates changed with the change in pyrolysis temperature and the presence of oxygen. The study of the thermal behaviour and pyrolysis products of these terpenoids could possibly suggest flavour precursors that could be used to provide specific flavours.
The epimeric macrocycles, α- and β-2,7,11-cembratriene-4,6-diol (α- and β-CBT), are the two most abundant cembranoids found in tobacco (1–3) and are the main components of the glandular secretions formed on the surface of tobacco leaves. They play a number of important roles during plant growth and development. The absolute configuration of α-CBT is (1S, 2E, 4S, 6R, 7E, 11E)-2,7,11-cembratriene-4,6-diol and that of β-CBT is (1S, 2E, 4R, 6R, 7E, 11E)-2,7,11-cembratriene-4,6-diol (Figure 1).
As two latent fragrant substances, α- and β-CBT are of interest because they are the precursors of key flavour constituents in Nicotiana species (4). They can be biochemically degraded and transformed into neutral flavouring substances such as solanone and solandion (5,6), even though they have no fragrance of their own. It should be noted that solanone imparts the flavours of carrot and liquorice, and it has a tea-like aroma, which is an important fragrance (7–9). The addition of solanone to cigarettes can significantly increase the aroma, make the smoke plump, and greatly improve the quality of cigarettes (10–12).
α- and β-CBT were reported for the first time by Roberts and Rowland (13), after isolation from aged Burley tobacco. The structure and absolute stereochemistry of β-CBT were established based on X-ray crystallography, whereas the structure of α-CBT was based on chemical degradation and later confirmed using multiple methods (13,14). The two compounds, which constitute 0.01% and 0.005% of the dry Burley leaf, have also been found in flue-cured, Turkish, and unaged Burley tobaccos.
To improve the initial complicated process for the isolation and purification of α- and β-CBT, optimized methods were reported by Severson et al. (2) and Guanghui and Zong (15). Mature fresh tobacco leaves were extracted using dichloromethane and subjected to liquid–liquid extraction (LLE) to obtain a crude extract. This extract was separated by high performance liquid chromatography (HPLC), crystallization, and recrystallization, to successively produce α- and β-CBT. Ultraviolet (UV), infrared (IR), nuclear magnetic resonance (NMR), and high-resolution mass spectrometry (HRMS) techniques, as well as other modern organic chemical analyses, were used to characterize their structures and absolute stereochemistries. The structural variation between α-CBT and its epimer β-CBT was ultimately distinguished by two-dimensional (2D)-NMR.
Previous studies on α- and β-CBT have typically concentrated on their separation, identification, qualitative and quantitative analysis (15,16), biosynthesis (17,18), biodegradation (19), and chemical synthesis. In this study, we applied pyrolysis–gas chromatography–mass spectroscopy (Py-GC–MS), which served as a powerful tool for conducting qualitative and quantitative analysis of thermolytic decomposition products from α- and β-CBT (20). Although studies on the thermal behaviour and pyrolysis of glycosides have been reported (21–24), their application of cembrene for the purpose of producing aroma and flavour compounds, such as solanone, has not been reported. By studying the product distributions obtained under different pyrolysis conditions, important basic information can be obtained that suggests appropriate precursors that could be used to provide specific flavours.
Materials and Methods
Plant Material: Mature tobacco leaves of Nicotiana tabacum L were collected in an experimental tobacco field in Xuchang City, Henan Province, China. A voucher specimen (TL20150804) was deposited in our laboratory.
General Characterization Methods: UV spectra were obtained using a Puxi TU-1901 spectrophotometer. The IR spectra were recorded using a Bruker Vertex 70 Fourier transform IR (FT-IR) ESP spectrometer. The samples were analyzed as KBr micropellets. First dimension (1D) and second dimension (2D) NMR spectra were recorded on Bruker Avance AMX-400 spectrometers, with TMS as the internal standard. HRMS spectra were recorded with a Thermo Fisher Exactive Orbitrap spectrometer. Py-GC–MS analysis was performed on a combined system consisting of an Agilent 7890A-5975C GC–MS instrument and a CDS Analytical Pyroprobe 5200. Semipreparative HPLC was performed on a Waters Delta 600 preparative liquid chromatograph with a Waters 2489a UV detector and a 4.6 mm × 250 mm, 5-μm C18 column, with the detection wavelength being 210 nm.
Sample Preparation: Whole fresh tobacco leaves (100 kg) were extracted three times with CH2Cl2 (3 × 5.0 L). Each of the 3–5 leaves were swirled for 3–5 s, and filtered to yield a filtrate. A crude extract was concentrated by rotary evaporation at 45 °C. The dried extract (2.0 g) reconstituted in CH2Cl2 was washed twice with 5% phosphoric acid (20 mL) by a separatory funnel, and the separation then left the organic phase. The organic phase was rinsed 2–3 times with deionized water (20 mL) until a neutral pH was obtained, and then it was separated and dried over anhydrous sodium sulphate. The filtered organic solution was concentrated by rotary evaporation at 45 °C to obtain the extract of cembratriene (1.8672 g), which was subjected to silica gel (100–200 mesh) chromatography using a petroleum ether/ethyl acetate gradient system (6:1), with final elution using 100% ethyl acetate. The collected ethyl acetate fractions were further purified by HPLC (50% acetonitrile–H2O; flow rate, 4.00 mL/min) to yield solid α- and β-CBT samples.
Thermal Analysis: Thermogravimetric (TG) and differential thermogravimetric (DTG) analysis was performed using a Diamond TG analyzer from PerkinElmer. A sample (~4.0 mg) was heated at a rate of 10 °C/min from ambient temperature to 800 °C under N2.
Py-GC–MS Method: In the pyrolysis experiments, the mass of the solid sample was 0.40 mg, and the atmosphere was either N2 or a mixture of O2 (10%) and N2 (90%). The initial pyrolysis temperature of 50 °C was increased to 300, 600, and 900 °C at 20 °C/ms over 15 s. The pyrolysis products were directly transferred to the GC–MS instrument for analysis.
Qualitative GC–MS analysis was conducted with a 30 m × 0.25 mm, 0.25-μm Agilent DB-5MX wax fused silica capillary column. The column temperature was held at 50 °C for 2 min, subsequently raised to 280 °C at a rate of 5 °C/min, and then maintained at 280 °C for 20 min. The injector and detector temperatures were set at 280 °C. The sampling volume was 1 μL, and the shunt ratio was 25:1. The temperature of the ion source was 230 °C, and the temperature of the transmission line was 280 °C. The EI ionization energy was 70 eV, and the scan range was 30–550 amu. The spectra of the pyrolysis products were simulated and matched against the PerkinElmer National Institute of Standards and Technology (NIST) library and other published data.
Results and Discussion
Structural Characterization:
Compound 1: The HRMS spectrum gave the molecular formula C20H34O2 by HRMS ([M+Na]+, m/z: 329.24493), suggesting four degrees of unsaturation. Secondary and tertiary mass-spectrogram showed that the structure of α- and β-CBT lost two -OH and one -C3H7 was consistent. The IR spectrum showed absorption bands at 3351, 2919, 1653, 1430, 1170, and 976 cm-1, indicating the presence of the -OH, the C-H, C=C, C-H, C-O, and trans-C=C. The 13C NMR spectrum of compound 1 displayed 20 carbon signals, respectively, corresponding to a cembranoids nucleus δc: 137.4, 136.8, 133.3, 130.5, 127.7, 124.3, 72.4, 66.2, 52.1, 46.3, 38.8, 36.7, 32.9, 30.0, 27.9, 23.2, 20.6, 19.3, 16.0, and 14.9 ppm. Its 1H NMR spectrum exhibited 34 signals: δH 5.33–5.32 (m, H-2,3,7), δH 5.04–5.02 (t, HO-6), δH 4.50–4.45 (m, J = 8.9, 1.9HZ, H-6), δH 2.16–2.13 (m, H-9, 10), δH 2.02-1.96 (m, 4H, H-13, 14), δH 1.82 (S, HO-4), δH 1.67 (d, H-19), δH 1.57–1.58 (m, H-5), δH 1.52–1.49 (m, H-1,11, 20), δH 1.34 (S, H-18), δH 1.28 (m, H-15), δH 0.83–0.81 (d, H-16), and δH 0.80-0.78 (d, H-17) ppm. These data indicated compound 1 was α-CBT.
Compound 2: Compound 2 had a molecular formula C20H34O2 that was established by the quasimolecular ion peak observed by HRMS measurement at m/z: 329.24316 (M + Na)+, suggesting four degrees of unsaturation. The results of the IR spectrum were similar to those of compound 1. The 13C NMR spectrum of compound 2 exhibited 20 carbon signals. The NMR data, corresponding to a cembranoids nucleus δc: 137.4, 136.1, 133.0, 131.4, 130.3 , 124.4, 71.4, 64.4, 52.4, 46.2, 38.8, 36.4, 32.9, 28.7, 27.6, 23.0, 20.5, 19.3, 15.9, and 14.9 ppm. The above also confirmed its 1H NMR spectrum at δH 5.41–5.37 (d, H-3), δH 5.27–5.18 (m, H-2, 7), δH 5.00–4.99 (t, HO-6), δH 4.83–4.79 (t, H-6), δH 2.22–1.83 (m, H-9, 10, 13, 14), δH 1.70–1.64 (d, H-19), δH 1.60–1.39 (m, H-1, 5, 11, 18, 20, OH-4), δH 1.31–1.27 (m, H-15), and δH 0.83–0.78 (m, H-16, 17) ppm. These data indicated that compound 2 was β-CBT.
Thermogravimetric Analysis: Figure 2 shows the TG and DTG curves recorded for α- and β-CBT from ambient temperature to 700 °C. Two stages are observed in the pyrolysis process for α-CBT, the first stage (1.39% weight loss) between 57–100 °C is attributed to the evaporation of water of crystallization (25). The second stage, representing the main weight loss with a sharp decrease of 90.96%, occurs between 123–329 °C. For β-CBT, the weight of the β-CBT sample decreases by 99.45% between 125–322 °C. No solid residue remains in the latter sample at 347 °C, whereas the α-CBT does not seem to be completely pyrolyzed at 700 °C, which shows that α- and β-CBT can complete pyrolysis at a lower temperature.
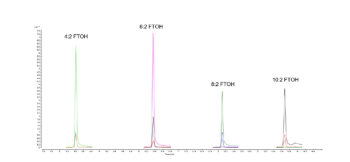
Study of Pyrolysis Products of α- and β-CBT: To investigate the main products obtained from the CBT pyrolysis processes, Py-GC–MS analyses were conducted (Figure 3). The structures of the pyrolysis products were identified by NIST 17, and their relative contents were determined by the peak area normalization method. To ensure the accuracy and repeatability of the experiments, we calculated the relative standard deviation (RSD) of the relative content of each component by averaging the results of three parallel measurements, and obtained RSD values between 0.48–5.02%. These results illustrate that the pyrolysis process had good repeatability. The results are shown in Tables 1 and 2.
Inspection of the data in both tables reveals that temperature has a significant effect on the pyrolysis product formation. Under N2 atmosphere conditions, 0, 10, and 100 substances were detected from α-CBT at 300, 600, and 900 °C, respectively, compared to four, 53, and 104 substances from β-CBT. Under 10% O2 atmosphere, four, 56, and 66 compounds were produced from α-CBT, respectively, whereas only a single compound was observed at any temperature from β-CBT. Generally, the higher the temperature, the greater the number of products observed for the epimeric diols, except in the case of the β-CBT in a 10% O2 atmosphere, where the only pyrolysis product obtained at any temperature was methacrylaldehyde.
If the pyrolysis temperatures are divided into three zones, low (300 °C), medium (600 °C), and high (900 °C), one trend that emerged from the data was that the harmful aromatic components are mainly produced under high temperature conditions. A second interesting observation from the data was that the pyrolysis behaviours of the two substances were different under various conditions. For α-CBT, pyrolysis at high temperatures produced fewer oxygenated products, but oxygen incorporation was increased at low and moderate temperatures. In contrast, only one substance can be detected in 10% O2 at any of the three β-CBT pyrolysis temperatures, which was far less than the number of pyrolysis products obtained under pure N2. There were no obvious differences between the N2 and 10% O2 pyrolysis products from α-CBT at 900 °C, although the pyrolysate distributions from α-CBT at 300 and 600 °C resemble those from the 10% O2 pyrolysis conditions. However, β-CBT displays the opposite behaviour: its pyrolysis products at 300, 600, and 900 °C are mainly under the N2 atmosphere, which shows that α- and β-CBT were easier to pyrolyze in 10% O2.
When looking category-wise at levels of agreement for pyrolysis products for α- and β-CBT, aromatic hydrocarbons and enynes are the main volatiles detected, with alkanes, alcohols, aldehydes, ketones, and furans comprising a minor fraction (Figure 4). Among the pyrolysis products under various conditions of α- and β-CBT, aromatic hydrocarbons were the main components, accounting for 45.45% and 50%, respectively, followed by alkynes, which accounted for 31.10% and 37.08%, respectively, which is because of its unsaturated isoprene ring structure. Second, it can be found that the alcohols, aldehydes, and ketones in α-CBT were higher than those in β-CBT.
At 300 °C, only a few pyrolysis products were obtained from α- and β-CBT, including high boiling components, butyraldehyde (α-CBT) and methacrylaldehyde (α- and β-CBT), which indicates that bonds were broken in both α- and β-CBT, but complete pyrolysis did not occur. This result could be explained by their melting and boiling points. The melting point of α-CBT is 125–126 °C, and the melting point of β-CBT is 65–66 °C. Similarly, it can be seen that the boiling point of α-CBT is higher than that of β-CBT. The peak area percentage of β-CBT is 28.1%, whereas that of α-CBT is 0. At moderate and high temperatures, the results show that both α- and β-CBT are completely decomposed.
The most striking observation to emerge from the data comparison pertains to solanone, one of the most important pyrolysis products, which was produced only during the pyrolyses of α-CBT at 600 (0.4%) and 900 °C (0.6%) in 10% O2. Two possible explanations for this result may apply: (1) both α- and β-CBT produce solanone, but in the case of β-CBT, this material is completely converted to other compounds, whereas that from α-CBT is not completely consumed; alternatively, (2) only α-CBT produces solanone. If the latter conclusion is correct, it can be determined that α-CBT contributes most to tobacco aroma substances. One definite conclusion is that α-CBT can be converted to solanone only in an atmosphere of 10% O2.
Conclusions
Thermogravimetric analysis showed that epimeric α- and β-CBT underwent significant weight losses of 97.41% and 96.54% in the ranges of 170–700 °C and 180–560 °C, respectively. However, during pyrolysis, α-CBT alone was converted to solanone in low yields of 0.6% and 0.4% at 600 and 900 °C only under 10% O2, respectively, whereas β-CBT produced no solanone at all.
Despite the low pyrolytic efficiency in the production of solanone, α- and β-CBT have great potential to be developed and utilized, especially because of their abundance. This work demonstrates that an approach such as the microbial degradation of α- and β-CBT might be more appropriate for conversion into aroma compounds such as solanone. Nevertheless, Py-GC–MS was shown to be a useful technique for assessing the pyrolytic potential of α- and β-CBT.
Acknowledgement
This work was supported by the National Natural Science Foundation of China under grant numbers 21406210 and 21546012; the Doctor Research Foundation under grant number 2014bsjj068; and the Henan province foreign cooperation projects under grant number 152106000058.
Table 1
Table 2
References
- R. Stevens, Trends in flavour research: proceedings of the 7th Weurman Flavour Research Symposium, Noordwijkerhout, H. Maarse and D.G. Van Der Heij, Ed. (Elsevier, Amsterdam, The Netherlands, 1994), pp. 15–18.
- R.F. Severson, R.F. Arrendale, O.T. Chortyk, A.W. Johnson, D.M. Jackson, G.R. Gwynn, et al., J. Agr. Food Chem. 32(3), 566–570 (1984).
- C.R. Enzell, I. Wahlberg, and R. Ryhage, Mass Spectrom. Rev. 3, 395–438 (1984).
- A.H. Martins, J. Hu, Z. Xu, C. Mu, P. Alvarez, B.D. Ford, et al., Neuroscience 291, 250–259 (2015).
- K.W. Chang, W.W. Weeks, and J.A. Weybrew, Tobacco Sci. 29, 122–127 (1985).
- I. Wahlberg, E. Olsson, and J.E. Berg, Progress in Flavour Precursor Studies: Analysis, Generation, Biotechnology: Proceedings of the International Conference, Würzburg, Germany, 30 September–2 October 1992 (Allured Publishing Corporation, Carol Stream, Illinois, USA, 1993), pp. 83–95.
- A.W. Johnson, R.F. Severson, J. Hudson, G.R. Corner, and R.F. Arrendale, Tobacco Sci. 29, 67–72 (1985).
- R.F. Severson, A.W. Johnson, and D.M. Jackson, Rec. Adv. Tobacco Sci. 11, 105–174 (1985).
- R.L. Stedman, Chem. Rev. 68(2), 153–207 (1968).
- M. Martens, G.A Dalen, and R. Helmut, Flavour Science and Technology (John Wiley and Sons Ltd, New York, NY, USA, 1987), pp. 101–106.
- R.B. Griffith, R.R. Johnson, and A.D. Quinn. U.S. Patent, 3,174,485 (23 March, 1965).
- K. Guanghui and Z. Hui, Chinese Agr. Sci. Bull. 12, 108–110 (2006).
- D.L. Roberts and R.L. Rowland, J. Org. Chem. 27(11), 3989–3995 (1962).
- I. Wahlberg and A.M. Eklund, Fortschritte Der Chemie Organischer Naturstoffe 59, 141–294 (1992).
- K. Guanghui and H. Zong, Chinese Agr. Sci. Bull. 22(12), 108–110 (2006).
- S.Y. Chiang and C. Grunwald, Phytochemistry 15(6), 961–963 (1976).
- W.A. Court, G.H. John, and R.B. Michael, Can. J. Plant Sci. 69(3), 1063–1069 (1989).
- L. Crombie, D. McNamara, D.F. Firth, S. Smith, and P.C. Bevan, Phytochemistry 27(6), 1685–1693 (1988).
- Z. Guo and G.J. Wagner, Plant Sci. 110(1), 1–10 (1995).
- W. Pipkin, R. Belganeh, W. Robberson, H.L. Allen, A-M. Cook, and A. Watanabe, LCGC N. Am. 39, 178–186 (2021).
- J. Arnarp, W.L.A. Chu, C.R. Enzell, G.M. Hewitt, J.P. Kutney, K. Li, et al., Acta Chem Scand. 47(7), 689–694 (1993).
- K. Werner, L. Pommer, and M. Broström, J. Anal. Appl Pyrol. 110, 130–137 (2014).
- W.C. Xie, X.H. Gu, Z.C. Tan, J. Tang, G.Y. Wang, C.R. Luo, and L.X. Sun, J. Ther. Anal. Calorim. 87(2), 505–510 (2007).
- S. Zeng, S. Sun, S. Liu, J. Hu, and B. He, J. Ther. Anal. Calorim. 115(2), 1049–1056 (2014).
- N. Gao, A. Li, C. Quan, L. Du, and Y. Duan, J. Anal. Appl. Pyrol. 100, 26–32 (2013).
Advertisement
Related Content
Advertisement

Advertisement
Advertisement
Trending on LCGC International
1
The Silent Crisis: Can The Demise of Chromatography Teaching in Universities Be Reversed?
2
Multiplexed HILIC-HRMS Method Quantifies LPC and CAR Biomarkers for HCC
3
SPME in Practice: Techniques, Tips, and Troubleshooting
4
LC-MS/MS Tracks Acrylamide Cuts in Popcorn
5