


|Articles|September 1, 2008
- LCGC North America-09-01-2008
- Volume 26
- Issue 9
Improving the Confidence of Unknown Compound Identification by First Responder Mobile GC–MS Laboratories...
A novel method that significantly improves the accuracy and reliability of "unknown" compound identification for volatile organic compounds by GC-MS is described.
Advertisement
Improving the Confidence of Unknown Compound Identification by First Responder Mobile GC-MS Laboratories in Time-Critical Environmental and Homeland Security Incidents
The Connecticut Department of Environmental Protection (CT DEP) located in Windsor, Connecticut, utilizes a unique mobile laboratory equipped with state-of-the-art analytical instrumentation, including gas chromatography–mass spectrometry (GC–MS) systems charged with the on-site, rapid identification of unknown chemical compounds in time-critical environmental and homeland security incidents. The CT DEP emergency responder team is always on call and typically is called in by firefighters and local or federal law enforcement officials in situations where unknown and possibly dangerous chemicals are encountered. Their charge is to provide rapid identification of these substances to allow incident commanders and law enforcement agents to respond appropriately. Rapid and accurate identification is critical in these situations, as this quickly can determine the difference between the need for simple controlled disposal of nontoxic substances to the potential evacuation of entire neighborhoods.
GC–MS is the tool of choice for the rapid identification of volatile and semivolatile organic compounds. Standard EPA methods cover the identification of over 200 compounds of environmental concern. These methods provide extremely sensitive and accurate identifications of these target compounds based upon their retention time and GC–MS library search match. However, for compounds that are not characterized by these methods, a significant uncertainty can exist for these "unknown" compounds when using GClibrary search routines alone for identification. Misidentification can lead to an expensive and potentially dangerous or fatal incorrect response by first responders and law enforcement. Uncertainties or delays in confident identification also can contribute to high costs and consume valuable public resources.
To increase the likelihood of a correct unknown identification, many analytical methods require a second confirmatory analysis, for example, GC–MS library matching followed by formula confirmation by accurate mass measurement resulting in the assignment of an unambiguous elemental composition. For first responder chemical identification, the challenge is further complicated by the fact that the analysis must have a high degree of confidence, it must be done rapidly (typically within 1–3 h), and it must rely on the analytical equipment available in the mobile laboratory. For these applications, a tool for an extra level of confirmation is needed on the GC–MS instrument.
Recent advances in MS data processing have shown the potential for obtaining accurate formula identification of unknowns by unit resolution MS (1). The application is based upon a novel method for accurate mass and accurate line-shape calibration for unit resolution mass spectrometers that allows both the accurate mass and accurate isotope pattern matching (spectral accuracy) to be used for formula identification, competitive to results obtainable by high-resolution accurate mass instrumentation.
This article presents a new method for increasing the speed and accuracy of unknown identification by GC–MS by utilizing the standard GC–MS library search, combined with confirmation of the result by formula identification on a standard unit resolution single-quadrupole GC–MS instrument. The method is based upon the standard EPA method for volatile organic compound (VOC) analysis (2) (EPA 8260B) and will be designated here as EVOCA (extended VOC analysis).
Experimental
A test solution for evaluating EVOCA was prepared using the standard EPA 8260B protocol utilizing seven surrogate compounds and internal standards. A test solution was created from 73 target compounds of environmental concern and an additional 17 compounds in separate runs, for a total of 90 compounds to evaluate the method.
The 73 target compound test mixture was prepared at approximately 20 μg/L for each component in 10 mL water and introduced through a purge-and-trap system with approximately 4 ng per component introduced into the GC–MS instrument through a 50:1 GC split. The mixture of 17 additional compounds was prepared at approximately 2000 μg/mL and introduced by a 1-μL injection through the same splitter allowing about 40 ng per component into the mass spectrometer.
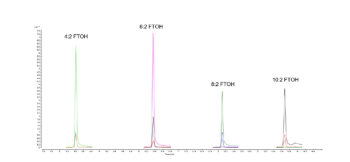
Figure 1
An Agilent 6890-5973 GC–MS system (Agilent Technologies, Santa Clara, California) installed in the CT DEP mobile lab was used for all analysis. The standard EPA Method 8260B was used, with the exception that the mass spectrometer was set to acquire the spectral data in Agilent "raw" mode. Raw mode acquisition acquires and saves each MS peak as a continuum that is necessary for the spectral calibration used for accurate m/z value assignment and line-shape calibration for producing the formula identification results. Spectra for each of the target test compounds were searched against the NIST02 Mass Spectral Database of EI spectra using ChemStation software (Agilent) to create the top search results. Figure 1 shows the chromatogram from the 73 target compound run and an analysis of one of the ions for a compound of interest. An additional 17 VOCs were analyzed in a separate analysis using the same method except for the sample introduction.
Table I: Ions used for the mass spectral calibration and the calibration error
Each analysis file was then loaded in MassWorks software (Cerno Bioscience, Danbury, Connecticut), where the mass spectral data were calibrated for accurate mass and line-shape using six selected ions from the surrogate compounds and internal standards, as listed in Table I. The calibration ions were chosen to span the m/z range of interest to provide a comprehensive spectral calibration. The calibration ions ranged from m/z 65 to 190, while the target compounds ranged from m/z 46 to 258. The calibration was then applied to the entire data file and spectra were averaged for each of the 73 EPA target compounds and 17 additional VOCs. A subset of the 73 compounds is shown in Table II for brevity. Based upon accurate mass information from the analysis of all the results, a formula search was performed for each compound using a maximum of 20 mDa mass range from the monoisotopic peak position for each ion of interest. The elemental composition search was performed using the elements C, H, N, O, F, Br, Cl, S, and P, which are the most relevant elements of the chemicals of greatest concern for environmental impact and health. This set of elements was used so the system would represent the case for a true unknown analysis. Once the formula list was generated, the calibrated line-shape isotope profile search (CLIPS) formula search function of MassWorks was applied to selected ions to generate a list of elemental compositions that are sorted by spectral accuracy. The spectral accuracy is a measure of the closness of the fit between the line-shape calibrated spectrum and the theoretically generated spectrum of each formula candidate as follows:
Table II: A subset of the 90 Target VOCs
Spectral Accuracy = (1 - |RMSE|) * 100
where RMSE is the root mean squared error between the calibrated spectrum and the theoretical spectrum; thus, a value of 100 is a perfect fit. An example fit is illustrated in Figure 2. The results from the ion formula were then confirmed against the library search results to validate the method against the test mixture.
Figure 2
Results and Discussion
For most compounds, the molecular ion peak was used to confirm the elemental composition against the NIST database match, but in some instances, the molecular ion peak was weak or absent. In these cases, one or more fragment ions could be used to corroborate the correct formula. The standard deviation of the mass accuracy was 13 mDa for the 73 target compounds and 7 mDa for the additional 17 VOCs. This allowed the elemental composition search to be limited to a conservative maximum for the mass window of 20 mDa. For some of the higher molecular weight compounds, many formula could be returned, because the elemental composition search was very broad, although the list was typically less than 50–100. Even on the highest resolution GC–time of flight (TOF) instruments, under ideal conditions, a mass accuracy of 5 ppm (3) would return 20 formula candidates under these elemental composition search constraints, and for "real world" analysis, the mass accuracy is likely to be two to four times less. This illustrates the importance of utilizing the isotope pattern to further limit the number of choices (4) and provide high-confidence results.
Figure 2 illustrates the isotope pattern match using the CLIPS approach. Since the spectral calibration corrects the line-shape as well as the mass position, accurate comparisons can be made from the theoretically generated spectra using the mass-derived formula list against the measured spectra. In addition to reporting a metric of spectral accuracy, one can compare the isotope profiles visually to validate the match. For true unknowns, it is possible that the compound being analyzed might not be present in the NIST database or other MS libraries. In this case, this method can at least provide elemental composition information for the unknown, which can be used to assist in identifying the compound along with other chemical and forensic clues.
Table III: Summary of results for all test compounds. The correct ion was identified for all but four of the 90 compounds within the top two matches by spectral accuracy
A summary of the results is shown in Table III. What is remarkable is that for every compound tested, useful corroborative formula information was obtained to validate the library search results. In the worst case, styrene (C8H8, MW=104.0626 Da), in which the spectral accuracy rank was 5, the molecular ion peak at nominal m/z 104 was used for the formula identification. Further examination of the spectrum revealed a peak at m/z 91 that is characteristic of xylene, which was suspected to be coeluted with styrene. O-xylene also produces a fragment [M – H2]+ at m/z 104 that would interfere with the styrene peak. The spectral accuracy for the molecular ion peak of styrene was 89.3%, well below the typical values of 98% to >99% observed for most ions. The low spectral accuracy provides a good indicator for false positives, something that mass accuracy values cannot. The interference is confirmed easily by comparing the measured and theoretical spectrum, as shown in Figure 3. The poor fit is obvious and interference is suspected. To confirm the presence of xylene, the CLIPS search is repeated and the molecular ion of xylene and its [M – H]+ ion are included. The search automatically calculates the best fit for these three ions and gives an excellent spectral accuracy of 99.75%, confirming the interference.
Figure 3
One advantage of this method is that it is entirely based upon existing, established methods of analysis. By using the surrogate compounds and internal standards, no additional spectral calibration standards, such as perfluorotributylamine (PFTBA), need to be used. Thus, no changes are required in the existing method of analysis. This simplifies the process and actually improves the spectral calibration, and only an additional data analysis step needs to be applied to obtain the formula results. This also means the method is easily adaptable to other laboratories.
Further improvements in the confidence of the formula identification is obtained easily from GC–MS by applying the CLIPS search to multiple fragment ions. This is illustrated in Table IV, as the only formula that makes chemical sense must contain a subset of elements from the molecular ion. Here we use to our advantage the fact that electron ionization provides a rich amount of chemical information. We can use this same strategy to address cases in which the molecular ion peak is either very weak or absent by corroborating the ion fragment formulas against the NIST Database search results. Neutral losses also can give structural clues in the cases of true unknowns. The same information also can be used to help identify cases in which compounds are coeluted by identifying unrelated molecular and fragment ions.
Table IV: CLIPS search for two fragments of ethyl methacrylate (C6H10O2). The correct match for the molecular ion shows up as match 2. By analyzing another ion a nominal mass 69 m/z, the correct formula can be readily deduced with a high degree of certainty as C6H10O2 as the 69 m/z fragment corresponds to the loss of C2H5O.
One current drawback of the method is that the software does not provide perfect equivalent library search results between raw mode (continuum scan) and scan mode (centroid) data. Even though MS instruments always process centroid data directly from the raw mode data, it is suspected that the library search routines either do not centroid the raw mode data before the search, or do so differently for raw mode data. It is necessary to provide properly centroided data to the library search routines because the NIST database uses centroided data, and the algorithms rely on centroided data (5). Due to this limitation, the method currently might require the analysis to be performed twice, once in scan mode for library searching, and once in raw mode, which is required for accurate mass and line-shape calibration. Hopefully, these issues will be resolved in the future, which will further reduce the current analysis time. It is possible that better results can be obtained by use of the NIST MS search program, which is available on this vendor's software.
Conclusion
As illustrated in Table III, 81 of the 90 tested compounds were confirmed by formula identification as the number one formula on the CLIPS search list and another five compounds were listed as the number two formula that resulted a total of over 95% of top confirmation rates. The rest of four compounds were ranked between three to five positions. These results clearly demonstrate that the spectral accuracy and mass accuracy obtainable by this method provides a highly reliable confirmatory measurement to GC–MS database searching. Key advantages of the method are that:
- It can be performed on less expensive, and in this case, mobile GC–MS instruments commonly used by persons responsible in first responder situations. The ability to have this additional confirmatory information in time-critical situations can be a key to important or even life-threatening situations.
- The same method also can be extended easily to other application areas, including the rapid identification of unknown semivolatile compounds (SVOCs) by GC–MS. Examples include flavors and fragrances, pharmaceutical degradents, natural product identification, and contaminants. Combining this approach with chemical ionization GC–MS also should provide additional valuable information for the structural elucidation of unknown compounds.
Jianping Chen*, Ming Gu†, Yongdong Wang†, and Don Kuehl†
*Connecticut Department of Environmental Protection, Windsor, CT 06095
†Cerno Bioscience, Danbury, CT 06810
Please direct correspondence to
References
(1) M. Gu, Y. Wang, X. Zhao and Z. Gu, Rapid Commun. Mass Spectrom. 2006; 20: 764–770.
(2) EPA Method 8260B Volatile Organic Compounds by Gas Chromatography/Mass Spectrometry (GC–MS).
(3) Manufacturers published specification for the Waters GCT Premier. Waters Corporation, Milford, Massachusetts.
(4) T. Kind and O. Fiehn, BMC Bioinformatics 7, 234 (2006).
(5) S.E. Stein and D.R. Scott, J. Am. Soc. Mass Spectrom. 5 859–866 (1994).
Articles in this issue
almost 18 years ago
A Shock to the System, Part IIalmost 18 years ago
Isoelectric Prefractionation for Proteomicsalmost 18 years ago
Highlights of HPLC 2008: Part IIalmost 18 years ago
Torion Technologies, Inc. Partners with Smiths Detectionalmost 18 years ago
Odds and Ends from the Inboxalmost 18 years ago
Mass Spectrometry in North America and Europealmost 18 years ago
Whitesides to Deliver Pittcon 2009 Plenary Lecturealmost 18 years ago
Thermo Fisher Scientific Receives Microsoft AwardAdvertisement
Related Content
Advertisement


Advertisement
Advertisement
Trending on LCGC International
1
HILIC vs Reversed-Phase LC for Central Carbon Metabolism Profiling
2
Analytical Procedure Lifecycle Approaches in Accordance With ICH Q14 and ICH Q2(R2): Opportunity Knocks or Just Another Challenge and Headache? (Part 2)
3
Py-GC–MS Reveals Microplastics in Playgrounds
4
LC-MS/MS Links Vitamin D Levels to Sleep Timing
5