

Publication|Events|November 1, 2023
- November 2023
- Volume 41
- Issue 10
- Pages: 427–430
Simultaneous Determination of 17 Residual Monomers in Adhesives by Gas Chromatography–Mass Spectrometry
Advertisement
Adhesives are indispensable raw materials in the assembly of electronics and electrical equipment. Residual monomers in adhesives pose a threat to humans and the environment. Therefore, quantitative analysis of residual monomers in adhesives is extremely important. In this paper, a gas chromatography–mass spectrometry (GC–MS) method was established and validated for the simultaneous quantification of 17 residual monomers in adhesives, including 15 acrylates and two acrylamides. The ultrasonic extraction conditions were optimized and determined based on the extraction effect and cost. In addition, the matrix effect of residual monomers in adhesives is widespread. A matrix matching calibration standard with high sensitivity, accuracy, and stability was adopted to reduce the matrix effect on quantification. This method can be used for the determination of multiple residual monomers in adhesives.
Adhesives are indispensable raw materials in the assembly of electronics and electrical equipment. Their environmental performance has been widely studied. In most adhesive products, the number of monomer residues changes after sizing because of the influence of the environment, processes, and other factors. Monomers of acrylamide, acrylic acid, and acrylic esters are commonly used in adhesives and generally added to them as active diluents. These compounds are harmful to the eyes, skin, and the respiratory tract and are highly irritating, corrosive, and carcinogenic (1–3). Prior literature mainly focuses on the determination of the benzene series or acrylate compounds with simple structures in adhesives, and little information is available regarding procedures to accurately quantify common residual monomers in adhesives. Gas chromatography (GC) and high performance liquid chromatography (HPLC) are the two most common methods for analyzing residual monomers because of their simplicity and speed (4–6).
The matrix effect on an analytical assay is caused by one or more undetected components in a sample, except for the specific compound (analyte) to be analyzed. In GC analysis, the matrix effect is attributed to the binding of matrix components to active sites, mainly free silanol groups in the GC inlet and column. When the sample is injected, the polar matrix components tend to block the active sites, reducing the loss of analytes due to the adsorption or degradation of the active sites and resulting in higher response values of the analytes in the matrix solution than in the matrix-free solution. This phenomenon is called the matrix enhancement effect (7). Another potential problem in GC analysis is that non-volatile matrix components gradually accumulate in the GC system and new active sites increase, leading to a decrease in the response value of the analyte. This phenomenon is called the matrix suppression effect (8). This matrix effect depends on the properties of the analyte, matrix type, matrix concentration, and gas chromatography–mass spectrometry (GC–MS) system parameters, and the presence of the matrix effect leads to quantitative errors in GC–MS analysis (9). Since the elimination of the matrix effect is unlikely in practice, analysts often attempt to compensate for this effect using alternative calibration methods, including the (i) standard addition method; (ii) isotopically labeled internal standards; and (iii) matrix-matched standards (10). The implementation of (i) involves extra cost and effort, and can introduce additional sources of analytical errors. Approach (ii) is expensive, especially in multicomponent analyses, where a separate internal standard for each analyte is required. At present, matrix-matched calibration is generally recognized as the most practical approach for compensating for matrix effects. To overcome the matrix effect on quantitative results, the European Union recommends the use of matrix-matched standard calibrations for residue measurements. Therefore, this work aimed to present a simple and rapid analytical procedure for the accurate quantification of 17 residual monomers in adhesives using GC–MS and to explore the matrix effects of the 17 target monomers in adhesive samples, providing a reference for the accurate quantitative analysis of monomer residues in adhesives.
Materials and Methods
Material and Chemicals
Adhesive samples were provided by Wellton (Xiamen) Technology Co., Ltd. The compounds used as analytes (Table I) were obtained from Shanghai Macklin Biochemical Co., Ltd. The reagents and solvents used were acetonitrile, acetone, ethyl acetate, and methanol, all of which were purchased from Sigma-Aldrich. All chemicals were of analytical grade.
Sample Preparation
Five adhesive samples were selected and cured under the specified conditions prior to analysis. Each adhesive sample (approximately 2 g) was evenly applied to 5-cm-diameter aluminum foil. Hot-melt, AB structural, and silicone adhesives were directly cured at 25 ± 2 °C and 60 ± 5% RH for 3 d. UV and UV/moisture-cure adhesives were cured under ultraviolet (UV) light at a wavelength of 365 nm, and then placed in a 25 ± 2 °C and 60 ± 5% RH environment for 3 d. The UV curing time was based on the UV energy required (generally 3000–6000 mJ/cm2) for using the adhesive product. After curing, the sample (1000 ± 10 mg) was crushed to a size of 5 mm × 5 mm and transferred to a 20 mL sample bottle. Acetonitrile (10 mL) was added to the sample bottle, and the mixture was sonicated at 60 °C for 90 min, followed by centrifugation at 10,000 rpm for 2 min. Subsequently, the supernatant was passed through a 0.45 μm nylon filter. The filtrate (1 mL) was analyzed using GC–MS.
Preparation of Standard Solution and Matrix-Matched Standard Solution
Stock standard solutions of monomers (1000 mg/L) were prepared in acetonitrile and stored at 4 °C in the dark. A mixed working standard solution of each monomer at concentrations of 0.5, 1.0, 2.0, 4.0, and 10.0 mg/L was prepared through volumetric serial dilution from each stock standard solution.
The stock standard solutions of monomers were progressively diluted with a blank sample solution to obtain the 0.5, 1.0, 2.0, 4.0, and 10.0 mg/L series of mixed matrix working standard solutions. A negative sample was used to prepare a blank sample solution according to the steps described in Section 1.2.
Instrumentation and GC–MS Method Conditions
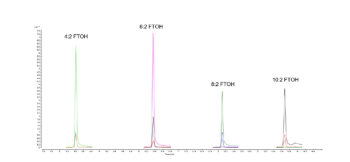
The residual monomer content was determined using GC–MS. The GC–MS analysis was performed using an Agilent Technologies 7890B gas chromatograph coupled to an Agilent Technologies 5977B Mass Selective Detector in selected ions monitoring (SIM) mode. Chromatographic separation was achieved on a fused-silica capillary column (60 m × 250 μm × 1.4 μm) coated with 6% cyanopropyl-phenyl methylpolysiloxane. The injector was operated in split mode with a split ratio of 5:1, and its temperature was maintained at 250 °C throughout the experiments. The column temperature was raised from 60 (2-min hold time) to 240 °C (15-min hold time) at a rate of 20 °C/min. The flow rate of the helium carrier gas was 1 mL/min. The injection volume was 1.0 μL. Electron ionization was achieved at 70 eV. The transfer line, ion source, and quadrupole temperatures were 280, 230, and 150 °C, respectively. Table I shows the quantitative and qualitative ions of 17 described target monomers. A highly reproducible chromatographic separation was achieved (Figure 1).
Results and Discussion
Extraction Method
In this study, the extraction solvent, time, and temperature were optimized. Owing to their high positive rates in hot-melt and UV adhesives, IBMA, IBOA, and IBOMA were selected as analytes. A hot-melt adhesive sample (1 g) containing the residual monomers of IBMA and IBOMA and a UV adhesive sample (1 g) containing the residual monomer of IBOA were selected as the samples. The following experiments were conducted according to the test steps described in Section 1.2.
Selection of Extraction Solvent
The residual monomers used in this study were mainly acrylamide and acrylate compounds, which contain alkenyl and ester group structures. Based on the principle of similar phase dissolution, an organic solvent with good lipid solubility was selected as the extraction solvent. Therefore, four different organic solvents—namely acetone, methanol, acetonitrile, and ethyl acetate—were investigated as extraction solvents. The response intensities (Figure 2a) and extraction efficiencies (Figure 2b) of the four organic solvents were determined.
The experimental results showed that the three residual monomers had the highest response in acetonitrile (Figure 2a). In addition, the corresponding responses of each target monomer in the four solvents differed, which may be related to the expansion coefficient, boiling point of the solvent, and solubility of the target monomer in the solvent. As illustrated in Figure 2b, the extraction efficiencies of these four solvents for IBMA and IBOMA in the hot-melt adhesive are similar, but that for IBOA in the UV adhesive varies widely. The extraction efficiency of methanol for IBOA in the UV adhesive was significantly lower than those of the other three solvents.
In the response and extraction efficiency tests, the responses of the three target monomers in methanol and acetone were relatively low. If the sample is a water-based adhesive, ethyl acetate cannot be used as the solvent because delamination occurs during the extraction process, which affects the test results. However, the experimental results show that acetonitrile is the most suitable extraction solvent because it results in the highest response for the three target monomers, and the extraction efficiency of acetonitrile on the target monomers in the hot-melt and UV adhesives is high.
Extraction Time
If the extraction time is insufficient, the extraction does not reach saturation. However, if the extraction time is too long, the work efficiency and extraction balance are affected. It is impractical to maintain a sufficiently long extraction time to establish equilibrium (11). The effect of extraction time on the peak area was investigated by varying the exposure time from 30 to 150 min. As illustrated in Figure 2c, the extraction efficiencies of IBMA and IBOMA in the hot-melt adhesive are the highest when the extraction time is 90 min. With an increase in the extraction time from 60 to 90 min, the extraction efficiency of IBOA in the UV adhesive sharply increased, whereas with an increase from 90 to 150 min, the peak area slightly increased, and the change trend was relatively gentle.
Extraction Temperature
Increasing the extraction temperature speeds up the movement of analytes and increases their concentration in the liquid phase, improving the extraction efficiency. However, an overly high temperature causes the volatilization of solvents and solutes with low boiling points, thus reducing the distribution coefficient and ultimately leading to the destruction of the extraction balance (12). The extraction temperature tests of the aforementioned hot-melt and UV adhesives were conducted, and the extraction temperature was successively set to 25, 40, and 60 °C (Figure 2d). It was observed that the peak area sharply increased with the increased extraction temperature in the range of 25–40 °C. At higher extraction temperatures, the change trend of the peak area was relatively flat. A higher extraction efficiency was obtained at 60 °C.
Matrix Effect
The matrix effect, or ME(%), was evaluated by comparing the slopes of the solvent and matrix-matched standard curves, according to equation 1 (8,13,14).
where K1 and K2 are the slopes of the matrix-matched and solvent standard curves, respectively. A ME(%) value of zero indicates that the analyte signal is unaffected by the matrix components, and a negative (positive) value indicates that the response of the analyte is suppressed (enhanced) by the matrix components.
The matrix effects were tested for the 17 target monomers in the five adhesives (Figure 3). The matrix effect of each monomer in the different types of adhesives differed, indicating that the matrix effect is related to the matrix type. All monomers showed a matrix reinforcement effect in the AB structural and silicone adhesives and a matrix suppression effect in the hot-melt and UV adhesives. The monomers in the UV/moisture-cure adhesive showed both matrix enhancement and matrix suppression effects. In the same adhesive matrix, the corresponding matrix effect of each monomer was different, which can be attributed to the structural properties of the monomers. IBOMA is similar to IBOA in structure, with only one additional methyl group. The results showed that the ME(%) values of IBOMA in the five different adhesives were lower than those of IBOA, probably because of the hydrophobic nature of and the increased nonpolar carbon atoms in the analyte, which reduced the matrix enhancement effect (9).
Method Performance
Matrix-matched calibration was used to compensate for the matrix effects. Because all the monomers showed obvious matrix enhancement and suppression effects in the AB structural and hot-melt adhesives, respectively, the matrix working standard solutions of the target monomers in the blank sample solutions of these two adhesives were selected for method validation (Table II).
To establish the calibration curves, the mixed matrix working standard solutions were brought to 25 °C and a 1.0 μL aliquot was injected into the GC–MS. All correlation coefficients were >0.9985. The limits of detection (LODs) ranged from 0.05 to 0.11 mg/L, and the limits of quantitation (LOQs) ranged from 0.18 to 0.37 mg/L. The recoveries of all monomers in both matrices fell within a reasonable range of 80%–120%. The relative standard deviations (RSDs) were acceptable. Therefore, the developed method exhibited high sensitivity, accuracy, and stability for the separation and analysis of the 17 monomers in adhesives.
Method Application to Adhesive Samples
The GC–MS procedure described above was applied to determine the residual monomers in the five adhesives (AB structural, silicone, UV/moisture-cure, hot-melt, and UV adhesives) (Table III). According to the test results, the IBMA, IBOA, and IBOMA had relatively high positive rates for the adhesives. The adhesives had few monomer residues, except for the silicone adhesive; some of them were high in content. There was almost no residual acrylamide or acrylate monomer in the silicone adhesive, which can be attributed to the silicone adhesive being mainly composed of fillers and linear polysiloxane with a high molecular weight. Generally, no active diluent was added.
Conclusion
A method for determining 17 residual acrylate and acrylamide monomers in adhesives is proposed in this study. A matrix matching calibration standard was adopted to reduce the impact of the matrix effect on quantification. Method validation proved that the developed method exhibited high sensitivity, accuracy, and stability for the separation and analysis of 17 monomers in the adhesives. According to the test results for the adhesive samples, IBMA, IBOA, and IBOMA had high positive rates. This study provides a reference for the accurate quantitative analysis of monomer residues in adhesives and standardizes the selection of adhesives for equipment manufacturers.
Acknowledgments
This work was supported by a grant from the National Key Research and Development Program of China (No. 2022YFD1700105).
References
(1) Tokumura, F.; Matsui, T.; Suzuki, Y. et al. The Potential Dermal Irritating Effect of Residual (Meth)acrylic monomers in Pressure Sensitive Adhesive Tapes. Drug Chem. Toxicol. 2010, 33 (1), 1–7. DOI: 10.3109/01480540903311043
(2) Suh, M.; Proctor, D.; Chappell, G. et al. A Review of the Genotoxic, Mutagenic, and Carcinogenic Potentials of Several Lower Acrylates. Toxicology 2018, 402–403, 50–67. DOI: 10.1016/j.tox.2018.04.006
(3) Sun, F.; Hu, Y. L.; Zhu, G. Q. et al. Determination of Residual Monomers in Synthesized Acrylic PSAs by Gas Chromatography. J. Adhes. Sci. Technol. 2010, 24 (2), 347–357. DOI: 10.1163/016942409X12584625925141
(4) Wong, R. S. H.; Ashton, M.; Dodou, K. Analysis of Residual Crosslinking Agent Content in UV Cross-Linked Poly(ethylene oxide) Hydrogels for Dermatological Application by Gas Chromatography. J. Pharm. Anal. 2016, 6 (5), 307–312. DOI: 10.1016/j.jpha.2016.04.004
(5) McCabe, J. F.; Basker, R. M. Tissue Sensitivity to Acrylic Resin. A Method of Measuring the Residual Monomer Content and Its Clinical Application. Br. Dent. J. 1976, 140 (10), 347–350. DOI: 10.1038/sj.bdj.4803760
(6) Maštovská, K.; Lehotay, S. J.; Anastassiades, M. Combination of Analyte Protectants to Overcome Matrix Effects in Routine GC Analysis of Pesticide Residues in Food Matrixes. Anal. Chem. 2005, 77 (24), 8129–8137. DOI: 10.1021/ac0515576
(7) Poole, C. F. Matrix-Induced Response Enhancement in Pesticide Residue Analysis by Gas Chromatography. J. Chromatogr. A 2007, 1158 (1–2), 241–250. DOI: 10.1016/j.chroma.2007.01.018
(8) Yaroshenko, D. V.; Kartsova, L. A. Matrix Effect and Methods for Its Elimination in Bioanalytical Methods Using Chromatography-Mass Spectrometry. J. Anal. Chem. 2014, 69 (4), 311–317. DOI: 10.1134/S1061934814040133
(9) Saka, K.; Kudo, K.; Hayashida, M. et al. Relationship Between the Matrix Effect and the Physicochemical Properties of Analytes in Gas Chromatography. Anal. Bioanal. Chem. 2013, 405 (30), 9879–9888. DOI: 10.1007/s00216-013-7433-9
(10) Hercegová, A.; Húšková, R.; Matisová, E. Evaluation of Different Calibration Approaches in Pesticide Residues Analysis in Non-fatty Food Using Fast GC-MS. Int. J. Environ. Anal. Chem. 2010, 90 (3–6), 188–204. DOI: 10.1080/03067310902871281
(11) Taghizadeh, S. M.; Yamini; Y.; Naeeni, M. H.; Mohamadnia, F.; Moghadam, R. S. Determination of Residual Monomers in Latex by Headspace Hollow Fiber Protected Liquid-Phase Microextraction Combined with High-Performance Liquid Chromatography. Polym. Test. 2012, 31 (2), 297–303. DOI: 10.1016/j.polymertesting.2011.11.001
(12) Feng, Y. C.; Zhang, Z.; Feng D. D. et al. Optimization of Determination Method of Cooling Agents in Cigarette Tipping Paper by Gas Chromatography. LCGC N. Am. 2022, 40 (4), 180–185. DOI: 10.56530/lcgc.na.dz7880w9
(13) Lazzari, E.; Silva, E. A. S.; Bjerk, T. R.; Schneider, J. K. Evaluation of the Matrix Effect in the Quantitative Bio-Oil Analysis by Gas Chromatography. Fuel 2021, 290, 119866. DOI: 10.1016/j.fuel.2020.119866
(14) Xu, J.; Long, X. F.; Ge, S. J. et al. Deposition Amount and Dissipation Kinetics of Difenoconazole and Propiconazole Applied on Banana with Two Commercial Spray Adjuvants. RSC Adv. 2019, 9 (34), 19780–19790. DOI: 10.1039/c9ra02874a
Minxia Pan, Lanlan Zhang, Xiaoqin Liu, Dongling Liu, Yumei Qin, and Honglian Yan are with the Institute of Chemical Analysis at GRG Metrology & Test Group Co., Ltd., in Guangzhou, China. Direct correspondence to:
Articles in this issue
Advertisement
Related Content
Advertisement


Advertisement
Advertisement
Trending on LCGC International
1
GC-MS/MS Links Tooth-Layer Pollutant Traces to Autism Risk
2
Sample Preparation Strategies for PFAS Analysis
3
AI/ML in Practice: Machine-learning Prediction of Chromatographic Retention Times for Small Molecules in Pharmaceutical Applications
4
Ep. 46: Live from Pittcon with Award Winners Bob Pirok and Justin Godinho
5