

|Articles|October 8, 2019
- The Column-10-08-2019
- Volume 15
- Issue 10
Tips & Tricks GPC/SEC: Systematic Errors in GPC/SEC/GFC
Author(s)Daniela Held
The accuracy of a measurement describes how close the measured result is to the true value. Accuracy is influenced by systematic errors, which are difficult to detect even for experienced scientists.
Advertisement
The accuracy of a measurement describes how close the measured result is to the true value. Accuracy is influenced by systematic errors, which are difficult to detect even for experienced scientists.
Gel permeation chromatography/sizeâexclusion chromatography (GPC/SEC) results and their validity are crucial in many applications, for example, as part of quality control/quality assurance (QC/QA) tests in pharmaceutical applications, such as antithrombotic heparin, dextran, or hydroxyethyl starch in emergency care. Equally important are the registration of polymeric products or formulations with regulatory agencies, such as U.S. Food and Drug Administration (FDA) and European Chemicals Agency (ECHA), to ensure nonâtoxicity and safe and environmentally friendly product use. Obviously, the accuracy and precision of GPC/SEC results are an important issue.
However, every chromatography user knows from experience that many experimental details can influence the result and the final analytical quality of an experiment. Random and systematic errors will result in deviations of the measured value from its true value (1).
Random vs. Systematic Errors
Random errors are caused by unknown and unpredictable influences in an analysis. They have no specific pattern and are unavoidable. Typical sources for random errors are detector signal quality ([electronic] noise, drift, wander) and system stability (flow rate and temperature fluctuations).
Random errors limit the precision of a result meaning they determine how close measurements of the same property agree with each other. They can be determined by repeating a measurement.
Random errors cannot be avoided, but some of them can (and should) be monitored. Their influence on results has been thoroughly investigated (2). In addition, statistical models are very well suited to quantify random result deviations from the true (or generally accepted) value. Thus, a result uncertainty can be determined from random errors (3).
Systematic errors result in a consistent deviation, either a fixed amount or a proportion such as 80% of the true value. Typical sources for systematic errors in GPC/SEC are defective or incorrect equipment or an unsuited method. If an analysis is repeated, the same deviation will be obtained.
Systematic errors limit the accuracy of a result meaning they determine how close the measured result agrees with the true value. They can be avoided if users have sufficient training and time to perform their work.
Figure 1 shows the weight average molar mass result, Mw, for 20 GPC/SEC experiments of the same sample. The green line represents the true Mw value. The black squares are the results obtained using suitable, well-maintained equipment and a suitable GPC/SEC method with appropriate calibration. They show typical random errors.
While systematic errors are consistently seen in the same direction, random errors produce different values in random directions. The blue triangles are the results using a method with a systematic error. The typical random errors are observed and cannot be avoided. The systematic error can be identified because there is a deviation from the true result, a shift to lower molar mass averages.
The turquoise triangles show results that exhibit a systematic error, the random error, and a trend for the first 15 data points.
Systematic Errors in GPC/SEC
GPC/SEC is a specific liquid chromatography (LC) technique for the characterization of natural and synthetic macromolecules. The primary goals in GPC/SEC are the determination of the molar mass averages, the molar mass distribution, and the investigation of sample purity.
Typical systematic errors in GPC/SEC include:
- Selection of unsuited mobile phase and additives
- Selection of improper stationary phase (chemistry, column dimension, particle size, pore size, and separation range)
- Wrong sample preparation (sampling, sample treatment, concentration)
- Inadequate analysis conditions (flow rate, injection volume, temperature)
- Improper calibration (type and number of reference materials, data fitting)
- Unsuitable detection method (UV: wavelength)
- Wrong meta data (dn/dc in light scattering detection, other evaluation parameters).
Many of the Tips & Tricks instalments have dealt with avoiding such systematic errors and are a valuable source of information (4–8). National and international guidelines, such as ISO 13885 (-1 for THF, -2 for DMAc, and -3 for water as mobile phase), also help to avoid many common errors with respect to column or instrument performance, sample handling, and preparation and calibration.
Participation in round robin tests, validation kits, and system qualification can help to identify systematic errors in operations.
For applications where the true molar mass is not required, systematic errors are sometimes known and can be accepted when they still allow for meaningful, reproducible, and long-term stable results. However, this requires following detailed and structured protocols and a consistent supply chain of all products is required for the chromatographic separation.
GPC/SEC Specialities
One of the most important aspects to keep in mind when discussing systematic errors in GPC/SEC is that this technique separates based on the hydrodynamic volume of a molecule in solution.
The molar mass information is obtained from a chromatogram by either calibrating the elution volume axis with molar mass reference materials or by applying an onâline light scattering detector to allow the molar mass in every elution volume slice to be determined. Compared to other LC techniques, the molar mass calibration is a unique requirement for GPC/SEC.
The calibration by reference materials of known molar mass is referred to as conventional GPC/SEC. Here, only concentration detectors, such as differential refractive index, DRI, or a UV detector are required.
The second approach is referred to as GPC/SEC with molar mass sensitive detection and many different abbreviations are used (GPC/SEC–[MAL]LS, SEC–MALS, triple detection, and others).
The contribution of systematic errors to these two approaches are very different.
Conventional GPC/SEC: The common practice in conventional GPC/SEC is to use reference materials with a narrow molar mass distribution. It is common practice to use calibrants of a different chemical nature to the analyte, although this introduces a systematic error. This approach will allow for reproducible (high precision) but not accurate results.
The most common calibrants are:
- Polystyrene (PS) for the work in organic solvents, such as tetrahydrofuran (THF), toluene, or dichlorobenzene, and polymethyl methacrylate
- PMMA for medium polar organic solvents, such as dimethylacetamide (DMAc), dimethyformamide (DMF), or dimethylsulfoxide (DMSO)
- Dextrans, pullulans, polyethylene oxide (PEO), and proteins in aqueous eluents
It is important to remember that results from different laboratories can only be compared if the calibration materials exhibit the same chemistry and structure. Both properties influence the hydrodynamic volume. Special attention is required when dextran calibrants are used. Dextran from different sources exhibits different degrees of branching. Compared to a linear molecule, a branched molecule of the same mass exhibits a smaller hydrodynamic volume. It will elute later and thus a lower molar mass will be assigned. To avoid this additional parameter, a calibration with linear polysaccharides, such as pullulans, are preferred.
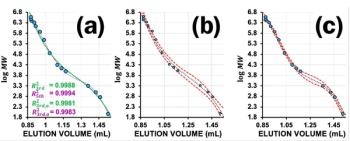
Figure 2 shows the influence of the choice of calibration reference materials on the results for a conventional GPC/SEC analysis in an aqueous mobile phase. The blue curve was obtained using protein standards for calibration, while the purple one was obtained using pullulan standards. As the hydrodynamic volumes of these substances are very different, the molar mass results are different (systematic error).
GPC/SEC-Light Scattering: A static light scattering detector can help to overcome some limitations of conventional GPC/SEC. A light scattering detector eliminates the need for establishing a calibration curve with narrow distribution molar mass reference standards. However, adding a light scattering detector increases the complexity of the setup and introduces different sources for systematic errors. These result from the requirement of using specific evaluation parameters for GPC/SECâlight scattering (2).
One major difference between conventional GPC/SEC and GPC/SECâlight scattering is that the latter requires the precise knowledge of the slice concentration. Anything that will influence the concentration will influence the molar mass results. Thus, a wrong injection volume will lead to different results in GPC/SEC-light scattering, but not in conventional GPC/SEC. Another very important evaluation parameter in GPC/SEC-light scattering is the refractive index increment, dn/dc (9). This is required for GPC/SEC-light scattering, but not for conventional GPC/SEC.
Figure 3 shows molar mass distribution results for the same sample analyzed with GPC/SEC-light scattering when applying different evaluation parameters. The green curve represents the true molar mass distribution obtained with the correct evaluation parameters. The other results are obtained after introducing systematic errors. Incorrect values for the dn/dc and the two detector constants have been used to demonstrate the influence on the final molar mass result. In conventional GPC/SEC the incorrect parameters would not have influenced the results, the molar mass distribution results would have remained the same.
Result Trends
Figure 1 shows an example of a data set (turquoise triangles) where (besides the systematic and random errors) a trend in the results can be observed. The weight average molar mass increases with the injection number until it reaches a plateau where only the random and systematic errors influence the result.
There are several systematic errors that could explain such an observation:
1) Sample preparation issue: At the beginning of the injection sequence the molecules have not yet been fully dissolved. Therefore, they elute later and lower molar mass are assigned. Additional dissolution time would be required here. This is a likely error especially for high molar mass samples.
2) Stationary phase is not yet fully equilibrated: Due to a change in temperature or mobile phase, the columns are not fully equilibrated so that the elution volume is not constant. A larger equilibration time is required here.
3) Sample components unintentionally change the stationary phase polarity: This is an effect sometimes referred to as column priming where reactive sites on the stationary phase need to be saturated by sample components before an interactionâfree elution with constant elution volume is observed. Often such behaviour is observed with new columns.
4) Flow rate change: At the beginning of the injection sequence the flow rate is not stable either because of a problem with the pump in general or because of a temperature change or air in the system. Again, waiting patiently for the system to be in equilibrium state helps to overcome the problem.
While an internal standard or flow marker can help to identify the not fully equilibrated system case (2 and 4 from the list above), a very detailed standard operation protocol can help to overcome the effects described in 1 and 3 and can enhance the reproducibility of the results.
Summary
- Results from any analytical method suffer from random and systematic errors.
- Random errors are unavoidable, unpredictable, and limit the precision. Systematic errors produce consistent errors and limit the accuracy.
- Random errors should be monitored and the result uncertainty can be determined from that.
- Typical sources for systematic errors in GPC/SEC are the choice of the column and calibration.
- Conventional GPC/SEC is strongly influenced by the choice of reference materials. GPC/SEC–MALLS and triple detection are mainly influenced by concentration and dn/dc.
References
- P. Kilz and F. Gores, The Column4(2), (2008).
- D. Held and P. Kilz, inQuantification in LC and GC, S. Kromidas and H.-J. Kuss, Eds. (WileyâVCH, Weinheim, Germany, 2009).
- D. Held and P. Kilz, The Column8(10), 14–20 (2012).
- T. Hofe, The Column3(2), (2007).
- D. Held and T. Hofe, The Column5(10), 17–19 (2009).
- D. Held, The Column10(10), 12–15 (2014).
- W. Radke, The Column14(6), 9–12 (2018).
- T. Hofe and D. Held, The Column5(6), 9–12 (2009).
- D. Held and P. Kilz, The Column12(14), 10–14 (2016).
Daniela Held studied polymer chemistry in Mainz, Germany, and works in the PSS software and instrument department. She is also responsible for education and customer training.
Peter Kilz studied polymer chemistry in Mainz, Germany, and Liverpool, UK. He is one of the founders of PSS and head of the software and instrument department. He is also involved in customer support and training.
E-mail:
Articles in this issue
almost 7 years ago
Automating Analysis of Antibiotics in Bloodalmost 7 years ago
Knauer Joins Industrial Sustainability Research Projectalmost 7 years ago
Thermo and Cedar-Sinai Announce Collaborationalmost 7 years ago
Improving Food Quality Control Using UHPLC–MSalmost 7 years ago
Markes Receives Two Queen’s Awards for Enterprisealmost 7 years ago
Vol 15 No 10 The Column October 2019 Europe & Asia PDFalmost 7 years ago
Vol 15 No 10 The Column October 2019 North American PDFAdvertisement
Related Content
Advertisement


Advertisement
Advertisement
Trending on LCGC International
1
How Should You Respond to FDA 483 Observations?
2
LC-MS/MS Finds PFAS Migration from Stuffed Toys
3
Analytical Procedure Lifecycle Approaches in Accordance With ICH Q14 and ICH Q2(R2): Opportunity Knocks or Just Another Challenge and Headache? (Part 2)
4
LC-MS/MS Links Vitamin D Levels to Sleep Timing
5