

Publication|Events|February 15, 2024
- February 2024
- Volume 20
- Issue 2
- Pages: 14–18
Calibrating the Low Molar Mass Range in GPC/SEC Using Oligomer Peaks
Author(s)Wolfgang Radke
Advertisement
The determination of molar mass and molar mass distributions by GPC/SEC requires relating the elution volume to the molar mass of the eluting macromolecule. This is typically done using a calibration curve. Reliable calibration curves in the low molar mass region can be obtained when using the elution volumes of all separated oligomers of low molar mass standards on high resolution columns. This article explains how to do this.
Calibration in GPC/SEC
Gel permeation chromatography (GPC), also named size exclusion chromatography (SEC), is a liquid chromatographic technique that separates macromolecules according to their size in solution. GPC/SEC is performed in columns filled with porous particles. Molecules of a size larger than the pores cannot enter the pores and are driven forward by the flowing eluent. Molecules of a size comparable to the pore size can diffuse in and out of the pores and therefore elute later. Since the size of a macromolecule is related to its molar mass, the higher molar masses elute first and lower molar masses later. The molar mass range that can be separated on a column or column combination depends on the pore size and pore size distribution of the column or column combination applied.
The main purpose of GPC/SEC is the determination of molar mass distributions and molar mass averages of macromolecular or polymeric samples. To achieve this goal, the elution volume needs to be correlated with the molar mass of the eluting species. This is usually achieved by injecting a series of narrowly distributed standards. Other ways of calibration are also available (1–3) but beyond the scope of this article. The standards are run under identical chromatographic conditions as the sample to be analyzed. Figure 1 shows the chromatograms obtained for a series of polystyrene standards on a GPC/SEC column or column combination bank suited to separate a large molar mass range.
For each standard, the elution volume at the peak maximum of the chromatogram is determined and plotted against the logarithm of molar mass. Finally, a suitable fitting function is applied to the data points.
The process of determining the molar mass distribution of an unknown sample involves analyzing the concentration of its elution fraction. This is achieved by using a concentration detector, often a differential refractive index detector (DRI or RI). From the elution volume data, we construct a calibration curve to determine the molar mass of the corresponding fraction.
However, it is crucial to recognize that the calculated molar mass of the analyte relies on the chemical structure of the standards used. Only when the standards’ chemical structure matches that of the analyte can we obtain the true molar mass. The size of macromolecules with the same molar mass varies with their chemical structures and the solvent environment. Therefore, comparing molar masses determined by conventional GPC/SEC across different laboratories is meaningless without considering the type of calibrant and the solvent applied.
Calibration Using Well-Separated Oligomers
We often need to determine the fraction of material with a molar mass lower than 500 or 1000 g/mol. To achieve this with high reliability, we use a column combination that provides high resolution in the low molar mass range. In addition, the calibration curve must be accurate. Typically, sets of GPC/SEC-standards contain 10 to 12 calibration standards covering a molar mass range spanning three to four decades. This means that only two to three different standards provide molar masses below 1000 g/mol. Consequently, the calibration curve is often not well defined in the low molar mass region.
However, when we use high-resolution columns, a low molar mass standard might be separated into a series of distinct peaks. Each peak corresponds to a well-defined oligomer, with a specific molar mass. Consider the chromatogram of a highly resolved low molar mass polystyrene standard of molar mass of MP = 370 Da (Figure 3). The peaks represent a series of polystyrene oligomers. These oligomers consist of an initiator, styrene units, and a proton resulting from their synthesis. In polystyrene standards, the initiator end is typically a butyl unit (Figure 2). The smallest molar mass polystyrene oligomer has a mass of 162 Da. Calculating the molar masses of the higher styrene oligomers is straightforward using the formula from Figure 2.
The easiest and most reliable way to assign the correct molar masses to the peaks of the oligomeric standard is by injecting a monodisperse reference material, for example, hexylbenzene in case of polystyrene, often provided by manufacturers in their calibration kits. By overlaying the chromatogram of the monodisperse reference with the chromatogram of the oligomer mixture, the peak of the corresponding oligomer and the correct molar mass can be clearly assigned (Figure 3). The molar masses of the resolved next higher oligomers are then calculated by adding the molar mass of the repeating unit.
If no such monodisperse reference is provided with your calibration kit, the manufacturer of your standard may provide you with information on the initiating and terminating groups. With this information you may order the corresponding substance. Typical end-groups and molar masses of some commonly available GPC/SEC standards are provided in Table 1 for oligomers up to degree of polymerization (DP) = 5.
If neither a monodisperse reference nor structural information on the end-groups of the standards are available, the nominal molar mass of the standard is assigned to the most intense oligomer (the peak with the highest signal). For the lower and higher oligomers, we calculate their molar masses by adding or subtracting suitable multiples of the molar mass of the repeating unit.
Sometimes, we encounter two peaks with similar intensities. In such cases we arbitrarily assign the nominal peak molar mass to one of the peaks. The other molar masses are assigned to the remaining peaks using the same method as before, to create the calibration curve. Using this calibration curve, we evaluate the entire elution range of the standard with respect to the weight or the number average molar mass. If the peak molar mass was assigned to the wrong peak, the calculated average molar mass will deviate significantly from the value provided in the certificate of the standard. In such cases the peak molar mass should be reassigned to the next most intense peak.
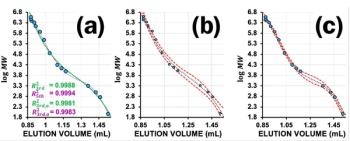
An example is shown in Figure 4. The chromatogram shows two peaks of similar intensity. The challenge is deciding which peak corresponds to the certified molar mass at peak maximum. When assigning the certified molar mass at peak maximum (MP = 370 Da) to the third peak (red numeration), the red calibration curve in Figure 5 results. Determining average molar masses of this standard against the red calibration curve results in weight and number average molar masses of Mw = 399 Da and Mn = 321 Da. These values are lower by approximately 100 Da, or approximately 25%, as compared to the certified values (Mw = 498 Da, Mn = 435 Da). However, when the molar mass of MP = 370 Da is assigned to the second peak of the chromatogram (black numeration), the black calibration curve in Figure 5 is obtained. Calculating weight and number average molar mass using the black calibration curve results in a much better agreement between the experimental (Mw = 507 Da, Mn = 466 Da) and the certified molar masses. Thus, the assignment of the black numeration in Figure 4 is the correct one. This is also proven by comparing the chromatogram with a known uniform reference material (Figure 3).
By assigning molar masses to the different resolved peaks of an oligomeric standard, a dense series of calibration points is produced for the oligomers in the low molar mass elution range (Figure 5). For the higher molar mass standards that are not separated into individual oligomers, the nominal molar masses are assigned to the peak maxima. The higher number of data points in the low molar mass region results in a very accurate calibration curve. This in turn allows for precise determination of weight fractions below, for example, 500 or 1000 Da, which are often requested for certification purposes.
Summary
Certifying macromolecular materials often involves determining the fraction of oligomers present. Using specialized columns that provide high resolution in the oligomeric region can help us to identify individual peaks more clearly.
When low molar mass standards provide well-resolved peaks in GPC/SEC, individual peaks can be used to improve calibration precision in the low molar mass region.
Molar mass assignment to oligomer peaks can be done by comparing the elution of a reference material.
Alternatively, initially assign a molar mass to one of the peaks and create a calibration curve. Correctness of the calibration is then checked by comparing the average molar masses of the standard to its certified values.
References
(1) Held, D.; Radke, W. Tips & Tricks GPC/SEC: Cumulative Distributions and Cumulative Match Calibration. Column 2021, 17 (1), 27–31.
(2) Held, D.; Radke, W. Tips & Tricks GPC/SEC: Alternatives to Narrow Standard Calibration in GPC/SEC. Column 2020, 16 (11), 33–37.
(3) Radke, W.; Held, D. Tips & Tricks GPC/SEC: Calibration Using Broad Standards. Column 2015, 11 (2), 10–15.
Wolfgang Radke studied polymer chemistry in Mainz (Germany) and Amherst (Massachusetts, USA) and is head of the contract analysis department at PSS – Part of Agilent. He is also involved in customer support and customized trainings. E-mail:
Articles in this issue
over 2 years ago
Analysis of Accutrace Plus Marker in Fuels with GC–MSover 2 years ago
Event Preview: HTC-18over 2 years ago
Knauer Founder, Herbert Knauer, Dies at 92over 2 years ago
LCGC International Expands News Coverageover 2 years ago
Cal State and Leco Launch Chemical Analysis Laboratoryover 2 years ago
Vol 20 No 2 The Column February 2024 North America PDFover 2 years ago
Vol 20 No 2 The Column February 2024 Europe PDFAdvertisement
Related Content
Advertisement


Advertisement
Advertisement
Trending on LCGC International
1
How Should You Respond to FDA 483 Observations?
2
LC-MS/MS Links Vitamin D Levels to Sleep Timing
3
LC-MS/MS Finds PFAS Migration from Stuffed Toys
4
Analytical Procedure Lifecycle Approaches in Accordance With ICH Q14 and ICH Q2(R2): Opportunity Knocks or Just Another Challenge and Headache? (Part 2)
5