

|Articles|April 16, 2018
- The Column-04-16-2018
- Volume 14
- Issue 4
Tips & Tricks GPC/SEC: How Do Calibration Curves Influence GPC/SEC Results?
Author(s)Daniela Held
Gel permeation chromatography/size-exclusion chromatography (GPC/SEC) is a relative method and that requires a calibration to obtain molar mass distribution information. The way that the type of calibrants and the quality of the calibration curve influences the results is discussed in this instalment of Tips & Tricks.
Advertisement
Daniela Held, PSS Polymer Standards Service GmbH, Mainz, Germany
Gel permeation chromatography/size-exclusion chromatography (GPC/SEC) is a relative method and that requires a calibration to obtain molar mass distribution information. The way that the type of calibrants and the quality of the calibration curve influences the results is discussed in this instalment of Tips & Tricks.
Gel permeation chromatography/size-exclusion chromatography (GPC/SEC) is used to determine the complete molar mass distribution of synthetic and natural polymers. However, GPC/SEC is a relative method because the primary information from conventional GPC/SEC detectors, such as refractive index (RI), ultraviolet (UV), or evaporative light scattering detection (ELSD), is not the molar mass distribution, but the apparent concentration as a function of elution volume. To obtain the desired molar mass distribution and the molar mass averages therefore requires assigning molar masses to the elution volumes, that is, establishing a calibration curve.
There are various ways to perform this calibration. The most common approaches use reference materials of known molar mass with narrow or broad molar mass distributions (1,2,3). It is important to keep in mind that GPC/SEC separations are based on the hydrodynamic volume and not on molar mass. If calibrants and samples are chemically or structurally different, relative molar masses are obtained with respect to the calibrants used. Therefore, the most appropriate choice of the calibrant chemistry is essential.
Why are GPC/SEC Calibration Curves Different?
As mentioned above, GPC/SEC separates based on the hydrodynamic volume of a molecule in solution. The hydrodynamic volume depends, amongst other factors, on the chemical structure and the topology of the sample, on solvent, and on temperature. The dependence on topology means that a linear molecule and a branched molecule of the same molar mass have different hydrodynamic sizes and therefore do not elute at the same, but at different, elution volumes. Similarly, polystyrene (PS) and polymethyl methacrylate (PMMA) of the same molar mass exhibit different sizes in solution and elute at different volumes. Therefore, a calibration curve depends on the type of reference material used for its construction.
Figure 1 shows an example of two different calibration curves obtained for the same column set and the same solvent operated at the same temperature. The purple curve was obtained using 12 PS reference materials with different molar masses and narrow molar mass distributions. The blue curve was obtained using 12 PMMA standards. It is clearly visible that both calibration curves do not overlap and deviate, particularly in the higher molar mass region.
Figure 2 shows the results obtained when using the two calibration curves to evaluate an unknown sample. Approximately 20% lower molar masses are determined when the PS curve is applied instead of the PMMA curve. Therefore, it is important to report the calibration conditions together with the final results, especially when inter-laboratory data comparisons are required. If laboratories use the same reference materials to calibrate, results will be comparable; if different calibration standards are used results will most probably be different.
For some applications, accurate molar mass results are required. To increase the accuracy of molar mass results:
- matching standards can be used,
- online static light scattering (4) or viscometry (5) can be applied,
- conversion of the calibration curve using the Mark-Houwink coefficients can be performed.
Influence of the Calibration Fit Function
To construct a calibration curve, data pairs molar mass and elution volume are plotted in a graph where the logarithm of the molar mass is on the y-axis and the elution volume is on the x-axis (compare Figure 1). To obtain a calibration curve these data points have to be fitted.
In GPC/SEC typical fit functions are very often not linear. There are specially designed linear columns available, however, they are only linear in the molar mass range they are optimized for. Close to exclusion and penetration limit deviations from the linear behaviour are quite typical.
GPC/SEC software packages therefore offer polynomial functions of higher degree to fit the data accurately. Calibration curves fitted with a polynomial function of third degree (cubic) are very common. Although the visible difference is small, the effect of the molar masses derived by using the different calibration curves is significant because the ordinate presents the logarithm of molar mass (see Figure 2).
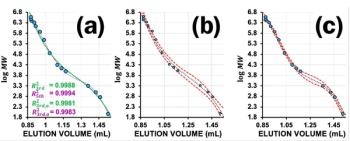
A typical problem for users is to evaluate the quality of the fit function. Unfortunately, the regression coefficient, R, is not a sensitive measure. Besides R, the deviation of the single data points and the first derivative should be reviewed (1). Figure 3 shows an example of molar mass distributions obtained using the same PS calibration points, but fitted using different polynomials. While the red curve shows the results obtained using a quadratic fit (polynomial 2nd degree), the green curve shows the results derived from a cubic fit (polynomial 3rd order).
For the red curve the regression coefficient is R = 0.99894 with maximum deviations for single points being just below ± 20%. The regression coefficient for the green curve is R = 0.99994 with maximum deviations for single point being just below ± 6%. Although both regression coefficients seem to be very good, it is clear that the results for the green trace are more reliable. This is also reflected in the measurement uncertainty. The lower fit quality and larger deviations result in a higher uncertainty in the derived molar masses. If only R is available to judge the fit quality, a traditional rule-of-thumb requests the regression coefficient R to be higher than 0.999 to produce reliable results.
Please note that for the example in Figure 2, the measurement uncertainty of the PS and the PMMA results is comparable because the raw data quality and the fit quality (number of data points, maximum deviation) are also comparably high. While it is possible to estimate the measurement uncertainty based on errors including fit quality, it is not possible for a software package to quantify effects based on systematic errors, such as using chemically different calibration standards (6).
Calibrated Region
As shown above, the molar mass results are influenced by the fit quality. However, the number of data points and the calibrated region also play significant roles.
At least four molar mass standards for each molar mass decade are recommended to construct the calibration curve. In addition, the standards should cover the whole molar mass separation range of the column (column set) to get a true picture of the column separation characteristics. It is important that the number of reference materials eluting close to the exclusion limit and to the total penetration limit is sufficient, so that fitting the data in that region is easier.
Stable and reliable results will only be obtained if the unknown samples elute in the elution volume region fully covered by the calibration standards. Those fractions of the sample eluting outside the calibrated region will affect the derived molar masses in an unpredictable fashion, irrespective of how the software package extrapolates the calibration curve.
Figure 4 shows an example of an unknown sample analyzed using calibration curves that fully cover the sample elution volumes (green) and a curve that excludes some of the higher molar masses of the sample (red). The green calibration curve consists of 12 calibration points with the black and the green dot indicating the lowest and highest molar mass standard. The red curve consists of only eight calibration points. The four highest calibration points (green, turquoise, blue, and purple spots) have been removed to obtain a (red) calibration curve with the black and the red dot indicating the lowest and highest molar mass standard.
Figure 5 compares the results obtained from the same chromatograms using the two different calibration curves. It shows that deviations from true results are expected when a significant part of the sample elutes in a noncalibrated region and when data points are missing to describe the calibration curve characteristics in this region properly.
Summary of Improving GPC/SEC Results
- GPC/SEC calibrants should be selected carefully. If possible, they should match the sample chemistry and topology, otherwise relative results are obtained.
- The fit function selected to fit the single data points has a big influence on the precision of the results. The regression coefficient alone is not a sensitive measure. If possible, review deviations and first derivative. If only R is available, it should be above 0.999.
- Make sure the calibration curve covers the complete elution volume range of the samples.
- Use at least four calibration standards per decade and make sure the number of calibrants is sufficient, especially in the regions close to exclusion and total penetration limit. This avoids reporting wrong results obtained from the use of extrapolated calibration data, which do not provide a true reflection of the columns pore size distribution (and therefore separation characteristics). Preconfigured calibration kits for columns take care of these issues for most setups
References
- D. Held, The Column4(6), 18–21 (2008).
- W. Radke and D. Held, The Column11(2), 10–15 (2015).
- D. Held and P. Kilz, The Column9(14), 11–15 (2013).
- D. Held and P. Kilz, The Column5(4), 28–32 (2009).
- D. Held, The Column8(2), 12–16 (2012).
- D. Held and P. Kilz, The Column8(10), 14–20 (2012).
Daniela Held studied polymer chemistry in Mainz, Germany, and works in the PSS software and instrument department. She is also responsible for education and customer training.
E-mail:
Articles in this issue
over 8 years ago
Trends and Developmentsover 8 years ago
Agilent and Imperial College London Announce Collaborationover 8 years ago
Comprehensive Proteomic Analysis of Dog Salivaover 8 years ago
Solving the Problem or Merely Addressing the Issue?over 8 years ago
Vol 14 No 4 The Column April 2018 Europe and Asia PDFover 8 years ago
Vol 14 No 4 The Column April 2018 North American PDFAdvertisement
Related Content
Advertisement


Advertisement
Advertisement
Trending on LCGC International
1
HPLC, PTR-ToF-MS Enable AI Grading of White Tea
2
Py-GC–MS Reveals Microplastics in Playgrounds
3
Analytical Procedure Lifecycle Approaches in Accordance With ICH Q14 and ICH Q2(R2): Opportunity Knocks or Just Another Challenge and Headache? (Part 2)
4
LC-MS/MS Links Vitamin D Levels to Sleep Timing
5