
|Articles|December 17, 2018
- The Column-12-17-2018
- Volume 14
- Issue 12
Tips & Tricks GPC/SEC: What You Need to Know to Allow for Efficient GPC/SEC Troubleshooting
Author(s)Daniela Held
Although modern GPC/SEC instruments are generally very reliable, scientists sometimes encounter problems. This instalment of GPC/SEC Tips & Tricks offers advice on how to efficiently identify the root cause of problems, such as dealing with a too high pressure, loss of resolution, or drifting baselines.
Advertisement
Although modern gel permeation chromatography/size-exclusion chromatography (GPC/SEC) instruments are generally very reliable, scientists sometimes encounter problems. This instalment of GPC/SEC Tips & Tricks offers advice on how to efficiently identify the root cause of problems, such as dealing with a too high pressure, loss of resolution, or drifting baselines.
Liquid chromatography (LC) instruments are multicomponent systems comprising of at least one pump, an injector (automated or manual), one or more separation columns, and one or more detection system. To obtain reliable and accurate results, all components within such a system are required to work properly (1).
Scientists who work with gel permeation chromatography/size-exclusion chromatography (GPC/SEC) have to deal with (nasty) solvents. Very often mobile phase additives or modifiers, such as salts, are required to suppress undesired interactions or sample aggregation (2). In addition, sample preparation for macromolecular samples can be very demanding. Dissolution may take a long time and insoluble parts (for example, microgels) or contaminants can be present (3).
The most common problems that occur with GPC/SEC systems are therefore pressure increase, loss of column resolution, and drifting baselines, specifically when using refractive index (RI) detection.
If a problem occurs an efficient strategy can help to reduce the instrument downtime. This requires scientists to be familiar with their setup. Knowing a few important parameters can help to identify the root cause of a problem.
Pressure Issues
An (isocratic) pump is used to pump the LC mobile phase through the autosampler, the GPC/SEC columns, and the detectors. The inner diameter (i.d.) of the tubing used to connect the components and also within the components needs to be adapted to the system requirements. Narrow bore (0.17 mm [i.d.] and less) are typical for semi-micro and analytical setups to avoid band broadening. High viscous solvents or preparative setups sometimes require tubing with a larger inner diameter (0.25 mm or 0.5 mm).
Columns and tubing both generate pressure. This pressure value mainly depends on the viscosity of the mobile phase, the flow rate set at the pump, the number and type of columns, and the inner diameter and length of all tubing (in and outside of detectors). Each setup has its unique pressure value that should vary only slightly over time. A pressure change can be an indicator of a problem.
It is therefore recommended to monitor the pressure during analysis. In addition users should know the typical pressure value for their setup, applying their conditions (solvent, flow rate, temperature) with and without columns installed.
When installing new columns (4), a user should first document the pressure value for the pump, autosampler, and tubing to the precolumn. For this, set the desired flow rate at the pump, collect the waste at the tubing end, and write down the system pressure. Then install the precolumn according to the user documentation, set again the desired flow rate, and write down the value for the system with the precolumn. Install then the (first) analytical column and write down the pressure value; continue with this until all columns are in place. If the column manufacturer provides a pressure value on the column certificates this can be compared with your own values keeping in mind that different flow rates, different solvents, and different temperatures (as they influence the solvent viscosity) will generate different pressures. So deviations of these values are to be expected.
Table 1 shows an example of a well-documented setup.
As a too high pressure can damage the column packing and thus destroy the column entirely, it is good practice to set an upper pressure limit for the setup. If the limit is exceeded, this setting will cause a pump stop. Typically, the normal total pressure plus 20–30 bar is used as an upper limit.
Table 1 will now help to find the root cause in case of a pressure increase. Open the tubing at the entry port of the precolumn and check if the system pressure is too high. If this is the case, the pump, the autosampler, or the tubing is causing the problem. If this is not the case, most probably the columns are responsible.
Please note that the detector and tubing placed after the column may also cause the pressure increase. This could be double-checked by re-connecting the columns and by opening the connection at the exit of the last column. If the pressure reflects the value for the last analytical column installed, the detectors or the tubing after the columns is causing the issue.
After identifying the block of components that is causing the problem (pump/autosampler, columns, or, less common, detectors), each component in this block needs to be checked separately. For this remove piece by piece, starting from the end. Just loosen each subsequent connection while the flow rate is set as usual and check if an unusual high pressure drop occurs. It is good practice to replace any filters while the instrument is down.
In the case of a blocked tubing or needle, replace this part and immediately throw the blocked one away. If the precolumn is the root cause of the problem, it has done its job and should be replaced. In the case of an analytical column, applying a cleaning procedure or a replacement of the column frits can be an option. For this please refer to the column user documentation. If a detector is the cause of the problem, refer to the manual to see if and how you can clean the cell.
Column Performance
The columns in the setup are required to separate the molecules by size. A properly working GPC/SEC column has a high resolution power and generates narrow, symmetric peaks for monodisperse samples. If the resolution decreases, each of the columns in a set, even the precolumn, can be the single source of this behaviour. So in case of distorted chromatograms (broad peaks, double peaks, peaks with tailing or fronting) there is a realistic chance that only one of the columns in a set is malfunctioning.
Good measures to describe the column performance are the plate count, the asymmetry, and the specific resolution (5). These parameters should be determined for the complete column set immediately after installation. National and international standards provide acceptance limits for columns, often specifically for the mobile phase used. It is good practice to write down the parameters after installation and to compare these values with the data given on the column certificate. As the plate count depends on various parameters it is individual for each setup. If available, document the values of each column installed.
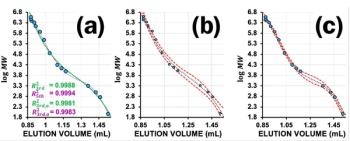
The plate count test should be repeated regularly, but at the very least when a problem is suspected. If the column set does not pass the acceptance limits any more, or if the deviations to previous measurements are too high, each column needs to be tested individually. Figure 1 shows an example where the asymmetry of a column set is out of spec as a result of peak fronting. The next step is to repeat the same test for each of the three columns individually to verify if only one column needs to be replaced or if the complete set is damaged. After identifying the faulty column it is good practice to review the samples previously analyzed to verify if one of them is causing the issue.
Please note that the behaviour shown in the example can sometimes be attributed to a wrong tubing connection. Each time new columns are installed (especially when the supplier has changed) the fittings and ferrules should be replaced to ensure low dead-volume connections with the matching stop depth.
Detector Performance
The detector is used to detect if sample fractions elute from the column. If pure effluent is passing the detector cell a baseline is obtained. The quality of detector signals is generally described by reviewing baseline drift and wander and the signal-to-noise ratio (S/N). National and international standards provide acceptance limits for drift and S/N. The influence of these values on GPC/SEC results has been investigated intensively (6).
To identify if a problem is related to chromatographic issues or detection issues it is best to measure uncritical samples. Plate count test substances can be used to determine the parameters for concentration detectors, such as RI, ultraviolet/diode array detection (UV/DAD), or evaporative light scattering detection (ELSD). If S/N, drift, and wander for this injection is documented after system installation troubleshooting will be easier.
Figure 1 also shows the results for drift, wander, and for S/N determined using the injection of the plate count test substance for a refractive index detector. All requirements by ISO13885 are met. In case of out-of-spec results, a baseline drift can often be assigned to temperature fluctuations. Here the conditions in the laboratory need to be reviewed (influence of draught of air conditioning, column compartment). A low S/N for concentration detectors is often an indicator of a dirty flow cell. Refer to the user documentation for cleaning procedures.
Summary
- Knowing the pressure of the system with and without the separation columns installed helps to quickly identify if the columns or the instrument is responsible for a pressure increase.
- Single column testing helps to identify a blocked (too high pressure) or malfunctioning column (low plate count, asymmetry, resolution).
- The sample used for plate count determination can also be used to verify detector performance (drift, S/N).
References
- D. Held, The Column11(18), 8–10 (2015).
- D. Held, The Column9(6), 9–12 (2013).
- G. Reinhold, The Column7(15), 13–17 (2011).
- D. Held, The Column10(2), 9–11 (2014).
- F. Gores and D. Held, The Column10(14), 7–10 (2014).
- P. Kilz and D. Held, in Quantification in LC and GC - A Practical Guide to Good Chromatographic Data, S. Kromidas and H.-J. Kuss, Eds. (Wiley-VCH, Weinheim, Germany, 2008).
Daniela Held studied polymer chemistry in Mainz, Germany, and works in the PSS software and instrument department. She is also responsible for education and customer training.
Articles in this issue
over 7 years ago
Vol 14 No 12 The Column December 2018 North American PDFover 7 years ago
Vol 14 No 12 The Column December 2018 Europe and Asia PDFover 7 years ago
Instrumental Innovations 2018over 7 years ago
Nanomechanical Resonators Expand the Reach of MSover 7 years ago
Crawford Scientific Acquires Anatune Ltdover 7 years ago
Investigating Gaul Head Embalming Using GC–MSover 7 years ago
Peak Packaging On Pointover 7 years ago
Talking About Your Generationover 7 years ago
GC×GC–MS for Forensic AnalysisAdvertisement
Related Content
Advertisement


Advertisement
Advertisement
Trending on LCGC International
1
Sample Preparation Strategies for PFAS Analysis
2
AI/ML in Practice: Machine-learning Prediction of Chromatographic Retention Times for Small Molecules in Pharmaceutical Applications
3
HTC-19 Insights: Practical Considerations for Using Pyr-GC×GC to Study Fluoropolymer Degradation
4
HTC-19 Insights. The Benefits of Multidimensional Pyrolysis Gas Chromatography To Investigate Fluoropolymer Degradation
5