Validation of HPLC-DAD Based Stability Indicating Assay Method for Ornidazole in Periodontal Polymeric Hydrogel: Robustness Study using Quality by Design (QbD) Approach
In the present study, a gradient reversed-phase high-performance liquid chromatography (RP-HPLC) method has been designed and validated to quantify ornidazole (OZ) in the marketed formulation (oral gel) with the application of QbD. The proposed HPLC method utilizes an RP C18 column (4.6 x 250 mm, 5 µm). The mobile phase contained HPLC grade Solvent A (water) and Solvent B (acetonitrile) and ran at a flow rate of 1 mL/min in a gradient mode. The linearity was plotted in an OZ range of 1–12 µg/mL and the correlation coefficient was found to be 0.9998. The limit of quantification, as well as the limit of detection, has been recorded as 0.70 µg/mL and 0.23 µg/mL. Inter- and intra-day precision (RSD) percentages were reported respectively within a range of 0.262–0.589 and 0.179–0.879. At 80, 100, and 120 percent different OZ levels, the average accuracy was 99.55, 99.58, and 99.92, respectively. The result of the study indicates that the OZ gel estimate HPLC method has good sensitivity, reproducibility, accuracy, and precision. This method may be used for the estimation of OZ in a gel formulation in quality control laboratories.
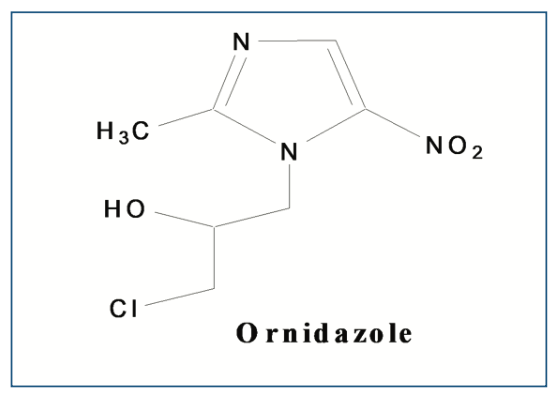
Ornidazole (OZ) is a 5-nitroimidazole derivative and is used as an antimicrobial drug. OZ is used to treat stomach, urinary tract, intestine, and genital infections because of anaerobic and protozoa bacteria (1,2). Ornidazole is also widely used to treat periodontitis (3–5). Nitro gr. (OZ) interacts with microbial DNA and inhibits nucleic acid synthesis (2). The microorganisms adhere to the tooth’s surfaces and affect the supporting tissues of the teeth (3–5). Thereby, treatment of periodontitis mainly focuses on the use of antimicrobials and the reduction of bacterial growth. The molecular formula of OZ is C7H10ClN3O3 (MW is 219.62 g/mol), and its molecular structure is depicted in Figure 1. It is a crystalline white to pale yellow powder. The OZ melting point is 88–91 °C and very slightly soluble in ether, practically insoluble in water, and freely soluble in methanol (6).


FIGURE 1: Structural formula of OZ.
Forced degradation studies are a scientific necessity and also a regulatory requirement in various countries during the drug development process. Here, OZ was exposed to various stress study conditions according to ICH guidelines and USP for determining the inherent stability of the drug (7,8). The reverse-phase high performance liquid chromatography (HPLC) technique for checking its suitability has been designed and verified during stress studies to generate degradation products and process-related impurities of OZ.
Many techniques for estimating OZ are described in the literature, such as high-performance thin layer chromatography (HPTLC) (9), ultraviolet (UV) and HPLC (10), isocratic HPLC (11–24), gradient HPLC (25–27), ultrafast LC (UFLC) (28), and bioanalytical (29) methods. In the present study, a reversed-phase liquid chromatography (RPLC or RP-HPLC) technique has been designed and proven to quantify Ornidazole in the marketed formulation (oral gel). This is the first time report that an HPLC technique has been utilized to estimate Ornidazole in the formulation of oral gel, as per ICH Q2 guidelines with the application of quality by design (QbD).
A systematic approach was applied under QbD (30) like design space to optimize critical quality attributes and critical method attributes. A QbD concept is important to make a visual “design space” in which the method is robust. The design space is the multidimensional combination where interaction of input variables is established to give assurance of quality (31–34).
Experimental
Chemicals and Reagents
OZ (percentage purity 99.8% w/w) was purchased from a supplier (Yarrow Chem, Mumbai). Methanol was purchased by Merck Life Science Pvt. Ltd., Mumbai (Batch no. SI5SF65571). HPLC water (Batch no. 220517) and acetonitrile (Batch no. 260617) was purchased by CDH, New Delhi. A gel of OZ was purchased from the market name Ornigreat Gel 10 gm (Mankind Pharma Ltd).
Instrument
HPLC
The Agilent Technologies 1260 Infinity II HPLC system (Agilent Technologies) with quaternary pump (G7111A 1260 Quat Pump VL) coupled with photodiode array detector (PDAG7115A) has been employed in the analysis. Data processing was performed on the software package (Agilent OpenLAB version A.02.02). Different analytical columns were used, like Agilent Eclipse plus C18 (Lot No. B16178) and Shiseido Capcell Pak C18MG-II S-5 (Lot No. BSII33) dimension (4.6 × 150 mm with size particle of 5 μm). The column oven (G7116A 1260MCT) and Rheodyne manual injector (G1328C 1260 Man. Inj.) with a 20 μL loop were used in the HPLC system.
LC–MS/MS
Liquid chromatography was achieved with a Shimadzu scientific instrument (UPLC, LC-30AD, Shimadzu Corporation) with a column, ACE C18 (100 mm x 4.6 mm i.d., 5 µm particle size) maintained at 35 °C, using solvent A, comprising water (90%) and solvent B acetonitrile (10%) with 0.1% v/v formic acid in gradient mode. The flow rate was set at 0.45 mL/min. The total analysis time was 5.50 min. The ionization and detection were carried out on a triple quadrupole mass spectrometer, Shimadzu LCMS-8050 (Shimadzu Corporation), equipped with electrospray ionization operated in positive polarity using multiple reaction monitoring (MRM).
Chromatographic Conditions
The chromatographic separation has been done on Agilent Technologies’ 1260 Infinity II Quaternary HPLC system using an Agilent Eclipse Plus C18 column (4.6 mm × 250 mm, 5 μm), and the temperature was maintained at 27 °C in a thermostat. To develop a linear, precise, sensitive, and suitable HPLC method for the estimation of OZ in gel concentration form many chromatographic conditions were applied. In the isocratic mode, peak shape was not symmetrical and theoretical plates were very low. Finally, mobile phase composition in gradient mode with water (solvent A) as well as acetonitrile (solvent B) in different ratios as per the time program was applied. A flow rate of 1 mL/min was adjusted. The mobile phase has been measured at 0.0 min–10% B, 10 min–90% B, and at 20 min–10% B, and reserved up to 5 min for column equilibrium. The column elution was monitored at 319 nm in wavelength variable detector (PDA). A PTFE pore-size filter 0.22 μm (Millipore, USA) was employed for filtration and sonic the mobile phase before use. The temperature of the column has been kept at 27 °C.
Standard Solution
To create the standard solution, 10 mg of OZ standard was weighed accurately. The weighed quantity of OZ standard was transferred to a clean 10 mL volumetric flask to dissolve the drug in HPLC-grade methanol. The solution was diluted to get a 1 mg/mL concentration. Using a micropipette, the solution was diluted to get a standard 5 μg/mL solution concentration.
Assay of the Marketed Product (Ornigreat Gel 1% w/w)
A portion of the gel (10 mg equivalent to OZ) was properly weighed and further transferred to a flask; the drug was extracted with methanol, then sonication was done for 10 min. The extract was filtered through a membrane filter (0.22 μm) and the filtrate was put into a beaker of 100 mL further volume was added up to the level. The methanolic extract of the dosage form was diluted to get final concentrations (5 µg/mL) and then treated as described previously. The recovery of OZ in dosage form was calculated from the corresponding calibration graph.
Stability-Indicating Study (35)
Forced degradation studies under different conditions were carried out on OZ gel according to the following conditions:
OZ gel equivalent to 10 mg of the drug was weighed properly and then put into a volumetric flask of 100 mL. Further OZ gel was exposed to two different strengths of HCl (0.1 N and 1.0 N), kept aside for 12 h in dark at room temperature, then neutralized with NaOH, which had the same normality as HCl. A pH meter is used before analysis to verify that pH has 7.0 as a value. The same concentration of the drug in the gel was exposed to 1 N HCl and heated at 70 °C for 6 h. The stress study in alkaline conditions was also performed using different strengths of NaOH solutions (0.1 N and 0.5 N) for 6 h in dark at room temperature then neutralized which had the same normality as HCl, and a pH meter is used before analysis to verify that pH has 7.0 as a value. The oxidative degradation studies were performed using hydrogen peroxide (3% v/v) to expose the OZ gel (equivalent to 10 mg of OZ) further. The strength of H2O2 was increased up to 30% v/v to the same strength of the OZ gel at room temperature for 8 h in dark. To end the reaction, the distilled water of 5 mL was mixed in. 20 μL of the degraded solutions were injected in triplicates, and the chromatograms were performed under chromatographical conditions, as stated.
OZ gel (equivalent to 1 mg/mL) was treated for thermal degradation at 60 ºC for 48 h. Photolytic degradation was also performed to expose the OZ gel to white fluorescent light (1.2 million lux) near UV fluorescent light (200 w/m2) for 10 days. After the withdrawal of each sample from the different studies, they were subjected to a filter through a syringe filter (0.22 μm) and diluted to HPLC grade methanol to achieve a 5 μg/mL concentration of the drug.
Validation Method
The HPLC method was validated for the estimation of OZ as per ICH Q2 guidelines (ICH Q2, 2005).
Specificity and Selectivity
The specificity was defined by the ICH Q2 guideline as a knack to identify the analyte in the presence of their impurities. For selectivity and specificity of the method, the standard solution and sample solutions were examined to verify the interference and separate degrading impurities in the OZ peak region.
Linearity
The standard OZ solution at diverse levels (1–12 μg/mL) was determined by injecting solutions in triplicate. Peak area versus respective concentrations, a graph was plotted, and the equation and correlation coefficient were obtained using linear regression analysis.
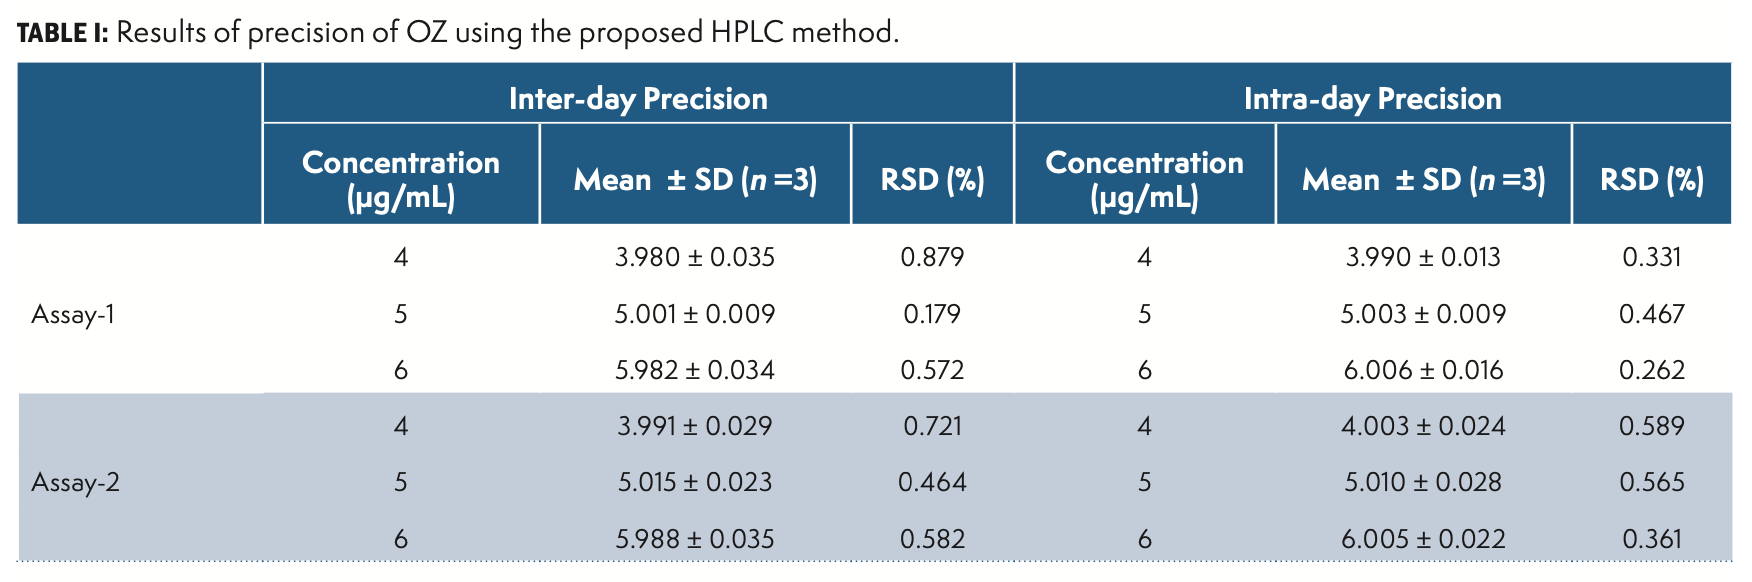
Precision
A concentration (5 μg/mL) of the standard solution was injected in six replicates for determining system and method precision. The OZ was prepared in three different levels (80, 100, and 120%) in triplicate, and OZ solutions were estimated within a day and three days later to get the inter-day and intra-day precision data.
Accuracy as Recovery
As per the guidelines ICH (8) and USP (7), accuracy was determined by the addition of pre-analyzed samples of OZ with a standard drug at diverse concentrations (80, 100, and 120%), and these solutions were made in triplicate further samples were suitably diluted and analyzed.
LOD (Limit of Detection) and LOQ (Limit of Quantification)
According to ICH guidelines, the following equations: LOQ = 10σ/S; LOD = 3.3σ/S were used to calculate LOD and LOQ for a developed method of OZ where the standard deviation is denoted by σ as well as calibration curve slope by S. The LOQ was analyzed at lower concentration of OZ with precision and accuracy.
Stability in Analytical Solution
In two different conditions, the stability studies of standard and sample solutions were investigated at 4 h of time intervals till 48 h. The standard and sample solutions of OZ were kept without light protection at room temperature and refrigerator (2–8 °C). The OZ concentration was determined in standard and sample solutions and % RSD was calculated.
Robustness
The organic content of the mobile phase was changed by ±2% v/v. Some are deliberated changes in the method were applied and discussed below. A QbD approach was applied for optimizing chromatographic conditions. For the DoE studies, four variables were selected:
1) Organic % in mobile phase (88–92);
2) Flow rate (0.9–1.1 mL/min);
3) Wavelength (317–321 nm);
4) Column temperature: 25–29 °C
and four responses were observed:
1. Tailing asymmetry;
2. RT;
3. Peak area; and
4. Theoretical plate.
Results
Chromatographic Conditions
The mobile phase was selected water (Solvent A): acetonitrile (Solvent B) ratio 90:10 in gradient mode with a 1 mL/min flow rate. At 0–9 min, the percentage of Solvent B was set to 10% by volume and at 10–19 min it increased to 90% by volume, thereafter, reserved for the initial condition up to 25 min. The retention time for OZ was 10.29 min and a run time of a total of around 25 min.
Stressed Studies
In acidic conditions (0.5 N HCl), the sample was withdrawn after 1 h and analyzed. The sample was not degraded and no impurities were observed in the chromatogram. But in the case of 1 N HCl after 4 h, there were two new peaks (Figure 2a) observed at retention time at 10.97 min and 11.13 min, with RRT 1.07 and 1.10, respectively.

 Chromatogram of OZ after degradation by HCl, and (b) OZ after degradation by NaOH, and (c) OZ after degradation by H2O2.")
FIGURE 2: (a) Chromatogram of OZ after degradation by HCl, and (b) OZ after degradation by NaOH, and (c) OZ after degradation by H2O2.
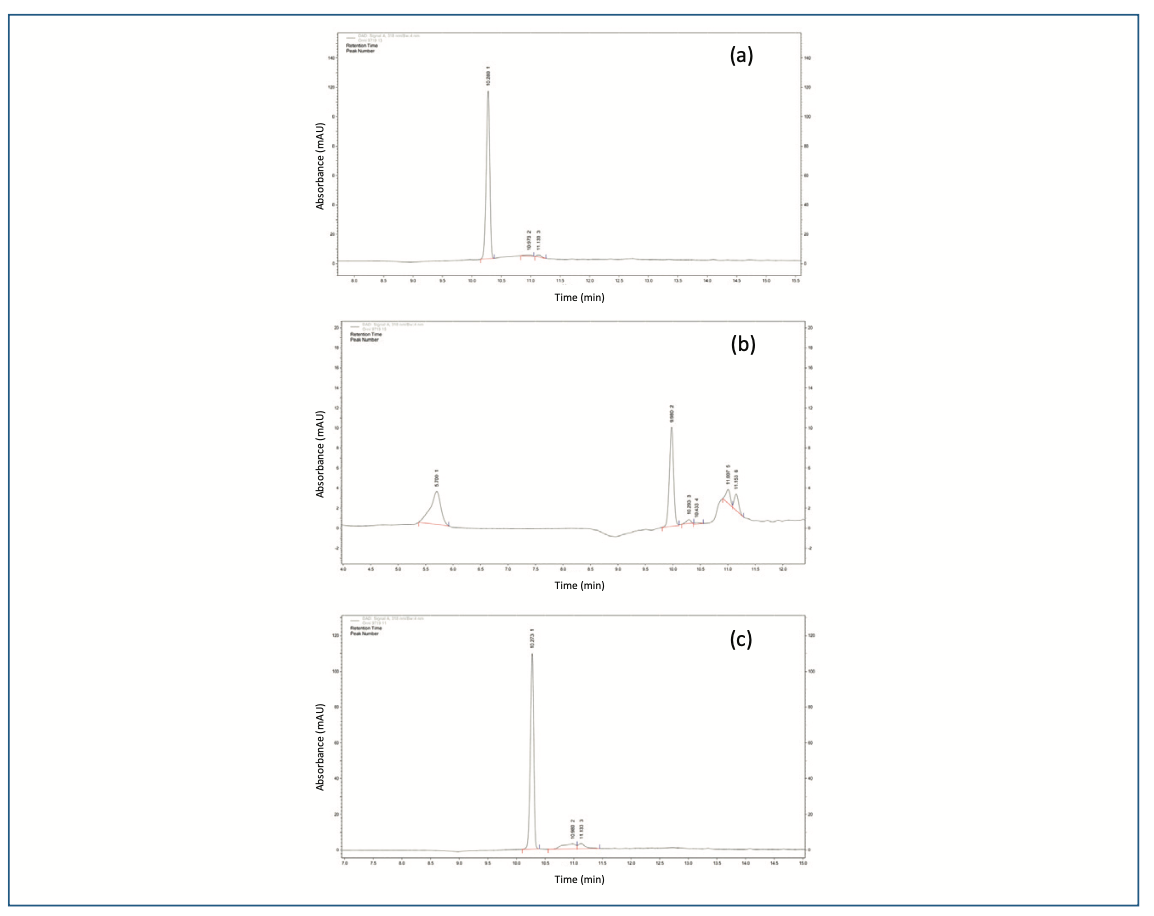
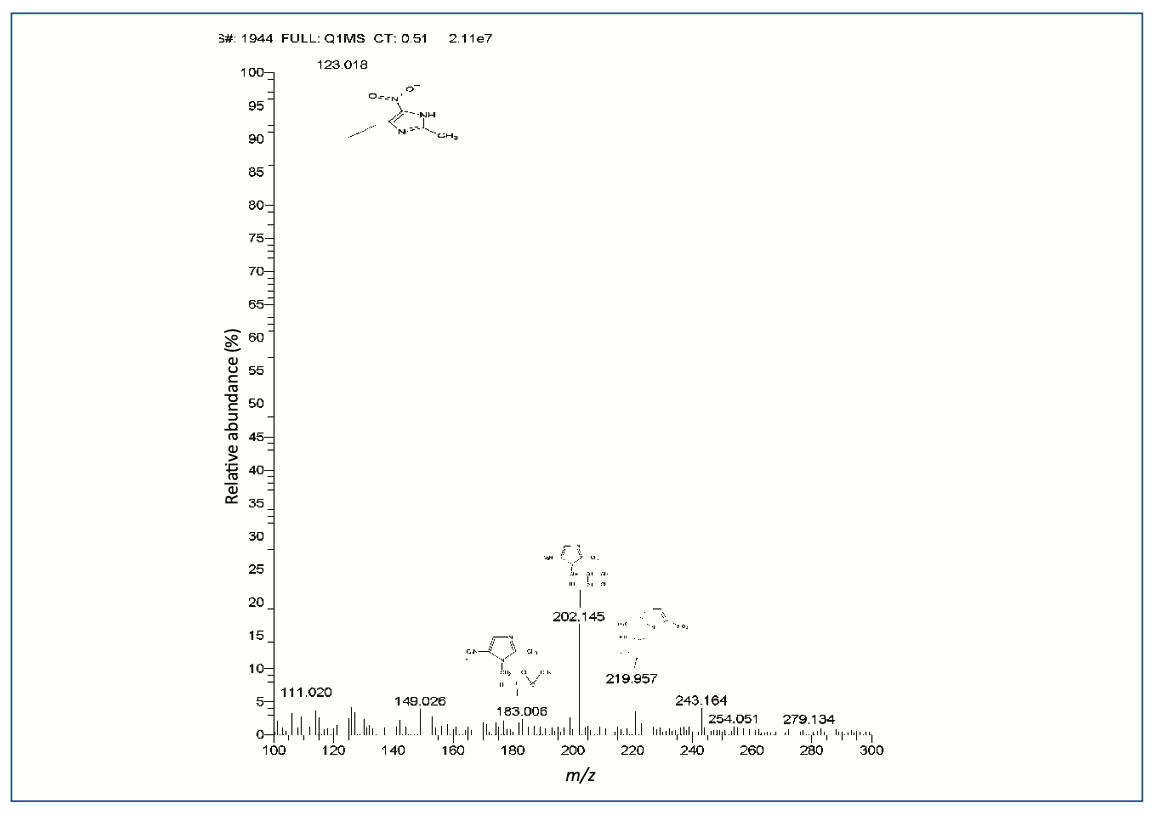
The alkaline condition (0.5 N NaOH) of the drug was initially degraded within 15 min along with two peaks (IV-1.07 and V-1.08) were observed. Then, further drug completed degraded with three new peaks (RRT I-0.55, II-0.97 and III-1.01). The peak purity of all PDA samples showed that the primary peak of ornidazole was not co-eluting peaks (Figure 2b), and thus, the stability-indicating nature of the technique was established, (which is obtained in acidic conditions) and a new highest peak was observed at 9.98 min as a major degraded product. In 1 N NaOH, the peaks were observed to be the same, but the drug was completely degraded. The further depredated sample was analyzed by LC–MS/MS. Many degradation products were found in mass spectra (Figure 3). The m/z values of major degradants are 123.018, 183.006, and 202.145, the last two were reported (Bakshi et al., 2001) as epoxide and diol forms of OZ. In the chromatogram (Figure 2b), these two degradants were observed at RT 5.70 and 9.98 min. The base peak was observed at m/z value 123.018 in the MS spectra after cleavage of the side chain in OZ.


FIGURE 3: MS spectra of the degraded sample of OZ.
In oxidative conditions (1% H2O2), the drug was degraded in a very low amount during 6h. Further, the drug was determined in 10% H2O2 in the same time there was drug degraded up to 20.4% w/w along with two peaks observed (RRT 1.07 and 1.08) in the chromatogram (Figure 2c).
The photolytic degradation of the drug was found after 2 d at about 6% w/w. After 5 d, samples were analyzed, and the drug was found to be 95% w/w. Further, the sample was analyzed for 10 days. Then, the drug remained at almost 93.1% w/w, and no other peak of degradation products (except OZ) was observed.
After thermal degradation, the drug was found at 24 h about 91.6% w/w. After 48 h, samples were analyzed again, and the drug was found to be 88.5% w/w with a single peak of OZ at 10.29 min.
Selectivity and Specificity
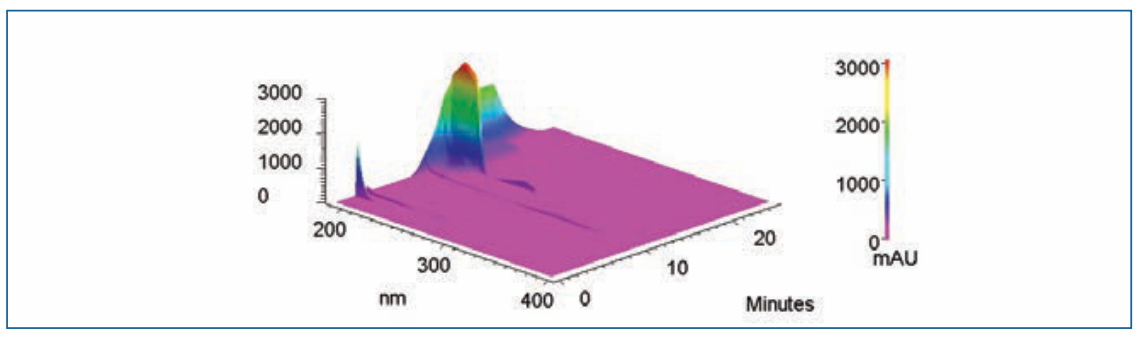
A blank (solvent), OZ standard and its formulations (gel), chromatograms showed a single peak at a retention time of 10.29 min, which revealed that in the OZ peak region, no other peak was seen. The peak was discovered in OZ gel to be pure and can be identified unequivocally as shown in Figure 4 (3D view of OZ Peak; this and all subsequent figures are accessible through the QR code at the end of the article). The chromatogram depicts that the gradient method was highly specific for separating the drug from degradation impurities I, II, III, IV, and V with the RT of 5.70, 9.98, 10.43, 11.00, and 11.15 min in Figure 2b.


FIGURE 4: 3D view of OZ peak.
Linearity
Excellent linearity revealed a calibration curve range of 1–12 μg/mL and a correlation coefficient of 0.9998 with a linear regression line equation of y = 91349x – 24980 was identified.
Precision
Precision is the variance of findings in repeated analyses under similar experimental conditions of the homogenous sample. The technique has been verified by performing method, system, inter-day, as well as intraday precision. The findings of method and system precision were respectively 0.478 and 0.325 percent RSD. The results are given in Table I.


Accuracy as Recovery
The recovery data showed that at three levels <2% was (RSD percent). The average method accuracy at 3 distinct ranges of 80, 100, and 120 percent was 99.55, 99.58 and 99.92. The values of accuracy were found within a range.
LOQ and LOD
The S/N ratio (signal-to-noise) of LOD and LOQ was determined to be 0.23 μg/mL and 0.7 μg/mL with high precision as well as accuracy. The relative standard deviation in percent was less than 2%.
Stability in Analytical Solution
The result of the room temperature stability of standard OZ and sample solutions was constant. The cumulative percentage RSD of 0.46 was 0.89 at refrigeration condition (2–8 ºC). Both solutions of OZ were stable up to 48 h at 25 ºC.
Robustness
The robustness was established by deliberate diverse chromatographic conditions by changing the column temperature, flow rate, detection wavelength, column make, and composition of organic solvent within given ranges from actual chromatographic settings.
DoE Evaluation and Design Space
Factorial DoE has been performed with study type 2 levels, level 2 factorial, and four factorial equations mode.
The equations are given below:
Tailing Asymmetry: -1.15A – 0.51B – 0.40C + 0.86D + 0.5 AB + 0.45AC – 0.85AD
Retention Time: -0.125A + 0.43B – 0.84C – 0.84C – 0.32D – 0.475AB + 0.725AC + 0.325AD
Peak Area: 2131A – 676.17B + 2602.12AC – 4059.9D + 1178AB – 2218.5AC + 3883AD
Theoretical Plate: 1852.13A – 1849.41B + 823.59C + 693.18 + 1973.87AB – 1076.13AC – 822.42AD
Where: A: Flow rate (mL/min); B: Column Temperature (°C); C: Percentage of Organic solvent (%); D: Wavelength (nm)
The factorial DoE results are summarized in Table II and QbD plots were applied for evaluation. Figure 5 illustrate the DoE contour plots.

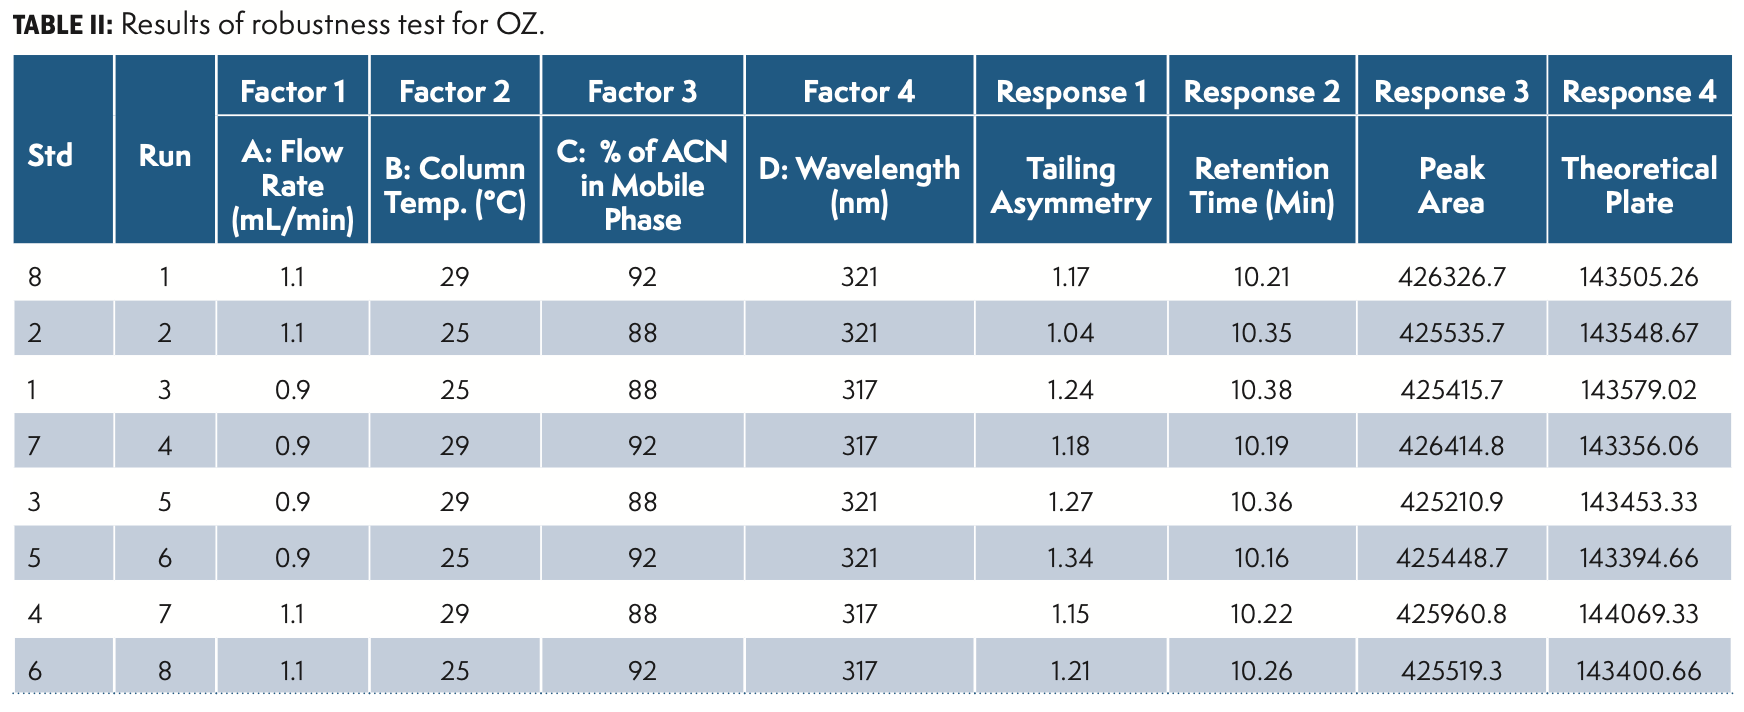


FIGURE 5: DoE contour overlay plots.
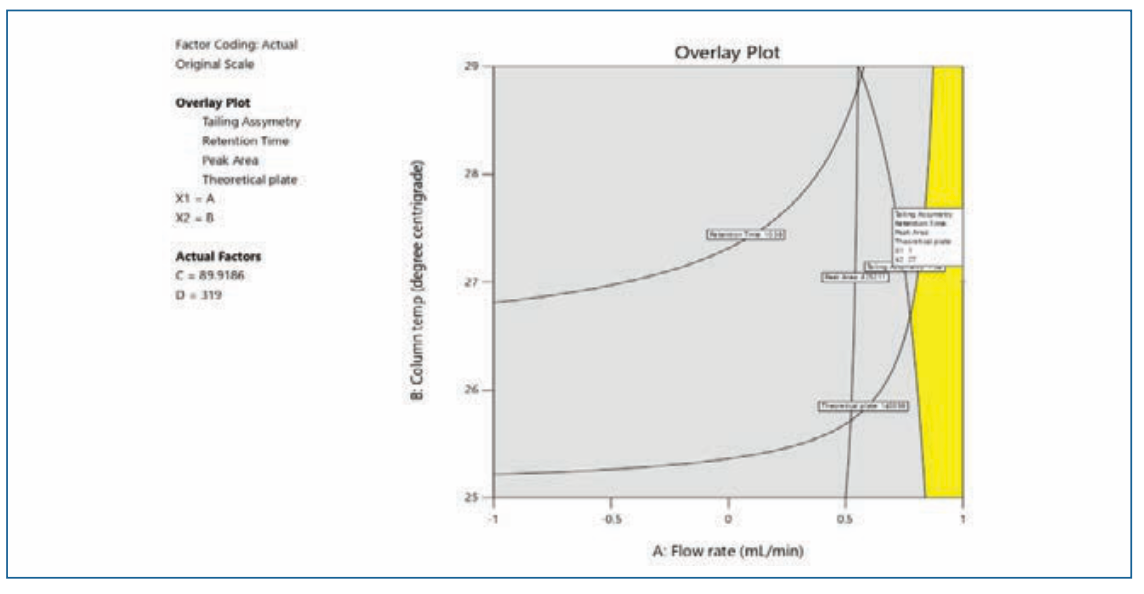
In the design space based on the DoE set of experiments, the water (88–90%) in solvent A facilitated the separation of peaks. A column temperature of 25–27 °C is suggested for the separation of peaks. Considering the peak shape of all of the impurities and OZ, a flow rate of 0.9–1.0 mL/min and a column temperature of 27 °C were selected and have a positive impact on theoretical plates. The flow rate and mobile phase ratio Solvent A 90% and Solvent B 10% had resistance to change in peak area as well as the symmetry of the peaks. The design space results were uploaded in design expert software and the plot was drawn and depicted in Figure 5.
Discussion
The researchers (36) found that the drug remained unstable in every situation like acidic conditions, alkaline media, acidic medium, as well as oxidative stress in presence of light. OZ (I) decomposes to an epoxide (II) and is transformed into diols in alkaline conditions (III). In the presence of a base, the intramolecular SN2 reaction causes ring closure. The mechanism of degradation of OZ depicts in Figure 6.


FIGURE 6: Mechanism of ornidazole degradation.

Conclusion
For the analysis of OZ in a gel formulation, a selective and gradient HPLC technique has been validated with the application of QbD. The chromatographic conditions were optimized with the application of QbD, and the method was developed to be reliable, rapid, and reproducible. The findings of peak purity revealed that the OZ peak is pure and that no peak merges during retention. Particularly, the findings showed that the technique used to estimate OZ in the gel dosage form. The suggested HPLC technique is very precise, sensitive, as well as reproducible. Finally, it could be used for the routine analysis of quality control laboratories.
Acknowledgments
Thanks to Veeda Clinical Research, Ahmedabad, India for providing the facility of LC–MS/MS.
Conflict of Interest
The authors have no conflict of interest.
References
(1) Rossignol, J. F.; Maisonneuve, H.; Cho, Y.W. Nitroimidazoles in the Treatment of Trichomoniasis, Giardiasis, and Amebiasis. Int. J. Clin. Pharmacol. Ther. Toxicol. 1984, 22 (2), 63–72.
(2) Thurston, S.; Hite, G. L.; Petry, A. N.; Ray, S. D. Antiprotozoal Drugs. Side Eff. Drugs Annu. 2015, 37, 321–327. DOI: 10.1016/bs.seda.2015.08.008
(3) Patil, V.; Mali, R.; Mali, A. Systemic anti-microbial agents used in periodontal therapy. J. Indian Soc. Periodontol. 2013,17 (2), 162. DOI: 10.4103/0972-124x.113063
(4) Ravishankar, P. L.; Kumar, Y. P.; Anila, E. N.; et al. Effect of local application of curcumin and ornidazole gel in chronic periodontitis patients. Int. J. Pharm. Investig.2017, 7 (4), 188. DOI: 10.4103/jphi.jphi_82_17
(5) Urmi, J. I.; Alam, M.; Pathan, M. S. Preparation and evaluation of ornidazole periodontal films. Bangladesh Pharm. J. 2016,19 (2), 133–146. DOI: 10.3329/bpj.v19i2.29271
(6) Singh, P.; Mittal, R.; Sharma, G. C.; et al. Ornidazole: Comprehensive Profile. Profiles Drug Subst. Excip. Relat. Methodol. 2003, 30, 123–184. DOI: 10.1016/s0099-5428(03)30007-3
(7) Brown, W.; Marques, M. R. 14 The United States Pharmacopeia/National Formulary. Generic Drug Product Development: Solid Oral Dosage Forms. 2013, 319–332. DOI: 10.1201/b15569-15
(8) Guideline, I. H. T. Validation of analytical procedures: text and methodology. Q2 (R1). 2005, 1 (20), 05.
(9) Puranik, M.; Bhawsar, D. V.; Rathi, P.; et al. Simultaneous Determination of ofloxacin and ornidazole in solid dosage form by RP-HPLC and HPTLC techniques. Indian J. Pharm. Sci. 2010, 72 (4), 513. DOI: 10.4103/0250-474x.73937
(10) Jain, S.K.; Singh, M.; Jain, R.; et al. Spectrophotometric & RP-HPLC Method Development and Validation for Simultaneous Estimation of Levofloxacin & Ornidazole. Int. J. Pharm. Sci. Res. 2014, 5 (8), 3370.
(11) Kabra, P.; Kimbahune, R. V.; Puranik, M. P. Simultaneous Estimation of Gatiloxacin, OrnidazolE and its Isomer by Reverse Phase High Performance Liquid Chromatography. Int. J. Chemtech. Res. 2010, 2 (2), 928–931.
(12) Ku, Y. R.; Tsai, M. J.; Wen, K. C. Determination of Aminitrozole, Metronidazole, Ornidazole and Tinidazole Adulterated in Traditional Chinese Medicine By High Performance Liquid Chromatography. J. Food Drug Anal. 1996, 4 (2), 7. DOI: 10.38212/2224-6614.2992
(13) Kumar, D. V.; Swetha, P.; Prasad, G. S.; et al. Assay Method Development and Validation For Simultaneous Quantitative Estimation of Diloxanide Furoate and Ornidazole in Tablets by RP-HPLC. Int. J. Pharm. Pharm. Sci. 2015, 7 (10), 357–362.
(14) Li, Q.; Zhao, Y.; Liang, Y. G. Determination of Ornidazole in Plasma by HPLC and Study on Its Pharmacokinetics. Chin. Pharm. J. 2003, 38 (9), 690–691.
(15) Muzib, Y. I.; Bhaskar, P.; Shyale, S. S. Development and Validation of a Reversed-Phase HPLC Method for the Analysis of Ornidazole in Pharmaceutical Dosage Forms. Asian J. Chem. 2003, 15 (2), 925–929.
(16) Nagavallai, D.; Sankar, A.S.; An, K.; et al. RP-HPLC Method for Simultaneous Estimation of Gatifloxacin and Ornidazole in Tablets. Indian J. Pharm. Sci. 2007, 69 (2), 333–335. DOI: 10.4103/0250-474x.33178
(17) Nagavalli, D.; Rajeevkumar, R.; Kumar, R.; et al. RP-HPLC Method Development and Validation for the Simultaneous Estimation of Levofloxacin hemihydrate and ornidazole in Tablets. Int. J. Pharmtech. Res. 2009, 1 (4), 1161–1163.
(18) Patel, S. A.; Prajapati, A. M.; Patel, P. U.; et al. Development and Validation of Column High-Performance Liquid Chromatographic and Derivative Spectrophotometric Methods for Determination of Levofloxacin and Ornidazole in Combined Dosage Forms. J. AOAC Int. 2008, 91 (4), 756–761. DOI: 10.1093/jaoac/91.4.756
(19) Paramane, S.; Kothapalli, L.; Thomas, A. Simultaneous RP-HPLC Estimation of Gatifloxacin and Ornidazole in Tablet Dosage Forms. Indian J. Pharm. Sci. 2007, 69 (4), 525. DOI: 10.4103/0250-474x.36938
(20) Rege, P. V.; Sathe, P. A. Simultaneous Quantification of Ofloxacin and Ornidazole in Combined Drug Formulation by a Simple Electro Analytical Technique. Int. J. Pharm. Sci. Res. 2011,2 (8), 2226–2231.
(21) Shekar, M.S.; Sagar, J.V.; Narsaiah, N.; et al. Validated HPLC Method For the Determination of Ornidazole in Human Serum and Urine. Indian J. Pharm. Sci. 2005, 67 (3), 302–306.
(22) Sreekanth, N.; Shivshanker, K.; Harikrishnan, N.; et al. Validated Simultaneous Estimation of Ornidazole and Cefixime by RP-HPLC in Pure and Pharmaceutical Dosage Form. Asian J. Chem. 2007, 19 (6), 4297–4302.
(23) Solomon, W. S.; Gowda, K. V.; Selvan, P. S.; et al. HPLC Method for Quantification of Ornidazole in Human Plasma. Asian J. Chem. 2008, 20 (6), 4361–4368.
(24) Veena, K.; Sireesha, D.; Rajini, T.; et al. Analytical Method Development and Validation for the Simultaneous Estimation of Cefixime Trihydrate and Ornidazole in Combined Dosage Form by RP-HPLC Method. Pharm. Res. 2015, 5 (10), 128–134.
(25) Bind, B.; Lokhande, R.; Munigela, N.; et al. RP-HPLC Method for the Simultaneous Determination of Metronidazole, Tinidazole, Ornidazole, Secnidazole and Ofloxacin in Bulk and Pharmaceutical Dosage Form. Int. J. Pharm. Sci. Rev. Res. 2015, 34 (2), 61–67.
(26) Dewani, A. P.; Bakal, R. L.; Kokate, P. G.; et al. Development of a Single Ion Pair HPLC Method for Analysis of Terbinafine, Ofloxacin, Ornidazole, Clobetasol, and Two Preservatives in a Cream Formulation: Application to In Vitro Drug Release in Topical Simulated Media-Phosphate Buffer Through Rat Skin. J. AOAC Int. 2015, 98 (4), 913–920. DOI: 10.5740/jaoacint.14-189
(27) Palacharla, S. K.; Mohan, G. K. Stability Indicating HPLC Method for the Quantification of Cefixime, Ornidazole and Moxifloxacin in Solid Dosage Forms. Rasayan J. Chem. 2018, 11 (4), 1696–1714. https://doi.org/10.31788/rjc.2018.1144093
(28) Shivabasappa, P. M.; Diksha, H.; Chouhan, M. K.; et al. Method Development and Validation of Ciprofloxacin HCl and Ornidazole by UFLC in Combined Dosage Form. Indian J. Pharm. Educ. Res. 2019, 53 (3), S373-S379. DOI: 10.5530/ijper.53.3s.108
(29) Wang, Y.; Zhang, P.; Jiang, N.; et al. Simultaneous Quantification of Metronidazole, Tinidazole, Ornidazole and Morinidazole in Human Saliva. J. Chromatogr. B Biomed. Appl. 2012, 899, 27–30. DOI: 10.1016/j.jchromb.2012.04.032
(30) International Conference on Harmonisation Expert Working Group. International Conference on Harmonisation of Technical Requirements for Registration of Pharmaceuticals for Human Use. ICH Harmonised Tripartite Guideline. Guideline for Good Clinical Practice. 1997, CFR & ICH Guidelines, Q8 (R2).
(31) Monks, K. E.; Rieger, H-J.; Molnár, I. Expanding the Term “Design Space” in High Performance Liquid Chromatography (I). J. Pharm. Biomed. Anal. 2011, 56 (5), 874–879. DOI: 10.1016/j.jpba.2011.04.015
(32) Subramanian, V.B.; Katari, N.K.; Dongala, T.; et al. Stability‐indicating RP‐HPLC method development and validation for determination of nine impurities in apixaban tablet dosage forms. Robustness study by quality by design approach. Biomed. Chromatogr. 2020, 34 (1), e4719. https://doi.org/10.1002/bmc.4719
(33) Subramanian, V. B.; Katari, N. K.; Ponnam, V.; Konduru, N.; Dongala, T.; Marisetti, V. M.; Vyas, G. Stability‐Indicating Reversed‐Phase‐HPLC Method Development and Validation for Sacubitril/Valsartan Complex in the Presence of Impurities and Degradation Products: Robustness by Quality‐by‐Design Approach. Biomed. Chromatogr.2022, 36 (1), e5240. DOI: 10.1002/bmc.5240
(34) Gurumukhi, V. C.; Bari, S. B. Quantification and Validation of Stability-Indicating RP-HPLC Method for Efavirenz in Bulk and Tablet Dosage Form Using Quality by Design (QbD): A Shifting Paradigm. J. Chromatogr. Sci. 2022, 60 (2), 143–156. DOI: 10.1093/chromsci/bmab061
(35) Blessy, M. R.; Patel, R. D.; Prajapati, P. N.; et al. Development of Forced Degradation and Stability Indicating Studies of Drugs—A Review. J. Pharm. Anal. 2014, 4 (3), 159–165. DOI: 10.1016/j.jpha.2013.09.003
(36) Bakshi, M.; Singh, B.; Singh, A.; et al. The ICH Guidance in Practice: Stress Degradation Studies On Ornidazole and Development of a Validated Stability-Indicating Assay. J. Pharm. Biomed. Anal. 2001, 26 (5–6), 891–897. DOI: 10.1016/S0731-7085(01)00475-7
About the Authors
Gopal Prasad Agrawal is an Associate Professor at Institute of Pharmaceutical Research at GLA University, in Mathura, India. Direct correspondence to: gopalprasad.agrawal@gla.ac.in
Mohammed Ageeli Hakami is an Assistant Professor of Medical Molecular Genetics for the Department of Clinical Laboratory Sciences at the College of Applied Medical Sciences at Shaqra University, in Al-Quwayiyah, Saudi Arabia.
Farhan R. Khan is an Assistant Professor in the Department of Clinical Laboratory Sciences at the College of Applied Medical Sciences at Shaqra University, in Al-Quwayiyah, Saudi Arabia.
Prabhat Kumar Upadhyaya is a Professor at the Institute of Pharmaceutical Research at GLA University, in Mathura, Uttar Pradesh. India.
Anuj Garg is an Associate Professor at the Institute of Pharmaceutical Research at GLA University, in Mathura, Uttar Pradesh. India.
Meenakshi Bajpai is a Professor and Head of the Institute of Pharmaceutical Research at GLA University, in Mathura, Uttar Pradesh. India.