What Are Options to Improve My Separation? Part 4: Solutions to Consider for Improving Separation Speed
Many high performance liquid chromatography (HPLC) users are confronted with questions about how to improve upon the performance of an existing or recently developed method. These days, we have many technological options to consider, but how do we choose one (or a few) to try? The variables that are most important for improving the speed of a separation are the maximum pressure available to drive the separation, and column temperature. Understanding the relationship between these variables and analysis time, and their effects on other choices made during method development, is helpful for developing methods that are both effective and time-efficient.
In the April 2023 instalment of “LC Troubleshooting”, I kicked off a series of articles aimed at addressing the general question, “How do I improve my separation?” Given the diversity of analytical challenges that are addressed using high performance liquid chromatography (HPLC), there are several variants of the general question. In the first part of the series (1), I reviewed some basic and foundational concepts that are relevant to these discussions. In Parts 2 (2) and 3 (3), I discussed the ideas of sample complexity, the likelihood of fully resolving the components of relatively simple samples, and options for dealing with more complex samples. In this fourth part in the series, I address the issue of separation speed, and discuss aspects ranging from the kinetics of the separation itself to other nonchromatographic factors such as autosampler throughput. As with the other parts of this series, building up knowledge of how different factors affect separation speed from a theoretical point of view, as well as what changes are possible within practical constraints, is powerful when we are confronted with a separation that needs to be improved, or when an existing separation is not performing as expected.
How Fast is Fast Enough?
What constitutes a “fast” separation can be very different in the diverse application areas where LC is used. In some cases, we expect analysis times on the order of a few seconds, and in other cases, we tolerate analysis times on the order of a few hours. Usually, “faster” does not necessarily mean “better”, and very often we end up having to make a compromise between analysis speed and performance as measured by resolution and robustness, for example. Sometimes both speed and resolution are important, but speed is more important because we have hundreds or thousands of samples to analyze. In other cases, resolution is more important, but we would like to achieve a certain resolution as fast as possible—for example, in the quantitation of a low-concentration impurity that is closely related to a main product. Here, resolution is critically important, as if the resolution is insufficient or decreases over time, we lose the ability to quantify the impurity accurately. While it is flashy and attractive to think about pushing for faster separations, we need to be careful that we don’t sacrifice data quality in doing so.
Improving Speed by Adjusting the Dynamics of the Separation
The dynamics of analytical-scale chromatographic separations is arguably one of the most thoroughly studied areas of separation science. Indeed, one of the most well-known early texts n the field, authored by the late Cal Giddings, carries the title “Dynamics of Chromatography” (4). Although many of the fundamental principles governing the optimization of separations for speed were described in the 1960s and 1970s, the dynamics of separation has continued to be a popular area of study, motivated largely by the continuing evolution of the field, and involving developments including working with smaller particles, superficially porous particles, monolithic columns, and microfabricated columns (5,6).
From a distance, the number of variables impacting the speed and performance of a separation can seem overwhelming. For example, flow rate, van Deemter parameters, particle size, column dimensions, temperature, and mobile phase composition can all affect how long it takes to achieve a separation of a certain mixture of compounds with a desired target resolution. Readers interested in developing a thorough understanding of these details are referred to other publications of the shorter (7) or longer (8) variety. However, we can simplify the thought process quite a bit by following two ideas:
1) Stay focused on the major factors influencing speed. All the variables listed above affect speed, but some are much more influential than others. For this part of the discussion, we should focus on particle size, column length, operating pressure, and column temperature.
2) Assume that we are working at the Knox-Saleem Limit (KSL). At the KSL, the particle size, flow rate, and column length are all chosen such that the pressure drop across the column is exactly equal to a target pressure drop, and the flow rate is exactly that needed to work at the van Deemter optimum velocity.
Under these conditions, we have the following relatively simple relationships that are highly instructive for thinking about how to improve speed. First, equation 1 shows the relationship between analysis time, pressure drop across the column (P), and temperature (implicitly through its effect on the mobile phase viscosity (η) (7). The other parameters in this equation are nominally fixed in the case where we know what plate number (N) is needed to achieve a desired resolution: hmin is the minimum reduced plate height in the van Deemter curve relevant to the technology being used, and Φ and λ are constants related to the way fluid moves through the column.


We see here that the analysis time is inversely proportional to the first power of the pressure, and directly proportional to the first power of the viscosity. This means that, assuming everything else is held constant, if we increase the pressure by a factor of two (for example, from 400 to 800 bar), we can cut the analysis time in half. On the other hand, if we increase the column temperature such that the mobile phase viscosity decreases by a factor of two (as is the case with water in the mobile phase when the temperature is increased from 40 to 80 °C), this will also cut the analysis time in half.
That’s it. It’s beautifully simple. However, it is critical to emphasize again here that the preceding discussion assumes that we are working at the KSL. Readers interested in understanding the implications of this in more detail are referred to a recent series of “LC Troubleshooting” articles focused on this topic (9).
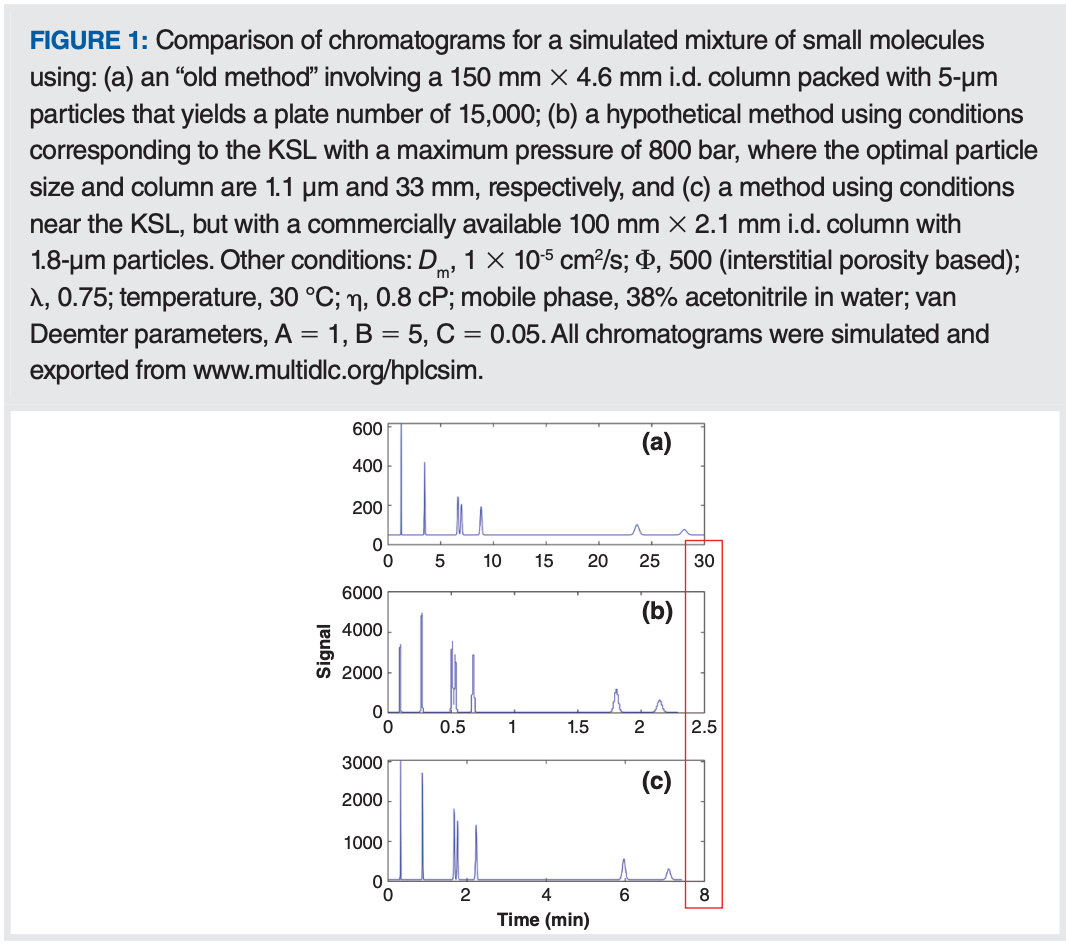
At this point, we can bring the discussion back to focus on how these ideas can be applied in a practical context. Thinking back to my recent experience visiting a local laboratory that eventually led to this series of articles, I find very often that people have existing methods that are nowhere near the KSL conditions mentioned above. This means that there are opportunities for improvement of analysis speed that are much greater than the factors of two or three that would be expected by moving to a newer pump that could provide two or three times more pressure than what was available with an older instrument. For example, a lot of older methods for reversed-phase separations of small molecules call for 150 mm × 4.6 mm internal diameter (i.d.) columns packed with 5-µm particles, operated around room temperature, with a flow rate of 1 mL/min. Under these conditions, the plate number is about 15,000, and the pressure drop across the column is about 60 bar, which is nowhere near the KSL considering that these methods are typically run on an instrument with a pressure limit of 400 bar. A representative chromatogram for a separation of small molecules under these conditions is shown in Figure 1(a), where we see that the last peak is eluted around 30 min. At this point, we can ask two questions:
- How much could the analysis time be improved if we moved to a pressure limit of 800 bar and worked at the KSL?
- How does the situation change if we consider practical constraints on particle size and column length?


At the KSL we have not only equation 1 to guide our thinking but also equations for the optimal particle (dp*) size and optimal column length (L*) that correspond to the KSL condition; these are shown in equations 2 and 3, where B and C are van Deemter parameters, tm is the column dead time, and Dm is the diffusion coefficient of an analyte in the mobile phase.


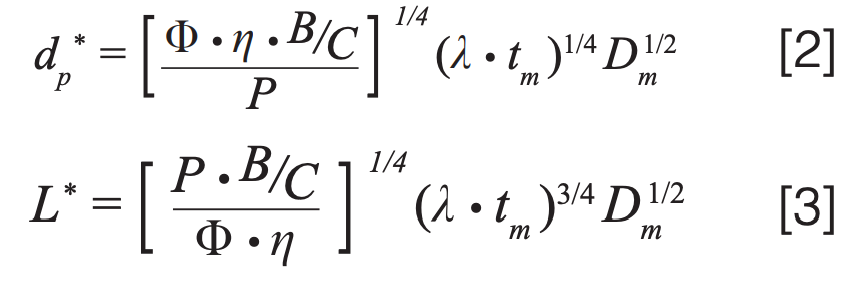
Once a target is set for the plate number (15,000 in this case) and the constants in equations 2 and 3 are known (see Figure 1 caption for details), then dp* and L* can be calculated easily. In this case, we find that they are 1.1 µm and 33 mm, respectively, and we would have to use a flow rate of 0.6 mL/min, with a 2.1 mm i.d. column to work at the KSL. If we could do this, we would get the separation shown in Figure 1(b), where we see that the analysis time has improved dramatically to just 2.5 min without sacrificing resolution (a factor of 12!). The problem is that there are no commercially available columns sold with 1.1 µm particles, so this improvement is completely theoretical.
At this point we move to the second question, where we recalculate the improvement in analysis time, but assume that we will use a column with a length and particle size that is commercially available. If we move to a 1.8-µm particle, then the shortest column that would give us at least 15,000 plates under these conditions would be 64 mm—also an unconventional length. The next best option would be a 100 mm × 2.1 mm i.d. column, which we could operate at 0.55 mL/min at our pressure limit of 800 bar. Such a column would yield the chromatogram shown in Figure 1(c), where we see that the analysis time is about 7.5 min—not fast as the separation at the true KPL, but still about fourfold faster than our old method with the 30 min analysis time.
Through this example, we see that the simple relationships in equations 1–3 can provide tremendous insight into the potential for gains in analysis time and the columns needed to provide these gains, but also that, in some cases, we aren’t able to realize the entire gain in practice because of the constraints of commercial column offerings.
Improving Speed by Adjusting Selectivity
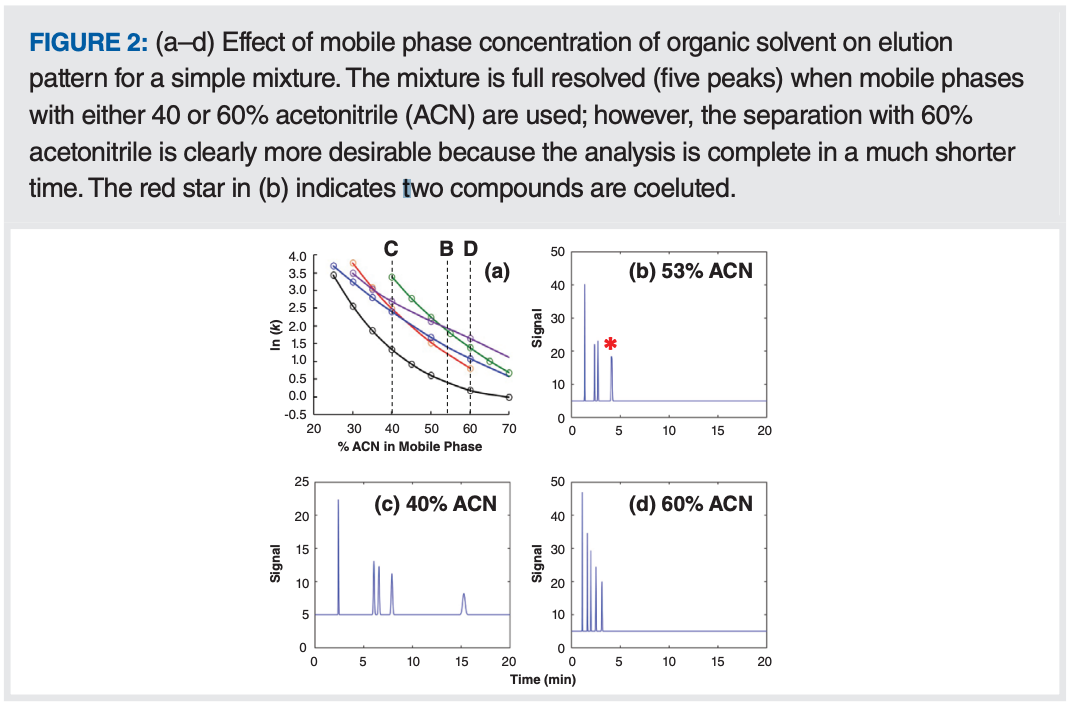
The preceding discussion was focused on kinetic factors that affect analysis time. These most certainly are very important, but we should not lose sight of the value of adjusting separation selectivity because this can be an incredibly powerful tool for improving analysis time, even after kinetic parameters have been optimized. A fuller discussion of this topic can be found in Part 2 of this “LC Troubleshooting” series (2). Please note Figure 2, where I have repeated figure 3 from that article, which emphasizes the point that, when developing separations for relatively simple mixtures, there often are multiple mobile phase compositions that will provide the selectivity needed to fully resolve the mixture, but with one requiring significantly less analysis time than the others.


When the Chromatography is Not the Slow Step
While the effects of chromatographic variables on separation speed discussed above are obviously important to any method optimization process, we should also not lose sight of the fact that other, nonchromatographic factors can strongly affect method throughput. Two examples are between-analysis data processing time, and the time associated with loading a sample into the injection apparatus prior to the actual introduction of the sample into the mobile phase stream (that is, the actual sample injection). In modern chromatography data systems, the time intensive steps associated with data processing (for example, peak integration and report generation) can be turned off entirely, deferred and completed at a later time, or completed using a computer different from the one used to acquire the data. In recent years, the recognition that manipulation of samples prior to injection into the mobile phase can be too time-consuming for some applications has motivated instrument manufacturers to improve the efficiency of this step using hardware- (for example, using multiple flow paths in parallel) or software-oriented (for example, enabling the start of the next analysis before the prior analysis is completed) solutions. A detailed discussion of these solutions is beyond the scope of this article, but at this point it is useful to be aware that a sampling handling cycle can be more than 30 s before the injection even occurs. If the actual chromatographic separation step is only 15 s in the case of a very fast method, for example, then it would be worthwhile to consider implementing a hardware- or software-oriented solution to decrease the time overhead associated with the sampling step so that it occupies much less than 50% of each analysis cycle.
Summary
Many HPLC users are confronted with questions about how to improve upon the performance of an existing method. In this instalment, I have discussed the factors that most strongly influence separation speed, including the pressure available to drive the separation, column temperature, particle size, and column length. Although the relationships between these factors and other chromatographic variables such as flow rate and column diameter can seem overwhelming, they can be reduced to relatively simple expressions that form the foundation of a way of thinking about how to improve separation speed. In addition to this theoretical guidance, it is also important to keep in mind that other nonchromatographic factors, such as the time needed for the instrument to handle a sample prior to injection, can contribute to the total analysis cycle time and limit throughput. In these situations, it is worthwhile to consider investing in software – or hardware-oriented solutions that decrease the sample handling time.
References
(1) Stoll, D. R. What Are My Options to Improve My Separation? Part 1: Foundational Concepts. LCGC Eur. 2023, 36 (4), 132–136. DOI: 10.56530/lcgc.na.ra9970y5
(2) Stoll, D. R. What Are Options to Improve My Separation? Part 2: Likelihood of Separation, Adjusting Selectivity for Simple Mixtures. LCGC Eur. 2023, 36 (5), 163–168. DOI: 10.56530/lcgc.na.qz2990k6
(3) Stoll, D. R. What Are Options to Improve My Separation? Part 3: Options to Consider to Improve Resolution of Complex Mixtures. LCGC Eur. 2023, 36 (6), 210–215. DOI: 10.56530/lcgc.na.kg5569c3
(4) Giddings, J. C. Dynamics of Chromatography: Principles and Theory; CRC Press, 2017.
(5) Broeckhoven, K.; Eeltink, S.; De Malsche, W.; Matheuse, F.; Desmet, G.; Cabooter, D. Current and Future Chromatographic Columns: Is One Column Enough to Rule Them All? LCGC North Am. 2018, 36 (s6), 9–17.
(6) Carr, P. W.; Stoll, D. R.; Wang, X. Perspectives on Recent Advances in the Speed of High-Performance Liquid Chromatography. Anal. Chem. 2011, 83 (6), 1890–1900. DOI: 10.1021/ac102570t
(7) Carr, P. W.; Wang, X.; Stoll, D. R. Effect of Pressure, Particle Size, and Time on Optimizing Performance in Liquid Chromatography. Anal. Chem. 2009, 81 (13), 5342–5353. DOI: 10.1021/ac9001244
(8) Carr, P. W.; Stoll, D. R. Speed and Performance in Liquid Chromatography. In Multi-Dimensional Liquid Chromatography: Principles, Practice, and Applications; CRC Press, 2022; Chapter 2.
(9) Broeckhoven, K.; Gunnarson, C.; Stoll, D. R. But Why Doesn’t It Get Better? Kinetic Plots for LC, Part III – Pulling It All Together. LCGC Eur. 2022, 35 (4), 130–134. DOI: 10.56530/lcgc.na.vi2966r2
About the Column Editor
Dwight R. Stoll is the editor of “LC Troubleshooting”. Stoll is a professor and the co-chair of chemistry at Gustavus Adolphus College in St. Peter, Minnesota, USA. His primary research focus is on the development of 2D-LC for both targeted and untargeted analyses. He has authored or coauthored more than 75 peerreviewed publications and four book chapters in separation science and more than 100 conference presentations. He is also a member of LCGC’s editorial advisory board. Direct correspondence to: amatheson@mjhlifesciences.com


LC–MS/MS-Based System Used to Profile Ceramide Reactions to Diseases
April 26th 2024Scientists from the University of Córdoba in Córdoba, Spain recently used liquid chromatography–tandem mass spectrometry (LC–MS/MS) to comprehensively profile human ceramides to determine their reactions to diseases.


High-Throughput 4D TIMS Method Accelerates Lipidomics Analysis
April 25th 2024Ultrahigh-pressure liquid chromatography coupled to high-resolution mass spectrometry (UHPLC-HRMS) had been previously proposed for untargeted lipidomics analysis, but this updated approach was reported by the authors to reduce run time to 4 min.


Traditional Chinese Medicine’s Effects on Liver Cancer Measured Using New UHPLC–QTOF-MS System
April 22nd 2024Scientists from Anhui University of Chinese Medicine in Hefei, China recently investigated the mechanisms behind what makes huachansu tablets, a type of traditional Chinese medicine (TCM), effective against liver cancer.

