

|Articles|July 1, 2022
- July 2022
- Volume 40
- Issue 7
- Pages: 314–320
A Full Scan Data Review Tool to Match the Speed of Acoustic Ejection Mass Spectrometry
Advertisement
Acoustic ejection mass spectrometry (AEMS) has recently emerged as the premier ultrahigh-throughput mass spectrometric methodology for drug discovery and related fields. The ultrahigh analytical speed (~1 s/sample) of AEMS has significantly enhanced the efficiency of many high throughput applications. As a result, a data processing and reviewing tool with a matching speed is in high demand for the large amount of data generated, especially for applications such as quality control (QC) of compound collections and high throughput chemistry, where full-scan MS data required convoluted subsequent peak extraction and evaluation. In this study, we demonstrated the feasibility of a tool developed specifically for this purpose. The process using the tool involved automated splitting of the full scan data to correlate well positions with each signal peak, extraction of expected mass traces, and subsequent peak integration. Data evaluation based on verification rules, such as detected mass accuracy, isotopic pattern, and signal-to-noise ratio (S/N), enabled a comprehensive assessment of sample quality that was complemented by visualization in the form of a plate heat map generated from the selected rules. The tool demonstrated fast and straightforward data review and reporting and, more importantly, at a matching speed of sample analysis by acoustic ejection mass spectrometry. The choice of data processing and storage over the cloud further facilitated results sharing among data users.
The recent emergence and utilization of acoustic ejection mass spectrometry (AEMS) in various miniaturized drug discovery campaigns has significantly increased the throughput and turnaround of these applications (1–3). The enhanced efficiency is driven by the ultrafast analytical speed of AEMS of ~1 s/sample, the direct sampling of a dimethyl sulfoxide (DMSO) solution, and the negligible sample consumption of a few nanoliters. As a result, the high-speed, chromatography-free analysis generates an unprecedented amount of data from a range of high throughput assays arrayed in high-density microtiter plates, shifting the bottleneck of the high throughput workflow from conventionally sample analysis to data review. For quantitative AEMS assays, such as bioanalysis of cytochrome P450 or transporter inhibition, where a single probe substrate is detected across plates by multiple reaction monitoring (MRM)–mass spectrometry (MS), the data review is usually straightforward, involving mainly MRM peak integration and subsequent intensity comparison across wells or plates if needed (4). However, for qualitative or semiquantitative analysis using full scan MS detection, the data review is much more involved. Examples of such analysis include reaction monitoring in high throughout chemistry (HTC) (5), compound integrity check in high throughput screening (HTS) (6,7), and quality control (QC) in compound management and storage (8). The full scan data review on these occasions requires generating an extracted ion chromatogram (XIC) from the complex total ion chromatogram (TIC), for each well of the microtiter plate typically containing discrete targeted analytes to help identify the presence or absence of the expected compounds of interest. Subsequently, a verification needs to be established for each sample based on both target identity (qualitative) and amount (quantitative). Manual or even semiautomatic execution of this process is tedious and time-consuming, more so for full scan data acquired on quadrupole MS when the unit resolution alone is inadequate for definitive identity confirmation, compared to full scan data acquired on high resolution MS (5). The requirement for speedy full scan data processing propelled by the ultrafast AEMS has made the automated data processing tool in high demand, especially when better understanding of AEMS mechanism and exploration of novel operation modes continue to push for even faster data acquisition speed (9,10). In addition, the availability of an automated full scan data processing tool can facilitate the utilization of full scan AEMS for nonsubstrate-based or compound-based quantitative assays, such as in vitro metabolic stability, to eliminate the MRM optimization required for these assays (11). Without any commercially available tools in place, significant effort and resources have been spent on the development and maintenance of custom-built analytical tools for full scan data processing (12), or combinations of commercial software supported by home-built scripts (13). These user-built tools, mainly developed for specific applications, lack the comprehensive considerations required for various full scan functions from expansive user groups.
We have previously reported a fully vendor-supported, semiautomated full scan data review platform, using a research version data splitting tool and commercially available software (8). Although the platform has provided the basic functions required for the full scan AEMS data review, the lack of needed speed still made data processing the bottleneck of the entire analytical process. In this platform, the correlation between AEMS signal peaks in the data file with their respective well positions in the sample plate had to be made manually by assigning the retention time for the first ejection, which sometimes could be confusing and unreliable. Because the software was initially designed for processing high resolution MS (HRMS) data, it was not entirely applicable to quadrupole full scan data for which more stringent data survey and verification rules were needed to compensate for the unit resolution by quadrupole MS. In addition, the lack of any plate-based visualization capability in the tool, such as plate heat maps, compelled users to perform plotting and graphing in excel using exported results.
In this study, we evaluated a commercially available, automated full scan AEMS data review tool developed and supported by the AEMS instrument vendor Sciex. The tool specifically incorporated verification rules to support processing of full scan AEMS data acquired on quadrupole MS, in addition to HRMS. The process using the tool included data splitting using an add-on app as an integral part of the system operating software for aligning signal peaks in the data file with the corresponding well positions in the sample plate. It also included cloud-based data processing with unique features such as isotopic pattern comparison of target compounds between the observed and theoretical spectra (as opposed to confirmation of just protonated molecules previously) and background subtraction for eliminating matrix interference. The tool allowed for results visualization in the format of a heat map for a plate-based survey of the sample characteristics. The effectiveness of the tool, including rates for false positive or false negative, data processing speed, user friendliness and versatility for AEMS full scan data, were evaluated.
Materials and Methods
A Sciex Echo MS system was used for all of the sample analysis and data acquisition. The system comprised of an acoustic droplet ejection module coupled to a triple quadrupole mass spectrometer 6500+. An open-port interface (OPI), designed to capture and transport the ejected samples, was mounted between the acoustic dispenser and an OptiFlow ion source equipped on the MS instrument. The OPI carrier solvent used was 0.1% (v/v) formic acid (J.T. Baker) in methanol (MilliporeSigma), delivered by a gear pump. The system was operated by the Sciex OS operating software with both the MS instrument and acoustic dispenser built into the system hardware configuration. The ion source gas 1 (nebulizing gas) was set at a fixed value of 90 psi, and the carrier solvent flow was fine-tuned (typically around 0.43 mL/min) to achieve the proper formation of a “stable vortex” at the inlet of OPI, commanded by a balanced flow of the carrier solvent and nebulizing gas. The balanced solvent and gas flows allowed for the most efficient transportation of ejected samples through the OPI sample transfer tube to the MS for detection. The ion source gas 2 was set at 50 psi, curtain gas at 20 psi, and the source temperature at 300 °C. The MS was operated under a positive electrospray ionization (ESI) mode at a spray voltage of 5500V, and full-scan data (m/z 150–800) were acquired at a scan speed of 2000 Da/s. All samples from an entire plate (or user assigned wells from an AEMS run) were acquired into a single MS data file. An ejection volume of 5 nL was employed, with a pause time of 1 s between each sample ejection. The sample plates used were the Echo Qualified 384-Well flat-bottom plate or the LDV COC MS 1536-well plate (Beckman Coulter).
In setting up sample analysis, a “marker well,” typically containing a compound of a known identity, was ejected at the beginning of the sample sequence. Unlike other samples or wells, the marker well underwent a unique ejection pattern containing three ejection events, a single-droplet ejection, a continuous droplet ejection at a low frequency of 10 Hz for 1.5 s, followed by another single-droplet ejection. The recognition of this ejection pattern of the marker well by the data processing algorithm enabled a determination of the delay time from the acoustic ejection event to the MS signal, which was then used to correlate all other MS signal peaks with their appropriate sample well positions. The user may also choose to incorporate a blank matrix well in the plate to generate its mass spectrum that can be used for background subtraction in later data processing. The blank matrix spectrum may also be generated on a separate analysis occasion and saved in a separate data file.
The tool used for full scan AEMS data processing consisted of a Splitter, a Sciex OS add-on app, and OneOmics, a web-based data review suite. The workflow using the tool included four major steps: TIC data file splitting, XIC extraction, sample verification, and plate visualization (Figure 1). The post-acquisition TIC data file contained all of the ejections from a run and was first split into individual subfiles, with each containing a TIC peak from one ejection. The split subfiles were then uploaded to the cloud via the WIFFDB Manager app in the OneOmics Suit, followed by data processing and review by the Echo MS app. For peak extraction, a Microsoft Excel file was first browsed into the app tabulated with the well position, expected target compound formula and charge agent (H+, NH4+, Na+ and others) for up to five targets per well. The expected m/z value was then searched in the full scan data based on the extracting window set by the user, typically ±0.5 amu of the targeted mass calculated from the formula and charge agent provided for quadrupole data, to produce XIC for each ejection. From the XIC generated, the full scan mass spectrum can be visualized for any selected wells of interest. With a user-defined window (for instance, for ±10 amu of the targeted mass), the observed mass spectrum may be overlayed with the theoretical isotopic distribution calculated from the formula of the target compound. A score of correlation was then deduced from the isotopic pattern comparison for each compound well. Combined with the detected mass accuracy, as well as the signal-to-noise ratio (S/N) of the XIC peak for respective wells, the sample quality was evaluated for verification purposes. The results can then be visualized in the format of a plate heat map, and color-coded for each well based on their verification status before being exported in the form of an Excel file.
Results and Discussion
AEMS analysis achieved an ultrafast analytical speed of seconds or subseconds per sample, using acoustic technology for direct liquid sampling coupled with MS detection. Unlike the conventional LC–MS analysis where each injection is typically acquired to a single data file, AEMS analysis has a single MS file remained open for the acquisition of all ejections from an applicable microtiter plate, either 384-well or 1536-well. This way, the overhead associated with opening and closing the individual acquisition files for each ejection is eliminated to achieve an overall maximized analytical speed. Therefore, the resulting data file may contain hundreds or more signal peaks, which presents challenges in the downstream data processing in terms of appropriately correlating the microtiter plate well positions with their corresponding signal peaks in TIC. This matching or correlating process could be perplexing if the correlation is solely based on finding the expected mass in the respective wells, especially when the wells under survey may be absent of the expected mass or present with the same expected mass. In AEMS, the scanning of the marker well was designed to eliminate that confusion via the unique signal pattern of a continuous infusion bracketed by two single-droplet ejections. The confirmation of the marker well at both the beginning and end of the sample sequence provided unequivocal association of its retention time in the TIC to the marker well position, which enabled a definitive correlation of all other well positions with their respective signal peaks based on the delay time set across each ejection during acquisition (Figure 2a). The provision of the marker well retention time in the Splitter then ensured an appropriate assignment of post-split subfiles to their respective well positions in the sample plate (Figure 2b).
From the post-split subfiles, XIC was generated based on the imported compound information and user-defined search criteria (Figure 3a). Simultaneous search and extraction of multiple targets in each well offered the much-needed versatility for applications like HTC to help identify not only the expected products, but also the remaining starting materials and potential side products (Figure 3b). The choice of different charge agents, such as proton adduct and sodium adduct for the target compounds, enabled a comprehensive survey of the targets in the full scan data and minimized potential false negatives in cases where unexpected adducts were formed. Although generating XICs multiple times with one charge agent in each could be implemented as previously reported (8), it would significantly slow down the data extraction process.
In the data review tool, based on the XIC, the observed mass spectrum was then displayed and overlaid with the theoretical isotopic distribution of the target compound, enabling a direct visualization of the correlation between the two (Figure 4). A correlation score, or “average ratio offset,” was also calculated for a more quantitative comparison. For each target compound, the observed intensity ratios of the found isotopic mass M+2 and M+1 over M were compared respectively with the corresponding theoretical ratios calculated from the formula, and the average ratio difference from the comparison was defined as the average ratio offset. The lower the offset was, the better the overlay was between the observed and theoretical isotopic distribution; hence, the higher the confidence was in the match to the expected target compound. The average ratio offset offered additional assurance in identity confirmation compared to the simple matching of the protonated molecule, which was especially helpful for quadrupole full scan data where unit resolution was inadequate in differentiating isobaric interferences, which could shift the observed peak mass centroid and affect the apparent isotope ratios. In this case, a poor average ratio offset from the targeted mass would raise a red flag for potentially false positive findings. In addition to its utility for small molecule identification in HTC or compound QC, the isotopic distribution overlay was also an effective approach for identifying trace metal chelated organic complexes, which typically displayed characteristic isotopic fingerprints unique to the chelating metal involved (14). We have demonstrated the utility of this approach in the investigation evaluating chelator effectiveness and chelating ratios between thiourea (TU, C23H26N4OS) and palladium (Figure 5). The metal-chelated organic complexes have been demonstrated to produce false positives in HTS campaigns (15), whereas an ultrafast AEMS scanning of the HTS plate would effectively detect the complexes to avoid misleading HTS results.
Direct MS analysis of small molecules in biological assays or chemical reactions by AEMS can be subject to interferences by the matrix that is otherwise removed by chromatography in LC–MS analysis. The presence of interfering background ions in the matrix, especially when their isotopic distribution fully or partially overlapped with that of the target compound, may result in a false positive target identification or an overestimation of target quantity. Subtracting common background ions from those of the analytes was an effective approach to minimize the interference, which was especially helpful for full scan data acquired on quadrupole MS because it lacked the resolving power offered by HRMS (Figure 4).
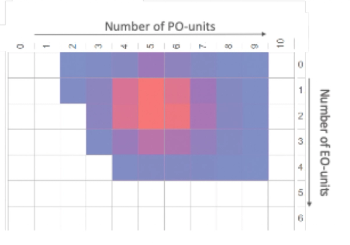
In the data processing and reviewing tool, a results table was in place upon generation of XICs and tabulated with parameters for qualitative target evaluation, including expected formula, detected mass, absolute mass error compared to the theoretical, average ratio offset. Other parameters for quantitative target evaluation, such as XIC intensity and S/N ratio, were also listed in the table. Among them, three parameters were used for sample verification in both qualitative and quantitative terms based on thresholds set by the user, including absolute mass error, average ratio offset, and S/N ratio. The targeted compound was only verified when criteria for all three were met, with a green-coded verification status listed in the results table; otherwise, a yellow-coded status was displayed to indicate that further investigation was needed. The sample quality of the entire plate may be visualized in the form of a plate heat map, with wells color-coded based on the detected XIC intensity (Figure 6). At user discretion, samples failing verification may be excluded from the plate heat map, as illustrated by an “x” in the heat map. When any of the verification rules were modified, the results table and plate heat map were automatically updated, making this interactive feature especially convenient while greatly enhancing the speed of the data review process.
Conclusion
The tool we evaluated has demonstrated feasibility for AEMS full scan data processing and review, with well-designed features for reliable data extraction, compound identification, sample verification, and results visualization. The unique scan feature of the marker well in the sample plate ensured proper extraction of appropriate mass from the corresponding well positions. The identification and verification features were especially beneficial for full scan data acquired on unit-resolution quadrupole MS, which could more likely generate false positives or false negatives compared to data obtained on HRMS. Enabled by the user selectable verification rules, the comprehensive assessment of the sample quality in both qualitative and quantitative terms was complemented by results visualization in the form of a plate heat map and an exportable results table. The tool demonstrated fast and straightforward data processing and review. More importantly, this process was done at a matching speed to that of sample analysis by AEMS, effectively eliminating the bottleneck of the analytical process. The choice of data processing and storage over the cloud further facilitated results sharing among data users.
Acknowledgment
We would like to thank Dr. Anthony Cauley and Dr. Yong Zhang of Bristol-Myers Squibb, Small Molecule Drug Discovery, for generating the HTC samples for this study.
References
(1) H. Zhang, C. Liu, W.Y. Hua, L.P. Ghislain, J.H. Liu, L. Aschenbrenner, S. Noell, et al, Anal. Chem. 93(31), 10850–10861 (2021).
(2) W.Z. Shou, Biomed. Chromatogr. 36(2), e5278 (2022).
(3) G. Fischer, LCGC North Am. 38(12), 666–667 (2020).
(4) A. Wagner, J. Zhang, C. Liu, T.R. Covey, T.V. Olah, H.N. Weller, and W.Z. Shou, Anal. Chem. 92(19), 13525–13531 (2020).
(5) K.J. DiRico, W.Y. Hua, C. Liu, J.W. Tucker, A.S. Ratnayake, M.E. Flanagan, et al, ACS Med. Chem. Lett. 11(6), 1101–1110 (2020).
(6) R.P. Simon, T.T. Habe, R. Ries, M. Winter, Y.T. Wang, A. Fernandez-Montalvan, D. Bischoff, et al, Slas Discovery 26(8), 961–973 (2021).
(7) X.J. Wen, C. Liu, L. Ghislain, K. Tovar, V. Shah, S.J. Stout, S. Cifelli, et al, Anal. Chem. 93(15), 6071–6079 (2021).
(8) J. Zhang, Y. Zhang, C. Liu, T. Covey, J. Nielsen, S. Li, H. Weller, and W. Shou, Slas Technology 26(2), 178–188 (2021).
(9) C. Liu, G.J. Van Berkel, D.M. Cox, and T.R. Covey, Anal. Chem. 92(24), 15818–15826 (2020).
(10) T.T. Habe, C. Liu, T.R. Covey, R.P. Simon, W. Reindl, F.H. Buttner, et al, Anal. Chem. 92(18), 12242–12249 (2020).
(11) T. Hollenbeck, S. Thibodeaux, P. White, L. Westling, A. Chong, and J. Isbell, J. Pharm. Sci. 109(11), 3285–3291 (2020).
(12) J.W. Sawicki, A.R. Bogdan, P.A. Searle, N. Talaty, and S.W. Djuric, React. Chem. Eng. 4(9), 1589–1594 (2019).
(13) S.S. Lin, S. Dikler, W.D. Blincoe, R.D. Ferguson, R.P. Sheridan, Z.W. Peng, D.V. Conway, et al, Science 361(6402), 7 (2018).
(14) T.P. Forbes, Rapid Commun. Mass Spectrom. 29(1), 19–28 (2015).
(15) J.C. Hermann, Y.S. Chen, C. Wartchow, J. Menke, L. Gao, S.K. Gleason, et al, ACS Med. Chem. Lett. 4(2), 197–200 (2013).
Jun Zhang, Wilson Shou, and Harold Weller are with Bristol Myers Squibb in their Research and Early Development department, in Princeton, New Jersey. Chang Liu, Cristiano Veiga, and Tom Covey are with Sciex, in Concord, Ontario. Direct correspondence to:
Articles in this issue
about 4 years ago
Improved Performance of UHPLC–MS Hyphenated Systemsabout 4 years ago
Whence the Next Generation of Macromolecular Separations Scientists?Advertisement
Related Content
Advertisement


Advertisement
Advertisement
Trending on LCGC International
1
AI/ML in Practice: Machine-learning Prediction of Chromatographic Retention Times for Small Molecules in Pharmaceutical Applications
2
Emerging Contaminants and the Shifting PFAS Landscape
3
Chromatography's Role in Spotting False Leachables
4
Fast GC-MS/MS Detects PFAS in Food Packaging
5