Applying Sustainability Concepts to Modern Liquid Chromatography
There have been incredible developments over the last century brought about by the world shifting from focusing on productivity and efficiency to becoming increasingly focused on the impact that society has on the environment, and indeed on our own well-being. Climate change is already impacting society, and therefore behaviors, both individually and collectively, must be modified to create a better and more sustainable path forward. Governments are striving to implement policy changes towards a greater use of green technology, specifically around the generation of energy. Individuals and industrial organizations have also taken up the challenge, and now many companies are driving to significantly reduce their environmental footprint, or indeed become carbon negative within very short time frames (5–10 years). This generation, perhaps more than any other previous one, may be closest to causing wide-scale calamitous changes to the planet and to society. It is therefore pertinent for all aspects of society to assess what can be achieved to reduce the environmental footprint, no matter how small the impact may seem.
This also includes the re-evaluation of daily operations within the scientific community. Hence, environmentally friendlier chromatography approaches are required as it is one of the main analytical techniques utilized for accurate and precise measurements. It is estimated that globally, over 150,000 tons of methanol and acetonitrile combined are used in chromatographic environments annually, requiring 15,000 trees to be grown over 10 years to remove the carbon load from the environment. The chromatography community (end users and manufacturers) therefore need to look at approaches that will reduce the environmental impact, in order to ensure that a minimalistic approach to using valuable resources is employed.
Determining the correct approach that should be employed can be confusing; however, the first port of call would be the 12 principles of green chemistry (1). These principles, developed by John Warner and Paul Anastas in the 1990s, are essentially a checklist of ways to reduce both the environmental impact and negative health impact of chemicals. The application of these principles in a chromatographic environment can often serendipitously also provide efficiency improvements. The twelve principles are shown in Figure 1.

.")
FIGURE 1: The twelve principles of green chemistry (1).
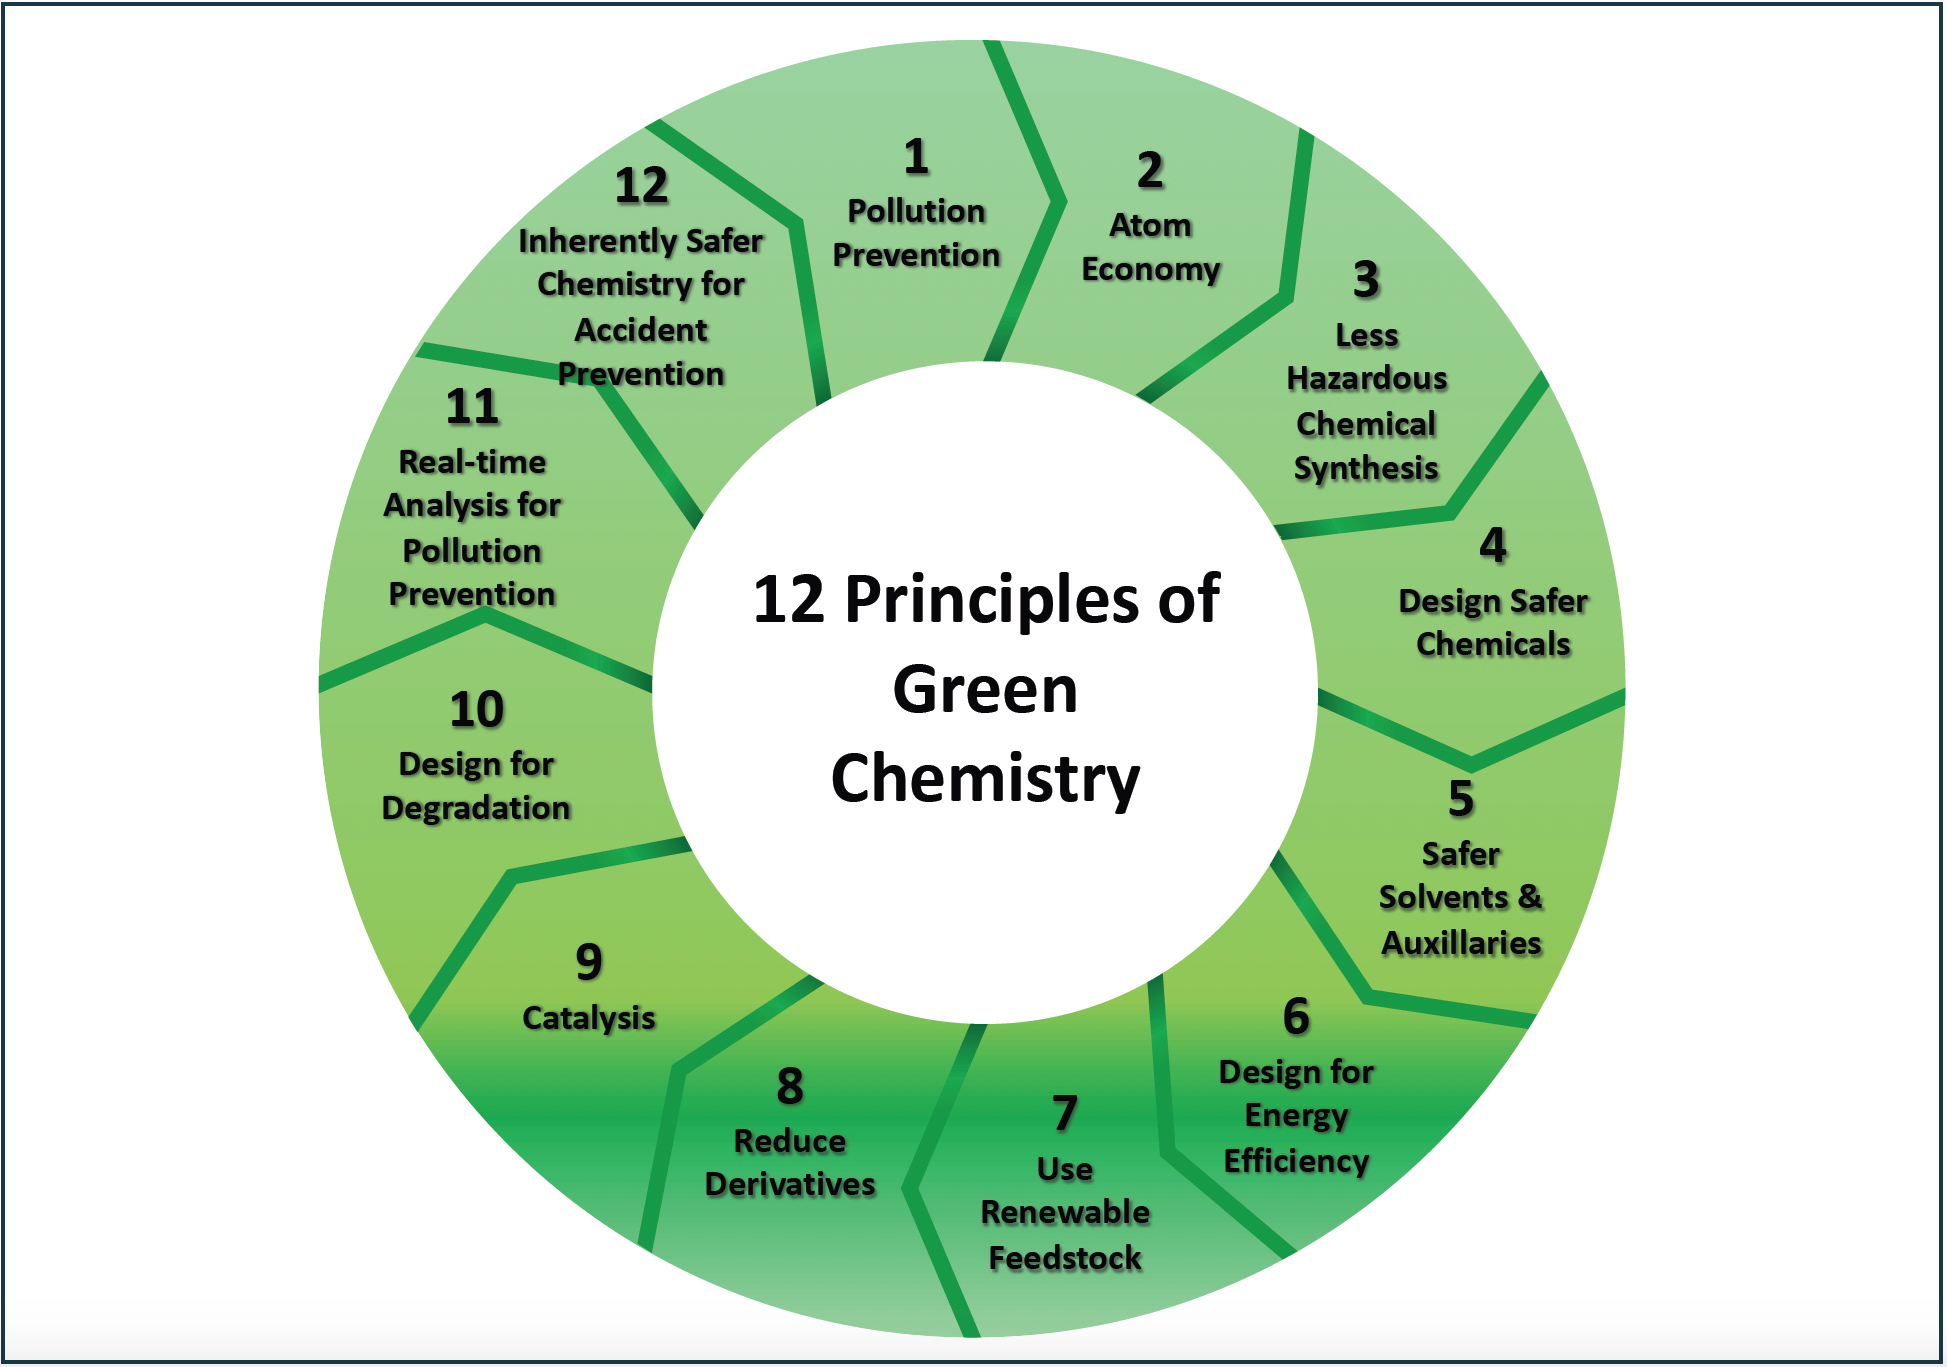
These guiding principles can aid manufacturers and end users in reducing their impact through approaches such as reducing the column diameter, using smaller particles or superficially porous particles to drive high efficiency chromatography, and also by streamlining method development processes. Organizations that will aid the implementation of greener approaches are available, such as MyGreenLab (2), by assessing the performance of instrumentation throughout their lifecycle. This is done through the ACT (Accountability, Consistency, and Transparency) program.
The following article will detail how some of the 12 principles can be applied in a methodical approach to liquid chromatography (LC), and the impact that these changes have in terms of environmental impact as well as the chromatographic performance. The implications of this approach will also be assessed from a manufacturer’s perspective.
Utilizing Modern Chromatographic Approaches
Advances in LC instrumentation and the commercialization of ultrahigh-pressure liquid chromatography (UHPLC) systems capable of operating at >1,500 bar have improved the usability of smaller column formats, and made the use of smaller, sub-2 μm particles a reality. The extended pressure capabilities are required as the pressure drop across a column of fixed length scales to square of the particle size (dP) (3). In addition to extended pressure capabilities, these systems feature optimized component designs and substantially reduced extra column volumes. The operation of UHPLC favours smaller i.d. columns, which reduces solvent consumption, although UHPLC is not the only approach the chromatographers have been employing to reduce their environmental footprint.
Smaller Column Formats
Narrow ID
Downscaling the column’s i.d. is one of the simplest ways to implement environmentally friendlier practices, and is applicable to all forms of high performance liquid chromatography (HPLC), not just exclusively UHPLC. Reducing the i.d. decreases solvent consumption and waste production, because the column is operated at significantly lower flow rates compared to wider bore columns. Additionally, the manufacturing process of a narrow-bore column itself uses less materials compared to analytical-scale columns (with respect to stationary phase, stainless steel, packing solvent and reagents).
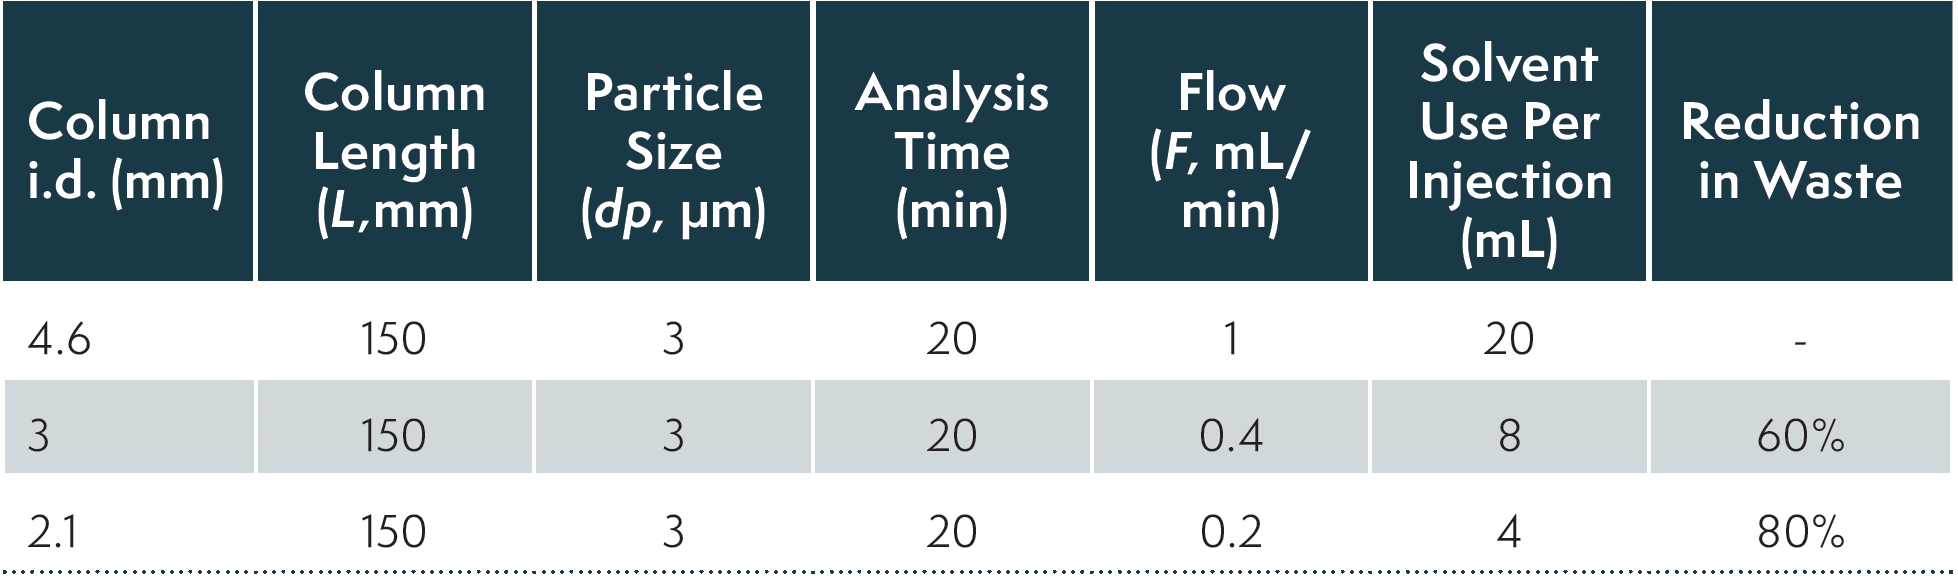
In many LC-ultraviolet (LC-UV)-based analytical laboratories, 4.6-mm i.d. columns are commonly used. Reducing the i.d. of the analytical column for a method can bring multiple benefits to the overall analysis workflow for both LC-UV and liquid chromatography-mass spectrometry (LC–MS) methods. Table I clearly demonstrates how reducing the column i.d. and running at a reduced flow rate can significantly impact solvent consumption (by up to 80%), and drive improved laboratory sustainability. It is important to note that 2.1-mm columns are highly prone to the impacts of extra column dispersion, and are therefore suited to modern low dispersion systems (4,5). The 3.0-mm i.d. can be considered as a more forgiving option that is more universally applicable, and can still deliver an impressive 60% reduction in mobile phase use per injection. For LC–MS laboratories, 2.1-mm i.d. columns are ideally suited to the low volumetric flow rates required to enhance the ionisation process at the electrospray ionization (ESI) interface.


TABLE I: Solvent consumption and waste reduction for different i.d. columns.
To translate a method to a smaller column i.d. the flow rate (F) must be scaled to maintain a constant linear velocity of mobile phase, and the injection volume should be scaled. Guidance on how to achieve this and a variety of free web-based translator tools are widely available (6–8). It is also worth noting that, if the injection volume is not scaled, a substantial increase in sensitivity can be obtained (9).
Figure 2 demonstrates the reduction of the column i.d., first from 4.6 mm to 3.0 mm, and then to 2.1 mm for a complex peptide mapping separation. Note that the selectivity and resolution of the separation is well maintained on the different i.d. columns.

 4.6 mm to (b) 3.0 mm then to (c) 2.1 mm and (d) the impact on solvent consumption. Peak capacities stated are the average for peaks 1–4 in each chromatogram. Columns: Avantor ACE UltraCore 2.5 SuperC18; Mobile phase A: 0.05% TFA in water, B: 0.05% TFA in MeCN; Gradient: hold at 5% B for 1.5 min* then 5 35 %B in 30 min, then 35-96 %B in 5 min; Temperature: 60 °C; Detection: UV, 214 nm. *The isocratic hold duration was adjusted to compensate for the change in the VD/VM ratio when translating to a smaller ID column, (6,7) where VD is the dwell volume of the chromatographic system.")
FIGURE 2: Scaling the column i.d. for the analysis of a bovine serum albumen peptide digest sample from (a) 4.6 mm to (b) 3.0 mm then to (c) 2.1 mm and (d) the impact on solvent consumption. Peak capacities stated are the average for peaks 1–4 in each chromatogram. Columns: Avantor ACE UltraCore 2.5 SuperC18; Mobile phase A: 0.05% TFA in water, B: 0.05% TFA in MeCN; Gradient: hold at 5% B for 1.5 min* then 5 35 %B in 30 min, then 35-96 %B in 5 min; Temperature: 60 °C; Detection: UV, 214 nm.
*The isocratic hold duration was adjusted to compensate for the change in the VD/VM ratio when translating to a smaller ID column, (6,7) where VD is the dwell volume of the chromatographic system.
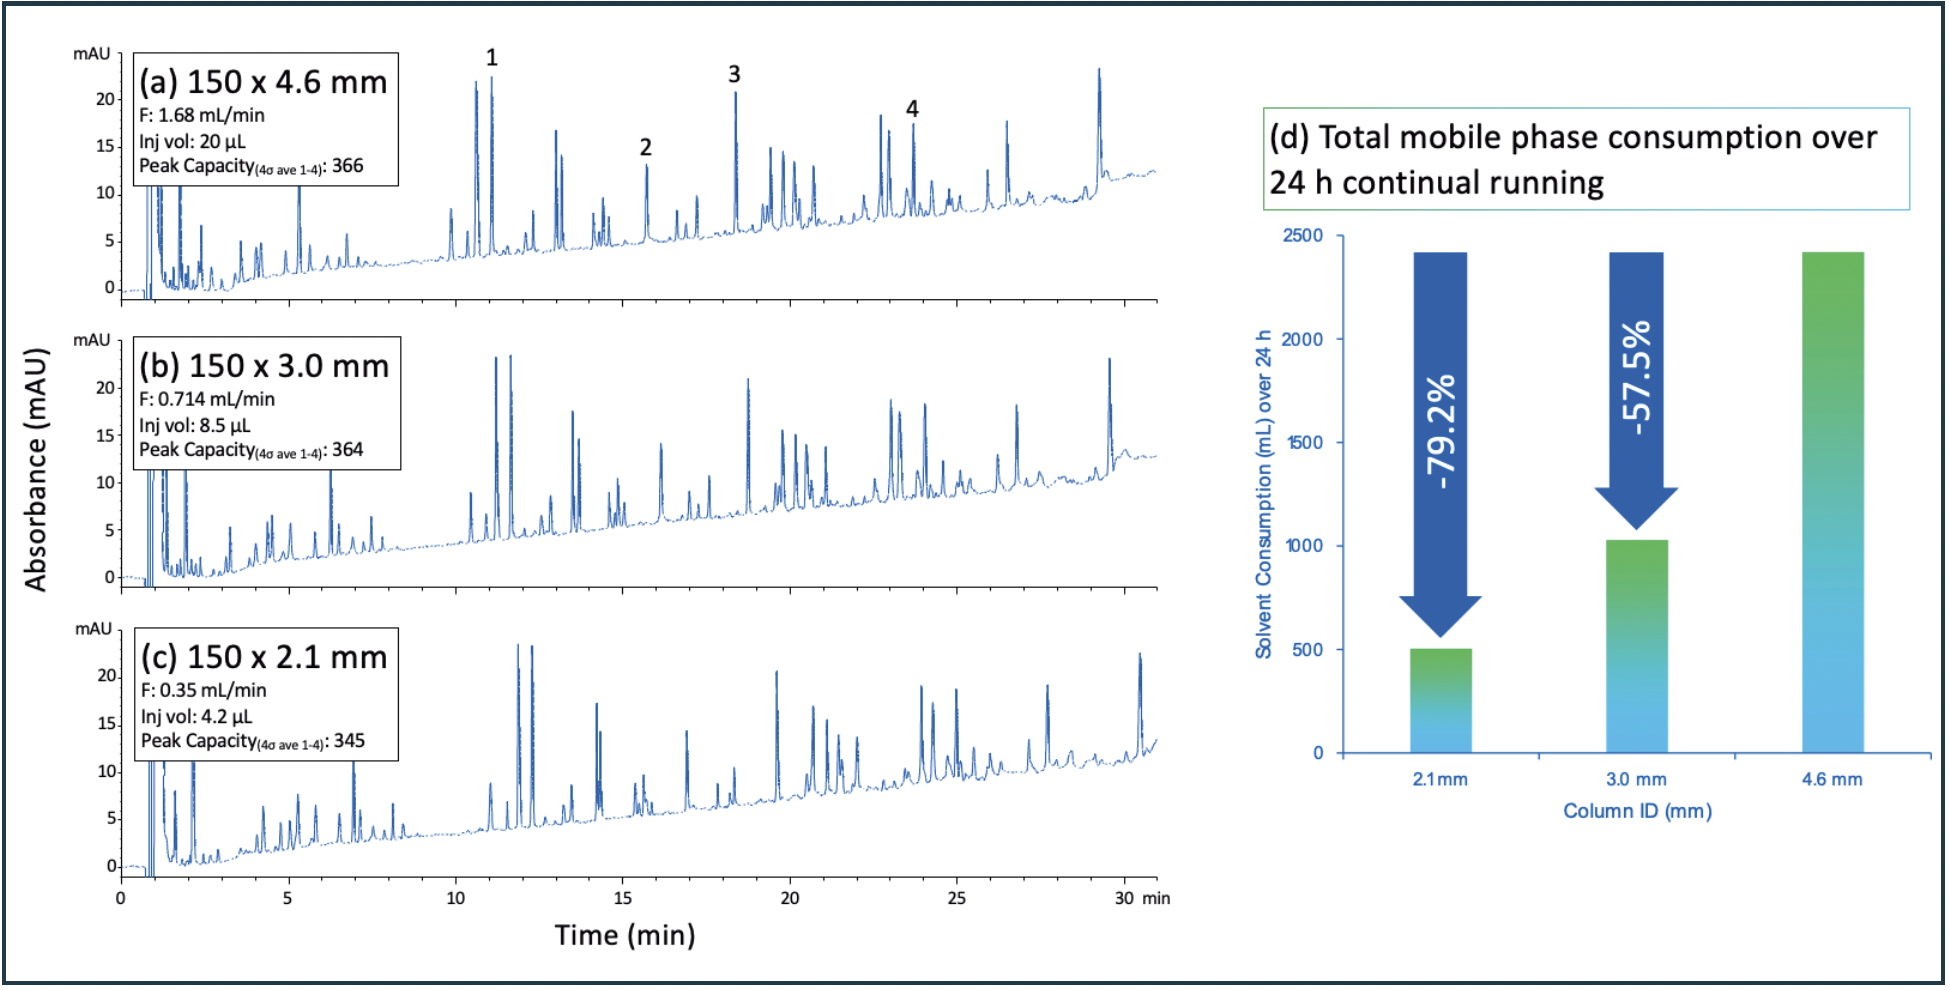
Despite the reduced injection volume, sensitivity is equivalent, highlighting the applicability of narrow bore columns to sample-limited assays. A small reduction in peak capacity was observed for the 2.1-mm i.d. column compared to the 3.0 and 4.6-mm i.d. columns because of the more significant impact of extra column volume and wall effects on this narrower column i.d., but this had minimal impact on the separation and sensitivity obtained.
Shorter Columns and Smaller Particles
Using smaller, more efficient silica particles means that the same separation efficiency can be obtained using shorter columns. Halving the column length (L) whilst keeping the flow rate the same will halve analyte retention time, and hence the run time, thereby achieving a 50% reduction in mobile phase consumption. If the particle size (dP) is also halved (L/dP remains the same), then the same separation efficiency will be obtained. Additionally, equilibration times for isocratic methods will be reduced, while for gradient methods, shorter post-gradient re-equilibration times will be required. The shorter run times have the additional benefit of lowering energy consumption as either the LC system is operating for a shorter period of time, or fewer LC instruments are required to meet the laboratory sample demands. Of course, laboratory efficiency, running costs, and sample turnaround times will also be improved. Developing new methods on shorter or smaller particle columns is therefore highly attractive, as these benefits will be realized throughout the method lifecycle.
Many existing LC methods that were developed using older column formats (such as 250 or 150 mm length); 4.6-mm i.d. columns packed with >5 μm particles can readily be translated to smaller column formats. The principles of how to translate LC methods is well established and widely available (6,7,10,11), and, indeed, in the pharmaceutical industry, detailed guidance is provided for the translation of compendium monograph methods (12,13). One of the most fundamental requirements for method translation is that the selectivity or peak spacing should be maintained after method translation. Therefore, stationary phase chemistry must be kept the same, ideally using the same bonded phase and base silica. Most high-quality modern column ranges have particle sizes across the commonly used range, ensuring selectivity is maintained.
Although method translation is often discussed with an emphasis on converting methods to UHPLC, it is important to note that many legacy HPLC methods present opportunities for improvement, without the need to employ UHPLC technology. Similarly, the adjustment of pharmacopoeial methods within allowable regulatory guidance can provide substantial time and cost savings, without the need for method re-validation or expensive capital expenditure in UHPLC equipment (12,13).
Figure 3 demonstrates how an isocratic method can be translated from a legacy column to smaller format UHPLC and HPLC columns to reduce the environmental impact of the analysis. Scaling the separation to a 50 x 3.0 mm UHPLC column packed with 1.7 μm particles provides the most substantial improvements, with an 85.7% reduction in solvent use per injection. The method was also scaled to a 100 x 3.0 mm column HPLC packed with 3 μm particles, and run on the same 400 bar HPLC system to assess the benefits that could be achieved by better utilisation of the current laboratory equipment. Solvent consumption was reduced by an impressive 71.6% without the expense of upgrading to UHPLC equipment (and the associated carbon footprint of manufacture, shipping and disposal of old equipment).

 Reducing mobile phase consumption of an isocratic LC method, using (b) UHPLC and (c) HPLC options. Solvent savings, power consumption and reduction in total run time for 100 injections are shown in the accompanying bar charts. Electrical consumption was calculated using measured electrical usage values of 0.1302, 0.0562 and 0.0194 kWh per sample for the HPLC, optimized HPLC and UHPLC methods.")
FIGURE 3: (a) Reducing mobile phase consumption of an isocratic LC method, using (b) UHPLC and (c) HPLC options. Solvent savings, power consumption and reduction in total run time for 100 injections are shown in the accompanying bar charts. Electrical consumption was calculated using measured electrical usage values of 0.1302, 0.0562 and 0.0194 kWh per sample for the HPLC, optimized HPLC and UHPLC methods.
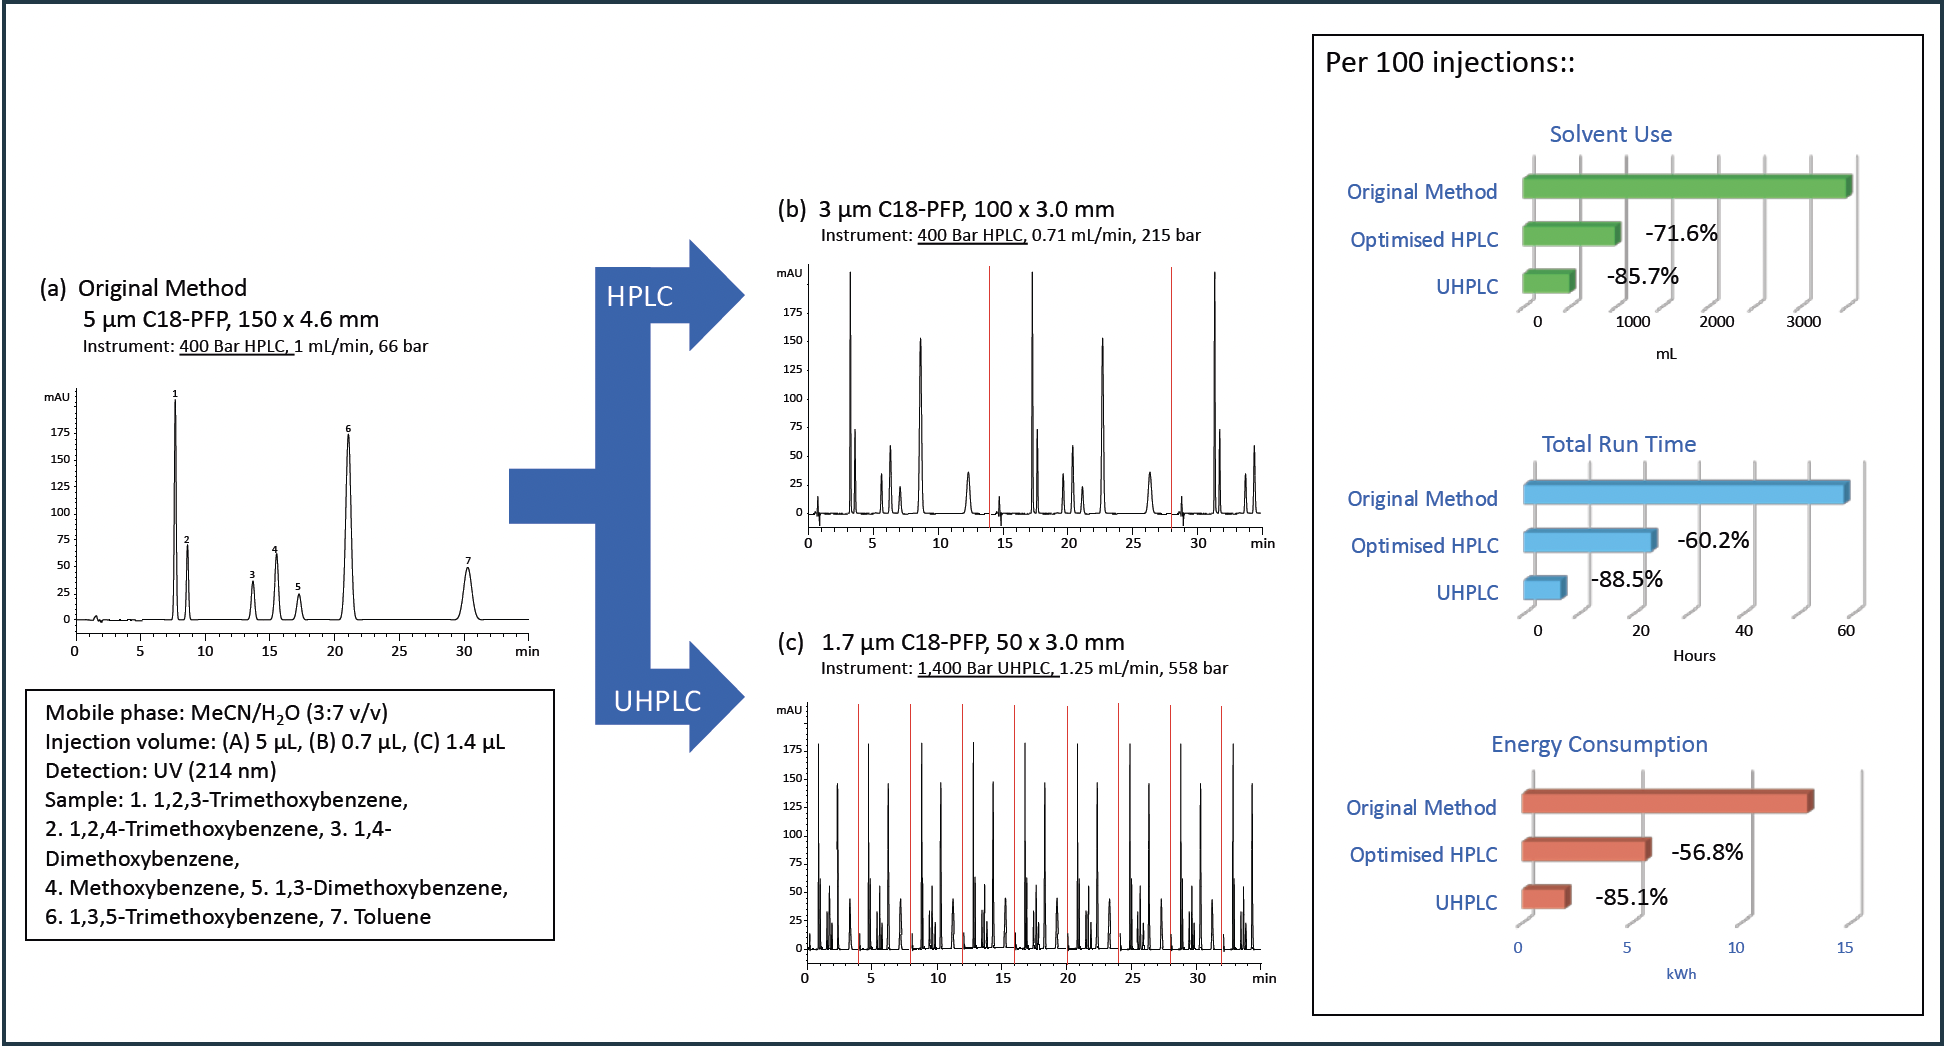
The energy consumption of the various configurations was measured using a power meter during operation. The optimized HPLC method reduced energy consumption by 56.8%, whereas the UHPLC method, run at an elevated flow rate, reduced energy consumption by 85.1%. Similar reductions in solvent and energy consumption for gradient methods are also achievable (14).
Clearly, the use of UHPLC can provide significant improvements to the environmental impact of LC methods, indeed the use of an even smaller i.d. column (2.1 mm) would further impact solvent use to a 93% reduction compared to the original method. However, for laboratories without the option of UHPLC, significant reductions in the environmental impact of existing methods can also be readily achieved.
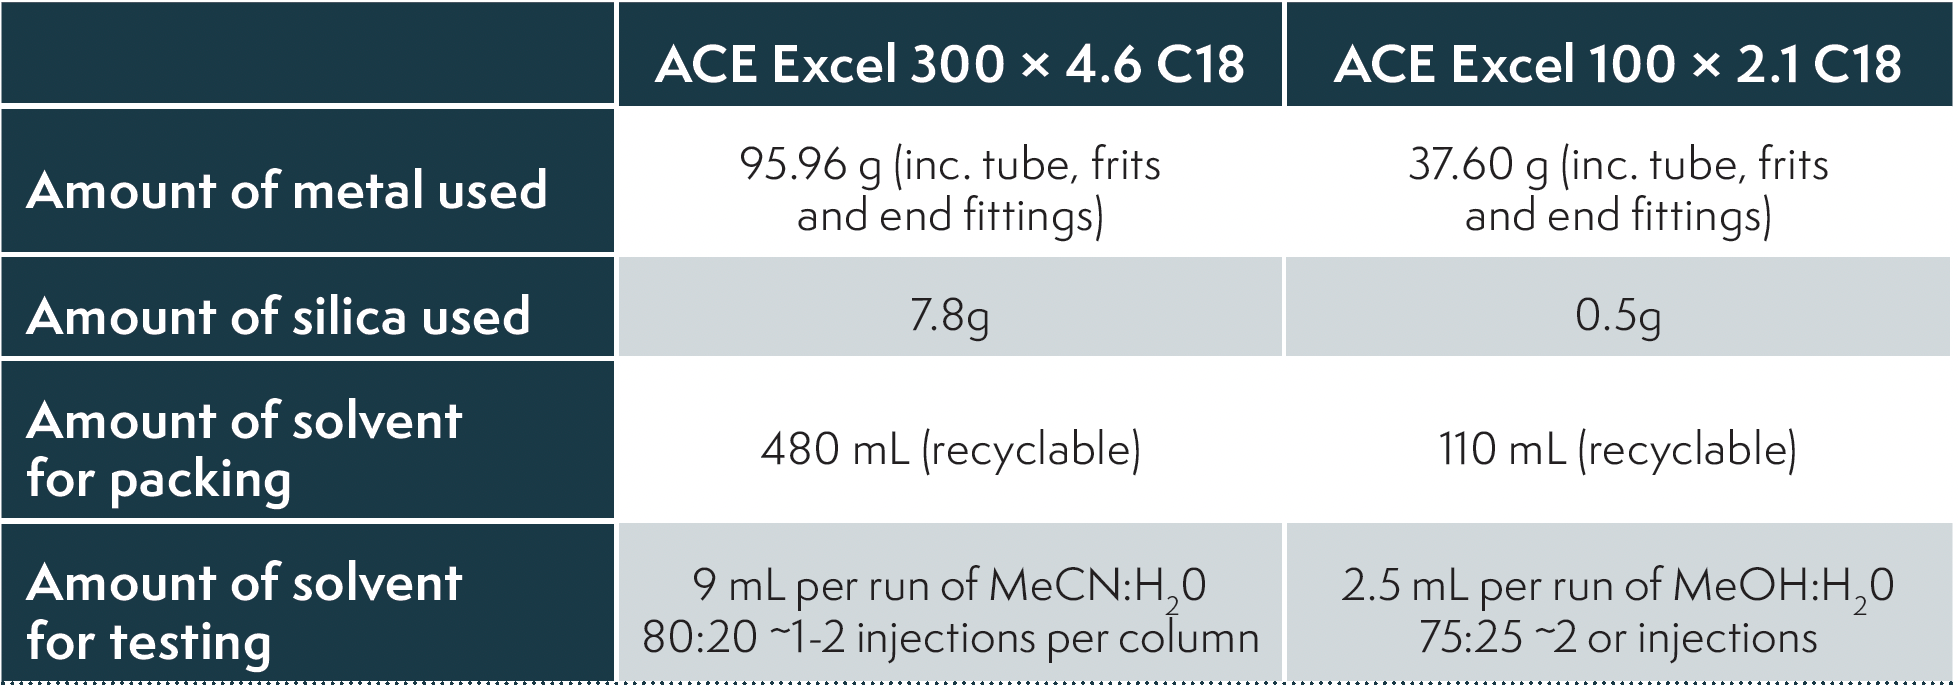
As a final point, it is also worth considering that the environmental benefits of smaller columns are not only observed in the hands of the end user, but also there are benefits to the manufacturing process as typically less silica, solvent and metal is required in their production. Table II gives an indication of the impact of moving from a 300 x 4.6 mm column packed with 5 μm material to a 1 x 2.1 mm packed with 1.7 μm material.


TABLE II: Summary of the material used to manufacture two different sized columns.
Very Short Format Columns
For some applications, excess separation efficiency can be sacrificed in favor of utilizing a shorter column to achieve a faster separation and further reduce solvent consumption. In some cases, the use of very short column formats (20 or 30 mm) may be possible.
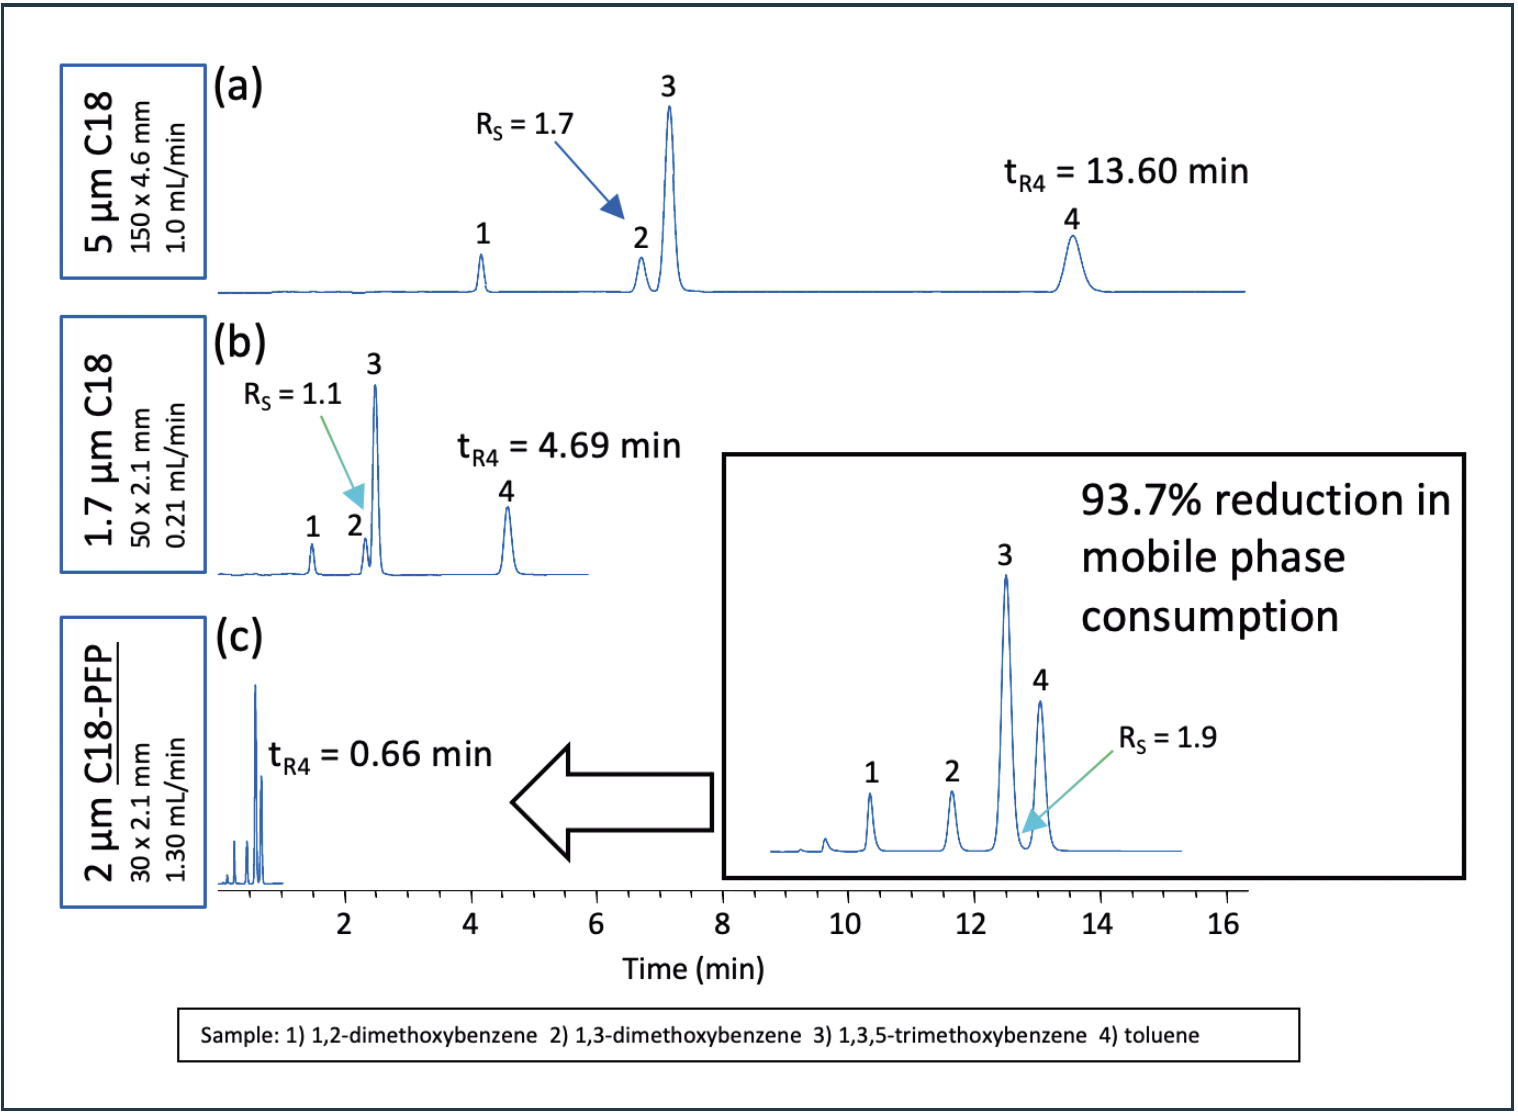
Even in situations where it may not immediately be possible to use this approach, altering the stationary phase selectivity can provide more creative solutions. In the example shown in Figure 4a, separation on a 150 x 4.6 mm 5 μm C18 column was translated to a 50 x 2.1 mm 1.7 μm C18 column; however, the resolution achieved was insufficient, and increasing the flow rate was found to reduce the resolution further. By altering the stationary phase chemistry and using a C18-PFP stationary phase, substantially better resolution than the original method was obtained, great enough to allow the use of an even shorter 30 x 2.1 mm column and the environmental impact of the method substantially reduced.

 Translating a method from a legacy column to a (b) 50 mm UHPLC column packed with the same C18 stationary phase chemistry and (c) to a UHPLC column packed with a novel C18-PFP stationary phase chemistry.")
FIGURE 4: (a) Translating a method from a legacy column to a (b) 50 mm UHPLC column packed with the same C18 stationary phase chemistry and (c) to a UHPLC column packed with a novel C18-PFP stationary phase chemistry.
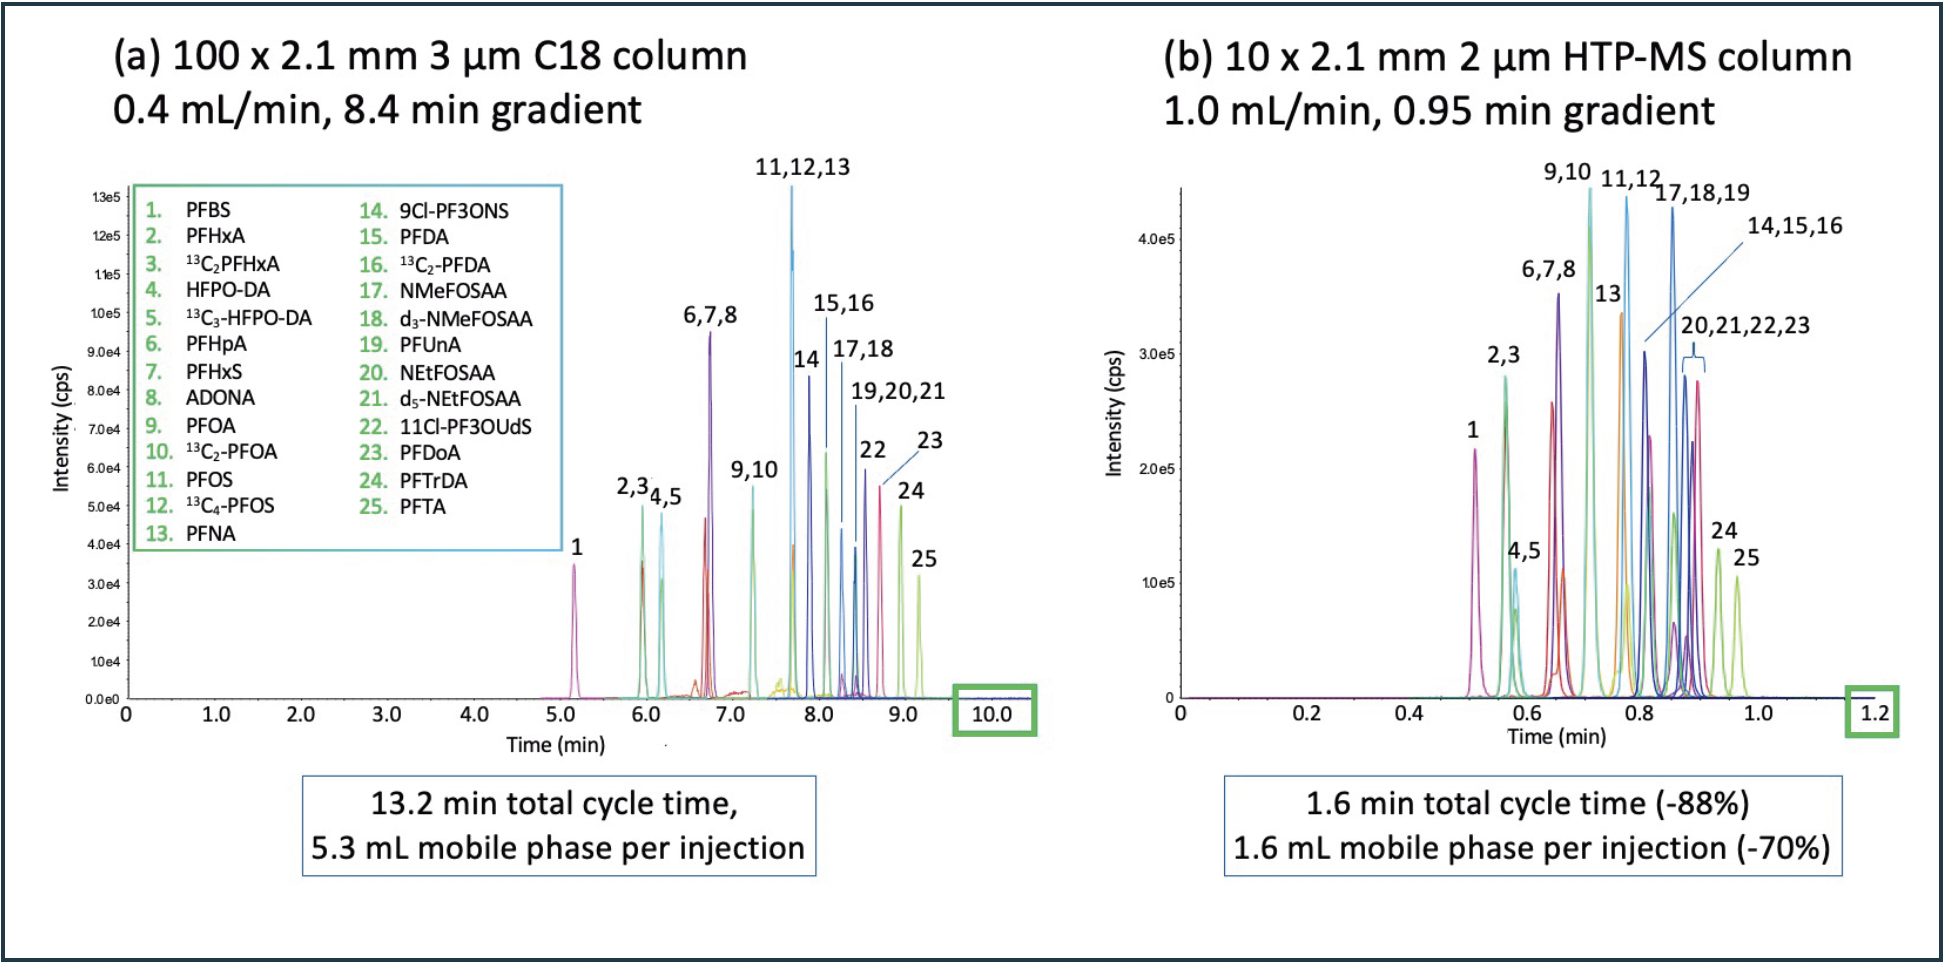
More novel column formats such as 10 mm cartridge-style columns can also provide possibilities for improving the sustainability of chromatographic separations. With LC–MS separations, full chromatographic separation of target analytes is not always required. Provided that the analytes can be retained long enough to resolve from matrix interferences, the separation required can potentially be achieved using such short bed length columns. Figure 5 demonstrates this approach for a range of PFAS analytes. Figure 5a shows a separation on a 100 x 2.1 mm column, which provides reasonable performance from a sustainability perspective over a longer, wider bore format. The same analytes are separated using a 10 mm cartridge column in Figure 5b in 88% less time, and using 70% less solvent. Note that, in this case, column efficiency is reduced by a factor of 6.7, so the absolute chromatographic and quantitative performance will be somewhat reduced. For example, structural isomers that are resolved in Figure 5a are not fully resolved. However, the performance may still be sufficient for certain applications, or could potentially be used to prescreen samples to reduce the number of samples requiring analysis by the full method, thereby still providing potential workflow and environmental benefits.

 100 x 2.1 mm 3 μm column (PFAS analytes 500 ng/L) and b) 10 x 2.1 mm 2 μm cartridge style HTP-MS column (PFAS analytes 100 ng/L).")
FIGURE 5: LC–MS/MS separation of 18 PFAS and seven internal and surrogate standards on a) 100 x 2.1 mm 3 μm column (PFAS analytes 500 ng/L) and b) 10 x 2.1 mm 2 μm cartridge style HTP-MS column (PFAS analytes 100 ng/L).
Solid Core Particles
Solid core particles are another relatively recent introduction to liquid chromatography that can also be considered. The solid core particle architecture provides improved kinetic performance compared to traditional fully porous silica particles (15,16). Thus, a solid core particle will produce significantly higher efficiency than an equivalent sized fully porous particle. Additionally, under the same analytical conditions, solid core particles provide reduced retention due to a combination of reduced surface area and reduced permeability, and consequently faster run times.
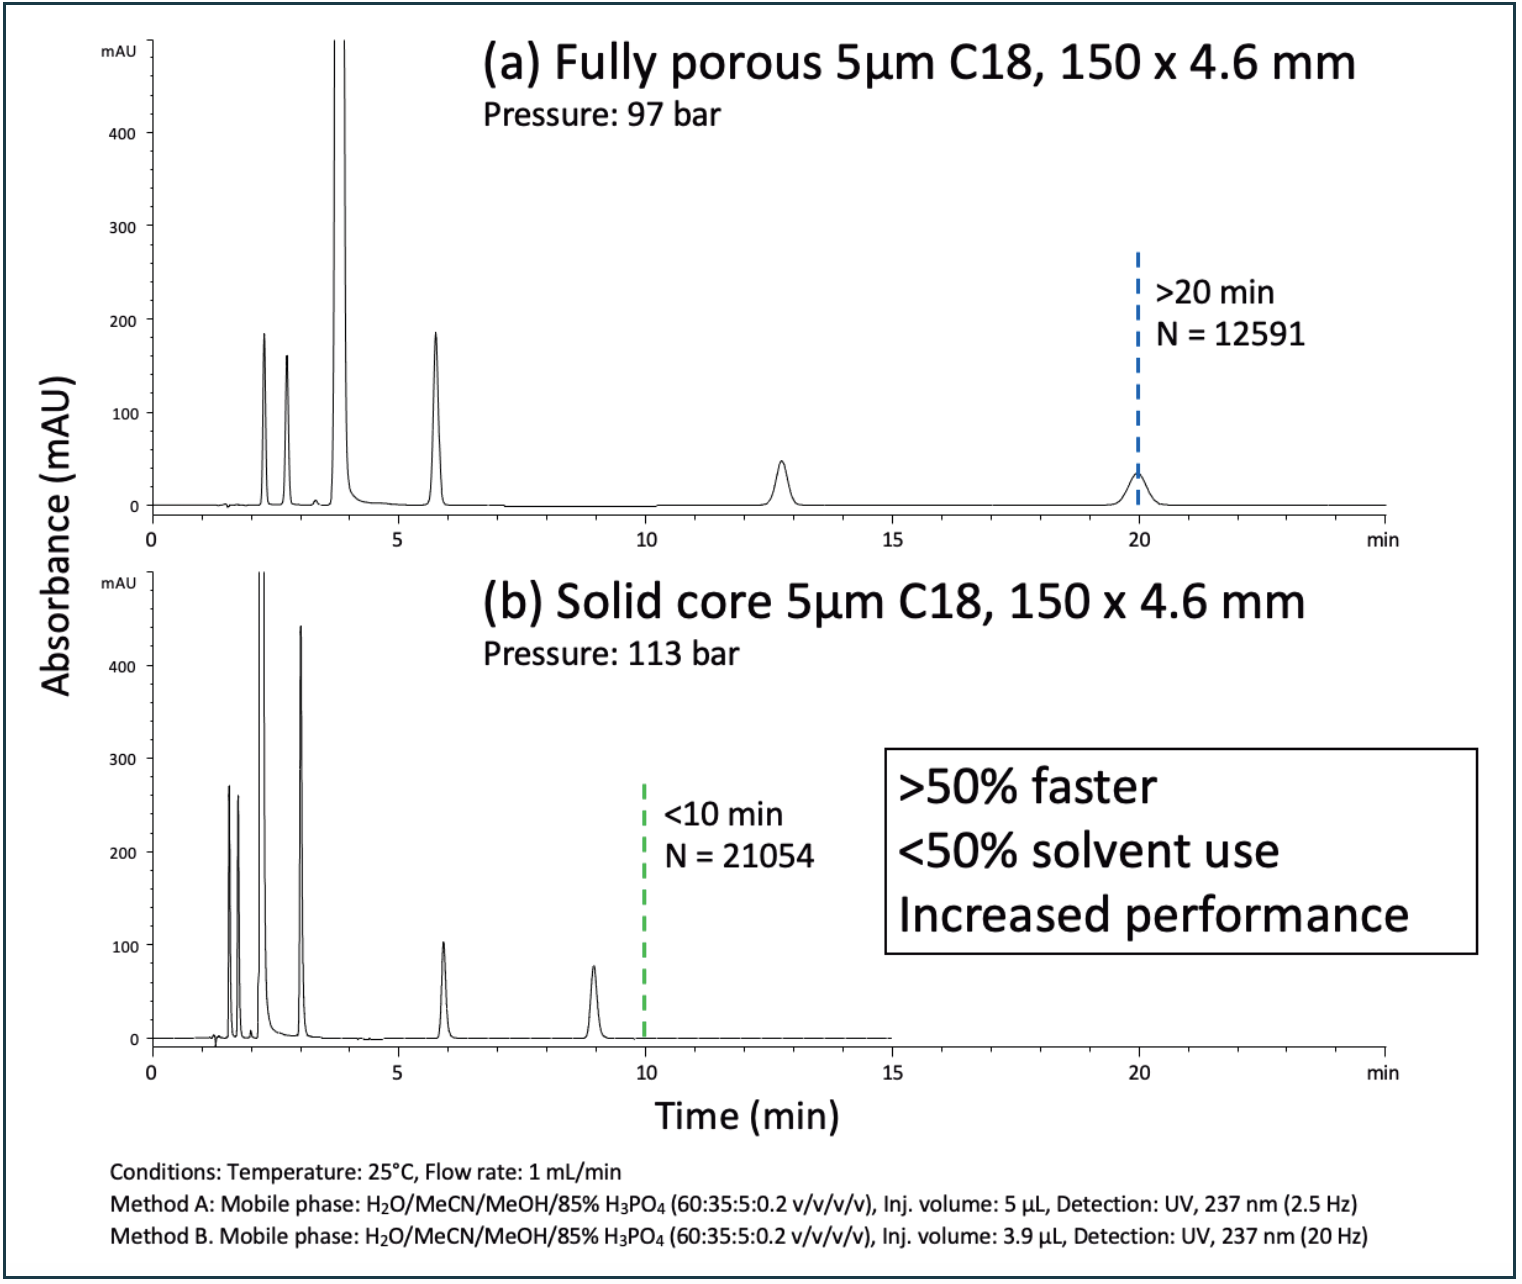
These combined effects are demonstrated in Figure 6, where the fully porous column used for a related substances assay was switched for a solid core equivalent (same particle size and column dimensions). This immediately results in a more efficient separation and a 50% reduction in run time (which would equate to a 50% reduction in solvent use and energy consumption). Note that separation efficiency is almost double that of the original method, and provides improved sensitivity for the impurities, while the back pressure is similar and fully compatible with an HPLC system. In this case, the extra efficiency could be sacrificed by using a shorter column (50 or 75 mm) to further reduce environmental impact.

 fully porous and (b) solid core columns with the same dimensions and particle size.")
FIGURE 6: Separation of aspirin and related substances on (a) fully porous and (b) solid core columns with the same dimensions and particle size.
Modeling Software
LC method development can be a lengthy process which consumes considerable resources in terms of time, physical materials, and energy. Any approaches that can streamline development and reduce waste-generating activities can therefore provide compelling benefits. Retention modeling software can dramatically reduce the number of practical experiments required to develop a method. By modeling analyte retention times for one or more experimental parameters, the need for large numbers of practical experiments can be eliminated, and the associated chemical waste and other environmental impacts are removed. Once a successful separation has been modeled, it can be experimentally verified with just a few injections.
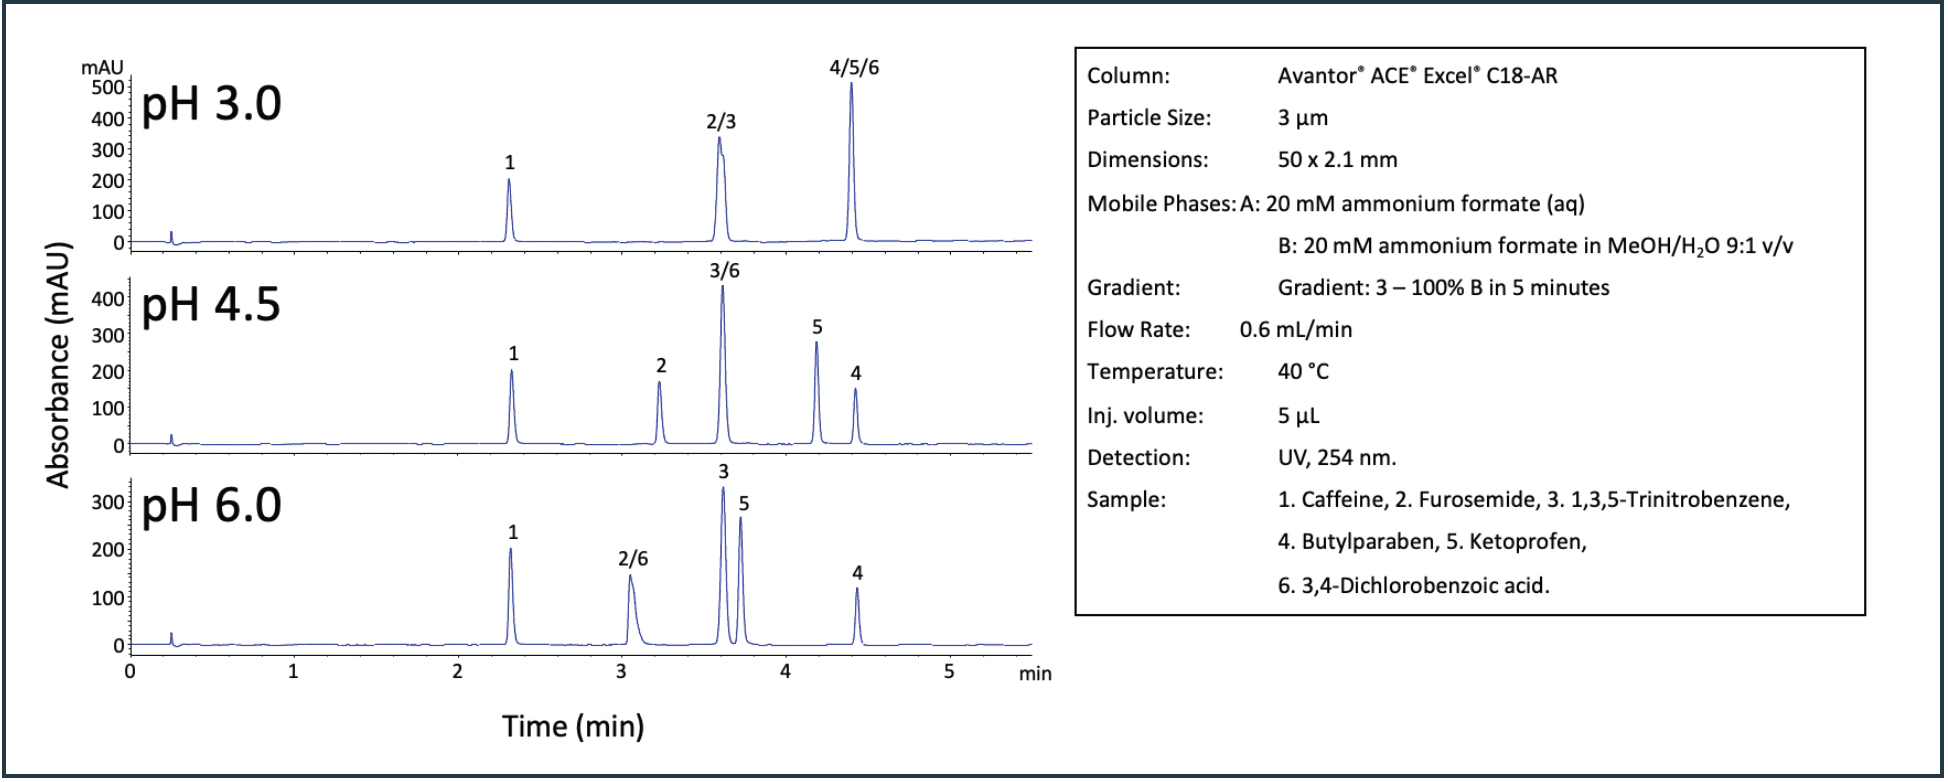
In the example shown in Figure 7, a mixture of six analytes was run at three different pH values (3, 4, 5, and 6). In all three experiments, at least two analytes were coeluted. Even though a successful separation has not been achieved, at this point the work can move away from the laboratory. The experimental data can be entered into a suitable modeling software package and a retention model can be generated (Figure 8a). From this model, an optimum separation can be quickly identified and simulated, thereby saving solvent, eliminating chemical waste and reducing energy consumption (a typical HPLC instrument may require over 5 kWh per day when in use).


FIGURE 7: Separation of a six analyte test mix at pH 3, 4.5, and 6.

 Retention model generated from experimental data in Figure 7 and (b) the corresponding resolution map.")
FIGURE 8: (a) Retention model generated from experimental data in Figure 7 and (b) the corresponding resolution map.
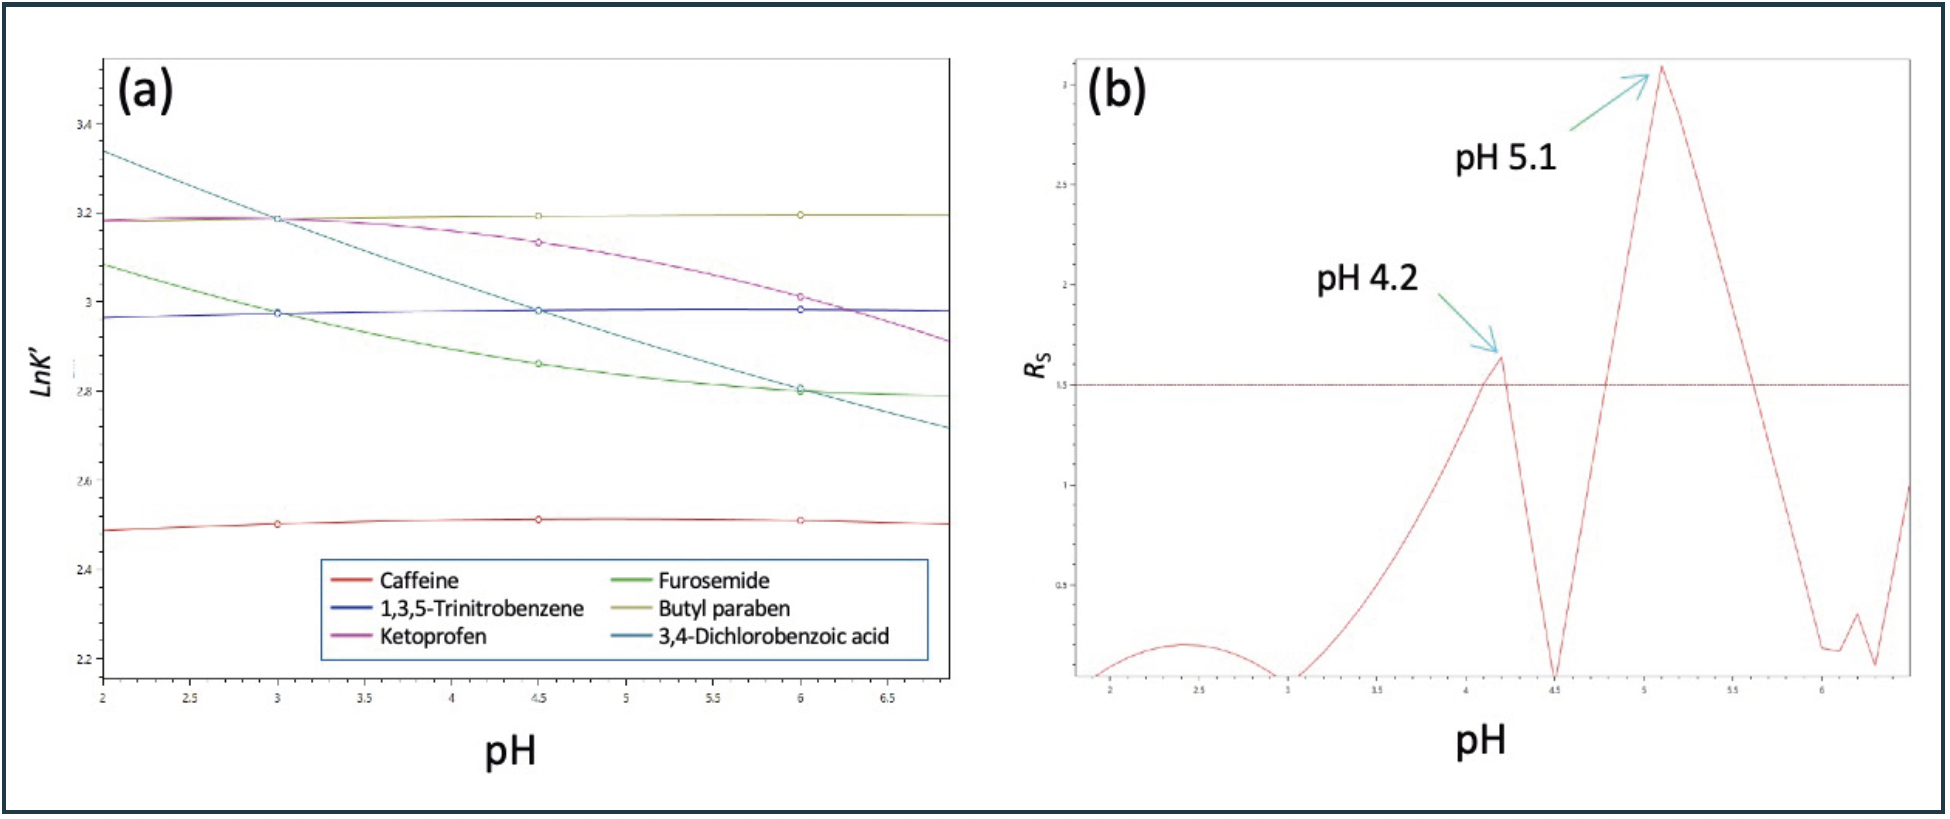
A resolution map, which plots the resolution of the critical pair as a function of pH, is a useful way to view the retention model (Figure 8b). In this case, the minimum acceptable resolution was set to 1.5 (red dotted line), above which an acceptable separation is obtained. Figure 8b clearly shows that a mobile phase pH value of 5.1 will provide the maximum resolution.
Another major advantage of the modeling approach is that it can be used to build robustness into the final method. In Figure 8, an acceptable separation would be obtained at pH 4.2; however, any slight variation in the pH would lead to failure of the method. A trial-and-error approach to method development could lead to the final method being set at this non robust point. The modeling approach reveals that a more robust separation is achieved at pH 5.1. Here, the mobile phase would need to vary by at least ±0.3 pH units to risk method failure, resulting in a much more robust final method.
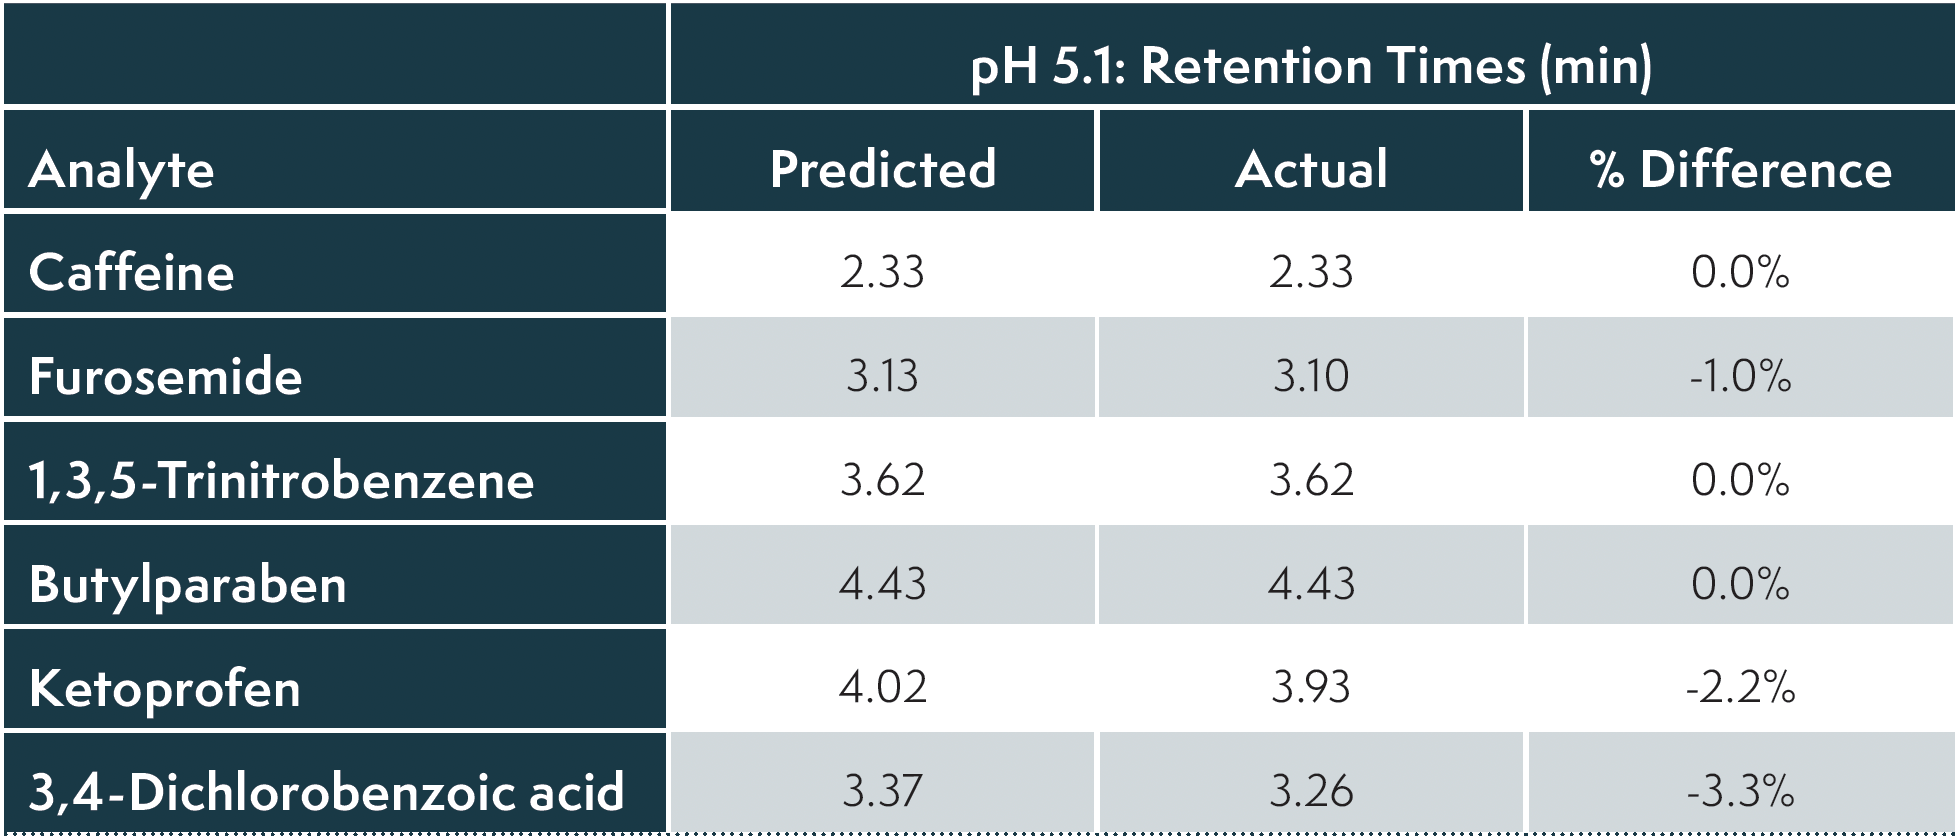
Once the optimal separation conditions have been identified, a single experimental run can then be used to confirm the modelled result. Table III compares the retention times predicted by the modeling software and the experimentally obtained results, demonstrating the high degree of accuracy obtained using retention modeling.

 from the simulated separation generated from a retention modelling experiment and the experimentally obtained retention times.")
TABLE III: Comparison of the predicted retention times (pH 5.1) from the simulated separation generated from a retention modelling experiment and the experimentally obtained retention times.
Conclusions
Developments in the field of chromatography over the past three decades have seen a significant improvement in performance, but, as the focus changes to environmental impact, it can be readily seen that these changes also have a beneficial impact in the environmental footprint. Smaller i.d. columns, smaller particles, and different particle formats all allow for comparable chromatographic performance with reduced environmental impact. If this approach is coupled with careful method development strategies that employ predictive modeling approaches, then truly significant impacts will be seen in chromatography’s contribution to reducing man’s environmental footprint. It should also not be forgotten that the analytical sciences also play a pivotal role in identifying and quantifying the very impact that we are trying to reduce, and perhaps it is here that the biggest contribution to saving our planet will occur.
References
(1) Anastas, P. T.; Warner, J. C. Green Chemistry: Theory and Practice; Oxford University Press, 1998.
(2) My Green Lab. https://www.mygreenlab.org/ (accessed 2024-04-12).
(3) Stoll, D. Essentials of LC Troubleshooting, Part I: Pressure Problems. LCGC North Am. 2021, 39 (12), 572–574.
(4) Alexander, A. J.; Waeghe, T. J.; Himes, K. W.; Tomasella, F. P.; Hooker, T. F. Modifying Conventional High-Performance Liquid Chromatography Systems to Achieve Fast Separations with Fused-Core Columns: A Case Study. J. Chromatogr. A 2021, 1218, 5456–5469. DOI: 10.1016/j.chroma.2011.06.026
(5) Fountain, K. J.; Neue, U. D.; Grumbach, E. S.; Diehl, D. M. Effects of Extra-Column Band Spreading, Liquid Chromatography System Operating Pressure, and Column Temperature on the Performance of Sub-2-μm Porous Particles. J. Chromatogr. A 2009, 1216, 5979–5988. DOI: 10.1016/j.chroma.2009.06.044
(6) Petersson, P.; Euerby, M. R.; James, M. A. Translations Between Differing Liquid Chromatography Formats: Advantages, Principles, and Possible Pitfalls. LCGC Europe 2015, 28, 310–320.
(7) James, M. Achieving Successful Method Translation in Liquid Chromatography. Avantor, 2020. https://uk.cmd.vwr.com/bin/public/idoccdownload/10219758/27673_Hichrom_Method-Translation_White-paper_VWR_PV02_HR.pdf (accessed 2024-04-12).
(8) Avantor ACE Knowledge Zone. Avantor. https://uk.vwr.com/cms/ace_knowledge_zone (accessed 2024-04-12).
(9) Avantor ACE Knowledge Note #0035 “Reducing the LC Column’s Internal Diameter to Drive Sustainable Chromatography.“
(10) Guillarme, D.; Nguyen, D. T. T.; Rudaz, S.; Veuthey, J.- L. Method Transfer for Fast Liquid Chromatography in Pharmaceutical Analysis: Application to Short Columns Packed with Small Particle. Part I: Isocratic Separation. Eur. J. Pharm. Biopharm. 2007, 66, 475–482. DOI: 10.1016/j.ejpb.2006.11.027
(11) Guillarme, D.; Nguyen, D. T. T.; Rudaz, S.; Veuthey, J.-L. Method Transfer for Fast Liquid Chromatography in Pharmaceutical Analysis: Application to Short Columns Packed with Small Particle. Part II: Gradient Experiments. Eur. J. Pharm. Biopharm. 2008, 68, 430–440. DOI: 10.1016/j.ejpb.2007.06.018
(12) USP. Chapter <621> “Chromatography.” https://www.usp.org/sites/default/files/usp/document/harmonization/gen-chapter/harmonization-november-2021-m99380.pdf (accessed 2024-04-12).
(13) Ph. Eur. 11th Edition, General Chapter 2.2.46 “Chromatographic separation techniques”.
(14) Approaches for Reducing the Environmental Impact and Increasing Throughput of LC Separations. https://uk.cmd.vwr.com/rq/iddl/avantorace_knowledgenote_akn0034 (accessed 2024-04-12).
(15) Hayes, R.; Ahmed, A.; Edge, T.; Zhang, H. Core–Shell Particles: Preparation, Fundamentals and Applications in High Performance Liquid Chromatography. J. Chromatogr. A 2014, 1357, 36–52. DOI: 10.1016/j.chroma.2014.05.010
(16) Avantor ACE Ultracore and Solid Core Technology. Avantor. https://eu.cmd.vwr.com/rq/iddl/avantorace_knowledgenote_akn0019 (accessed 2024-04-12).
(17) Avantor Educational Information. https://uk.vwr.com/cms/chromatography_educational_information (accessed 2024-04-12).
(18) Majors, R. E. Method Translation in Liquid Chromatography. LCGC North Am. 2011, 29 (6), 476–484.
ABOUT THE AUTHORS
Matt James is a Senior Research Scientist at Avantor Sciences. Direct correspondence to: matt.james@avantorsciences.com
Tony Edge is an R&D Manager at Avantor, heading a team of specialist scientist in developing next generation stationary phases for HPLCs. Direct correspondence to: anthony.edge@avantorsciences.com
Arianne Soliven’s high profile academic appointments with the eminent Professors Georges Guiochon, Peter Carr, and Andrew Shalliker have amounted to over 15 years of global collaborations with fundamental and applied laboratories and companies.


Carol Robinson Awarded 2024 Lifetime Achievement European Inventor Award
July 24th 2024Carol Robinson of the University of Oxford has received the European Inventor Award 2024 for Lifetime Achievement from the European Patent Office for her work bringing mass spectrometry to structural biology.

Microseparations and Analysis Covered at HPLC 2024
July 23rd 2024At HPLC 2024 in Denver, Colorado, various sessions will be led by experienced scientists, covering different aspects of chromatography techniques and maximizing their effectiveness. Here is some information about tomorrow’s sessions.


