

|Articles|October 1, 2021
- Hot Topics in Mass Spectrometry
- Volume 39
- Issue s10
Mass Spectrometry–Based Process Analytical Technologies for Cell Therapies
Author(s)Ho-Tak Lau, Richard Rogers
Advertisement
Chimeric antigen receptor (CAR) T-cell therapies have demonstrated considerable clinical benefit in treating hematological diseases. Production of consistent CAR T-cell drug products from heterogeneous-starting materials is a key objective of CAR T-process development (PD). To achieve this, PD scientists employ process analytical technologies (PAT) to monitor upstream, downstream, and final product attributes. This article focuses on how the cell therapy field is leveraging mass spectrometry (MS)–based PAT.
Chimeric antigen receptor CAR T-cell (CAR-T) therapy has emerged as a promising treatment option for cancer patients. CAR-T therapy has demonstrated favorable clinical responses even for relapsed patients with poor prognoses (1,2). The manufacturing of the CAR-T drug product is a highly complex process involving the enrichment of T cells from leukapheresis material, the activation of the enriched T cells, the genetic engineering of T cells, the expansion of the engineered T cells, and finally the formulation of the drug product (Figure 1).
One of the goals of CAR-T drug product manufacturing is to optimize the development process to achieve a consistent product quality with each manufacturing batch. However, unlike small molecules and conventional biologic drug products, CAR-Ts are complex living drugs with dynamic cell states and multiple mechanisms of action. The cell therapy field strives to advance our understanding of T-cell biology and develop better analytical methods for characterization, in-process monitoring, and final drug product release. This article discusses the utilities of liquid chromatography–mass spectrometry (LC–MS) for immediate process support and a long-term vision in using LC–MS to better understand the cell therapy drug products.
In-Process Monitoring
During the manufacturing process for a cell therapy drug product, patient or donor cells are genetically engineered and expanded to a predetermined cell density. Various materials could be added during the manufacturing process (such as bovine serum albumin from culture media, antibodies for T-cell activation, and viral vectors for gene editing). These process reagents need to be removed or cleared from the cells before formulation. During the expansion stage, cells will also consume the culture media. It is essential to understand the clearance of process reagents and the consumption of media components. MS is a powerful tool for monitoring these process components.
For media analysis, the Rebel analyzer (908 devices), a specialized mass spectrometer, can monitor 34 analytes including amino acids, biogenic amines, vitamins, and dipeptides. The simple workflow involves diluting the samples, placing the samples in the auto sampler, and then initiating the analysis. Process development teams can operate the system to monitor daily culture conditions with little to no prior MS experience.
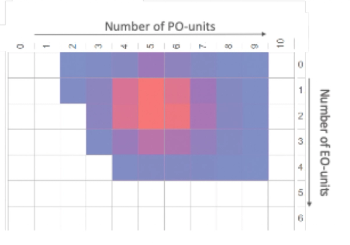
For characterizing and monitoring the clearance of protein-based process residuals, the development of MS-based assays like selection reaction monitoring (SRM), multiple reaction monitoring (MRM), and parallel reaction monitoring (PRM), have the potential to be faster than conventional methods such as enzyme-linked immunosorbent assay (ELISA) (Figure 2). ELISA-like methods require screening of antibodies for compatibility and strategic sourcing of critical reagents to support process development and clinical and commercial programs. Significant effort is consumed for qualifying these reagents and bridging to new reagent lots. Compared to these immunoassays, targeted proteomics allow antibody-free multiplex quantification of target proteins (Figure 2a). Furthermore, additional increases of sensitivity of targeted proteomics can be achieved through optional incorporation of antibody enrichment. The most significant advantage of targeted MS-based assays is that they provide crucial support to process development teams in a timely manner (Figure 2b).
Viral Vector
Delivering gene editing cassettes to CAR-Ts frequently leverages viral vectors, such as gamma-retrovirus (RVV), lentivirus (LVV), and adeno-associated virus (AAV). Immune-based assays are available for rapid titer and purity determinations for these viral vectors. However, LC–MS analytical methods can provide detailed characterization of the protein profile of the viral vectors.
LVV is a subtype of RVV. They are RNA viruses that allow the long-term presence of CAR-T by integrating the genetic material into the host cell genome. However, it is also a concern that integration will cause insertional mutagenesis and changes of gene expression surrounding the insertion site (3–5). These viruses package proteins, such as reverse transcriptase and integrase, allow gene integration. They are also enveloped by the membrane of the production cells. Bottom-up proteomics approaches have demonstrated differences in the ratios between viral proteins (unpublished result) depending on the process. Whether such changes will affect viral titer is yet to be determined.
These approaches can also profile the host cell proteins that are carried through the downstream process and identify post-translational modifications (PTM) associated with the viral vector proteins.
AAV has been gaining more interest in recent years. AAV exists in the host nucleus as an episome, and on the rare occasion, integrates into a known genomic location at chromosome 19 (6,7). However, because the CAR construct is not usually integrated, expression of the CAR receptor eventually stops because of replication dilution. Recent efforts have combined CRISPR and AAV to integrate the CAR cassette to a specific genomic location (8). In AAV, the genetic material is encapsulated by a capsid consisting of three proteins, VP1, VP2, and VP3. Ratios between the three capsid proteins are either 1:1:8 or 1:1:10, depending on the serotype. For characterizing the AAV vector, the ratio between empty (no genetic material) and full vectors can be analyzed using an anion exchange chromatograph (9), and the ratio between the three capsid proteins can be acquired using intact protein mass spectrometry coupled to either reversed-phase LC (RPLC) (9) or capillary electrophoresis (CE) (10). Another advantage of the intact protein MS approach is that the MS data contains the molecular weight for each capsid protein. Finally, bottom-up proteomics have been used to profile the protein post-translational modifications (PTMs) associated with the capsid proteins (11).
Donor Cells, Patient-Derived T-cells, and the Cell Drug Product
So far, we have focused on how MS-based methods can provide support to process development by monitoring impurities, residual clearance, culture condition, and characterizing and quantifying gene editing materials. These methods can readily be integrated in the current process. However, the patient-specific cells are the most heterogeneous raw material in the CAR-T manufacturing process, and our understanding of it, is still very limited.
For the donor cell material, phenotypic information like cell density, cell size, and cell viability can be collected through using automatic cell counters. CD4 and CD8 cells can be further divided into various memory and effector subtypes through cell surface (CD45RO, CD45RA, CD27, etc.) and internal (FOXP3) markers (12) measured using flow cytometric methods. It is known that T cells with more naïve phenotype generate CAR-Ts with better efficacy than more terminally differentiated T cells (13).
The current understanding of naïve T-cell populations, categorized by flow cytometry, may not fully represent the optimal cell surface profile for successful CAR-T manufacturing. In fact, the Cell Surface Protein Atlas (14) has mapped more than 1000 proteins on the surface of T cells. With technological advancement of mass spectrometers, data acquisition algorithms, and data process tools, it is not uncommon to quantify >5000 proteins from a single LC–MS run today. We envision that by studying the donor cell materials, in-process cell materials, and the T-cell drug products, the data may provide us with more insights that could potentially benefit the CAR-T’s manufacturing process.
Conclusion
The autologous CAR-T manufacturing process is complex. This process includes collecting cells from patients, activating the T cells, transducing the T cells, expanding the T cells, and cryopreserving the final drug product. There are many opportunities for in-process monitoring to optimize and control the manufacturing process and ensure a quality final drug product. MS offers a powerful tool to identify and monitor key attributes throughout the CAR-T manufacturing process.
References
(1) C.E. Brown, D. Alizadeh, R. Starr, L. Weng, J.R. Wagner, A. Naranjo, et al., N. Engl. J. Med. 375, 2561–2569 (2016).
(2) S.L. Maude, T.W. Laetsch, J. Buechner, S. Rives, M. Boyer, H. Bittencourt, et al., N. Engl. J. Med. 378, 439–448 (2018).
(3) D. Cesana, M. Ranzani, M. Volpin, C. Bartholomae, C. Duros, A. Artus, et al., Mol. Ther. 22, 774–785 (2014).
(4) U. Modlich, S. Navarro, D. Zychlinski, T. Maetzig, S. Knoess, M.H. Brugman, et al., Mol. Ther. 17, 1919–1928 (2009).
(5) A. Schambach, D. Zychlinski, B. Ehrn- stroem, and C. Baum, Hum. Gene Ther. 24(2), 132–142 (2013).
(6) R.M. Kotin, M. Siniscalco, R.J. Samulski, X. Zhu, L. Hunter, C.A. Laughlin, et al., Proc. Natl. Acad. Sci. USA 87(6), 2211–2115 (1990).
(7) R.J. Samulski, X. Zhu, X. Xiao, J.D. Brook, D.E. Housman, N. Epstein, and L.A. Hunter, EMBO J. 10(12), 3941–3950 (1991).
(8) X. Dai, J.J. Park, Y. Du, H.R. Kim, G. Wang, Y. Errami, and S. Chen, Nat. Methods 16, 247–254 (2019).
(9) S.M. Koza, X. Zhang, H. Yang, and W. Chen, LCGC N. Am. 33(12), 607–613 (2020).
(10) Y. Zhang, Y. Wang, Z. Sosic, L. Zang, S. Bergelson, and W. Zhang, Anal. Biochem. 555, 22–25 (2018).
(11) B. Mary, S. Maurya, S. Arumugam, V. Kumar, and G.R. Jayandharan, FEBS J. 286, 4964–4981 (2019).
(12) V. Golubovskaya and L. Wu, Cancers (Basel). 8(3), 36 (2016).
(13) D. Sommermeyer, M. Hudecek, P.L. Kosasih, T. Gogishvili, D.G. Maloney, C.J. Turtle, and S.R. Riddell, Leukemia 30(2), 492–500 (2016).
(14) D. Bausch-Fluck, A. Hofmann, T. Bock, A.P. Frei, F. Cerciello, A. Jacobs, et al., PLoS One 10, 1–22 (2015).
Ho-Tak Lau and Richard Rogers are with Bristol Myers Squibb. Direct correspondence to:
Articles in this issue
Advertisement
Related Content
Advertisement


Advertisement
Advertisement
Trending on LCGC International
1
GC-MS/MS Links Tooth-Layer Pollutant Traces to Autism Risk
2
Sample Preparation Strategies for PFAS Analysis
3
HPLC Confirms Caffeine Dose to Fight Fatigue
4
AI/ML in Practice: Machine-learning Prediction of Chromatographic Retention Times for Small Molecules in Pharmaceutical Applications
5