

|Articles|March 1, 2011
- Special Issues-03-01-2011
- Volume 9
- Issue 1
Responding to Data Analysis and Evaluation Challenges in Mass Spectrometry–Based Methods for High-Throughput Proteomics
Author(s)Laurence M. Brill
This new data-management method is specifically designed to handle the large amounts of data produced in proteomics studies. Experimental methods and data are presented from a recent study conducting proteomics profiling of Schizosaccharomyces pombe to demonstrate the effectiveness of the data management solution. The results demonstrate enhanced data search speeds as well as effective data analysis.
Advertisement
Mass spectrometry (MS) is central to modern proteomics. It enables the rapid analysis of proteins accurately, with high sensitivity, and, when done carefully, good reproducibility. Recent studies have demonstrated that current advanced mass spectrometers are able to identify and quantify several thousand proteins in a single study (1). However, there are challenges with the technology needed to perform reproducible proteomics studies that have caused it to be treated with some skepticism. These challenges include sample preparation, sample handling, data analysis, and data evaluation. It is the data management element that can be the most demanding, with scientists only recently having access to software platforms with accurate statistical tools fit for the purpose of data management and storage that enable analysis and validation of large data sets produced by advanced MS instrumentation.
By effectively utilizing MS instrumentation coupled with specialized IT infrastructure solutions to manage and validate the data generated in high-throughput proteomics, it is possible to apply this technique to understanding the physiological information encoded in the genome (much of which is proteins). Most functional genomics information is being supplied by large-scale techniques such as mRNA expression profiling, genome-wide RNA interference studies, SNP mapping, and chromatin immunoprecipitation linked with comprehensive sequencing. However, to have an improved understanding of the genomic information, large-scale profiling of cellular, tissue, and organismal proteomes is required.
In a recent publication (2), we reported the deployment of a comprehensive proteomic profiling method for the fission yeast Schizosaccharomyces pombe (S. pombe) using two-dimensional (2D) high performance liquid chromatography (HPLC) with electrospray ionization (ESI) tandem mass spectrometry (MS-MS). S. pombe is a widely used model organism for studies including cell progression, cell division, DNA damage response and repair, stress responses, and mechanisms controlling cell morphology.
The Methods paper featured preparation of total proteins, their digestion, desalting of the resulting peptides, the separation of peptides using strong cation exchange, and analysis using reversed-phase HPLC–MS-MS with an orbital trap mass spectrometer (LTQ Orbitrap XL, Thermo Fisher Scientific, San Jose, California). Full experimental protocols for the total proteome analysis are presented in the paper.
This scale of data generation exceeded the capability of our desktop PCs and required a specialized infrastructure IT solution. Thus, the raw data generated for the Methods paper was searched against an S. pombe protein database using the SORCERER 2.0 appliance (SageN Research, Inc., San Jose, California) and processed, post-search, using the Trans-Proteomic Pipeline (TPP, Institute for Systems Biology, Seattle, Washington).
Experimental
The following experimental protocols for searching the raw MS data and post-search processing for the S. pombe total proteome analysis are reproduced and condensed, by permission (2).
The raw data were searched against an S. pombe protein database (
Post-search analysis was performed via the TPP. The TPP provides open access software for predicting the false discovery rate (FDR) of database searches, and filtering the data on the basis of that FDR at the peptide level (PeptideProphet) and protein level (ProteinProphet). The TPP was accessed from the data management platform, which was customized to carry multiple postprocessing tools. The results of the searches, including probabilities for correct assignments, were viewed using the pepXML Viewer (the interchange format for database search results used in the Institute for Systems Biology TPP) with a focus on peptides, and by using the ProteinProphet protXML Viewer (TPP; Institute for Systems Biology) with a focus on the peptides and proteins that contain these peptides. Both viewers were exported to Excel spreadsheets for archiving and further analysis. To export very large lists of peptides and proteins to Excel spreadsheets, Qtools, which is a collection of computational software tools that we have developed, were used. These tools are available from the authors upon request.
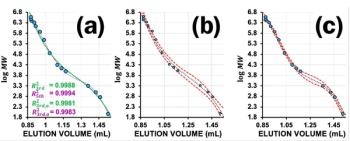
A link is provided by the ProteinProphet ProtXML viewer for viewing graphs that display the predicted sensitivity (fraction of all correct proteins with probabilities greater than or equal to the minimum protein probability) and error (also known as the false discovery rate (FDR), which is the fraction of all proteins with probabilities greater than or equal to the minimum protein probability that are incorrect) as defined by the TPP. Representative results are shown for the analyses of strong-cation-exchange fractions 2 and 7 (Figures 1a and 1b). For strong-cation-exchange fraction 2, modest decreases in sensitivity and decreases in error (FDR) occur as the minimum protein probability increases (Figure 1a). For strong-cation-exchange fraction 7, minimal decreases in sensitivity and minimal decreases in error (FDR) occur as the minimum protein probability increases (Figure 1b). Patterns similar to those in Figure 1a were observed for early and late strong-cation-exchange fractions containing a relatively small number of peptides, potentially because of a relatively high proportion of noisy MS-MS spectra during analysis of the early and late strong-cation-exchange fractions. In contrast, strong-cation-exchange fractions containing relatively large numbers of peptides (the rest of the strong-cation-exchange fractions) typically showed patterns similar to that in Figure 1b. A detailed description of parameters and methods used to calculate peptide and protein probabilities is available (4,5).
Figure 1: Error, sensitivity, and number of proteins are shown for protein identification vs. minimum protein probability, as predicted by ProteinProphet, for the MS-MS data resulting from analysis of a typical sample of the total proteome of S. pombe. (a) Error (e) and sensitivity (s) are shown for injection of 10% of strong-cation-exchange fraction 2 onto reversed-phase media, separated using the reversed-phase gradient, coupled to ESI-MS-MS; (b) the same analysis using strong-cation-exchange fraction 7; (c) the same analysis using the data from strong-cation-exchange fractions 1â24 (all fractions) searched together in a composite search of all the data from the sample; and (d) the ProteinProphet sensitivity/error information shows the protein identification statistics from a database search of the composite dataset (reinjection of strong-cation-exchange fractions 1â24) for the sample as a function of minimum protein probability (min. prob.). The sensitivity of protein identification (s) is the number of proteins identified divided by the total predicted number of correct proteins (3435 for this data set); error (e) is the estimated protein FDR at the given minimum protein probabilities; number correct (Num. corr.) = estimated number of correct protein identifications at the given minimum protein probabilities and number incorrect (Num. incorr.) = estimated number of incorrect protein identifications at the given minimum protein probabilities. At a minimum protein probability of 0.50 (0.50*), the FDR is estimated at 0.020 for this data set. (* = FDR that was accepted for the analysis shown as acceptable accuracy and sensitivity).
The software allowed user specification of the FDR, as implied by Figure 1. The FDR was set deliberately, within a reasonable range. We have seen that values of approximately 0.001–0.05 are often specified, largely depending on the goals of the experiment, and no widely accepted standard FDR seems to exist currently. To obtain high proteome coverage at a relatively low FDR, we accepted protein identifications with an FDR of 0.02 or less in whole proteome profiling studies. To monitor the performance of the 2D-HPLC–MS-MS procedure, the statistics for all of the individual strong-cation-exchange fraction reinjections, at an FDR ≤0.02, were monitored. A representative set of these statistics is shown in Table I. Strong-cation-exchange fractions 1–3, as well as 23–24, yielded a lower number of peptide (and hence protein) identifications, whereas the rest of the strong-cation-exchange fractions had larger numbers of identifications. The peak number of protein identifications was typically observed in strong-cation-exchange fraction 8 (1341 in the example shown in Table I, which is from the same analysis as the results presented in Figure 1). Because most of the strong-cation-exchange fractions yielded a large number of identifications, the strong-cation-exchange gradient was proposed to effectively separate the complex population of peptides from the S. pombe proteome. These results also suggested that the reversed-phase HPLC–MS-MS system effectively identifies large numbers of peptides (and hence proteins).
Table I: Summary of the results of a 2D-HPLCâMS-MS analysis of the S. pombe proteome
The total protein number identified from the sample was obtained from a composite search of the data, which included all 24 strong-cation-exchange fraction reinjections for reversed-phase HPLC–MS-MS analysis, and an FDR of 0.02 or less was also specified (Figures 1c and 1d). In this example, which is typical, 3387 S. pombe proteins were required to explain the peptide identifications at the specified FDR. Because the software groups the peptide data into the minimal number of proteins that were expected to be present, but some of the peptide sequences that were present belong to two or more proteins (6), the analysis also revealed that 4249 of the predicted 5027 protein entries (84.5%) from the S. pombe protein database were identified in this analysis. The sensitivity of this composite analysis was high and the error was low. Although the analysis of the data is ongoing, we estimate that by combining data from four repeat runs of S. pombe protein lysate, we may detect a total of approximately 4600 S. pombe proteins, which corresponds to approximately 92% of the predicted proteome. Because only the vegetative cell state was sampled in our experiments, this result is likely to represent virtually complete proteome coverage. A recent study detected 4399 proteins from Saccharomyces cerevisiae (budding yeast) with high confidence and similarly concluded that this number covered essentially the entire proteome of log phase cells (6).
The data acquired by reversed-phase HPLC–MS-MS also contained quantitative information about protein abundance. For example, spectral counts were the number of times an ionized peptide from an ESI mass spectrum was selected by the mass spectrometer (in a data-dependent fashion) for fragmentation and scanning as an MS-MS scan. Relative numbers of spectral counts for individual proteins (derived from the proteins' peptides) among samples were a semiquantitative estimate of the relative abundance of these proteins (7). Spectral counts were listed in ProteinProphet output, and QTools also were used to compute spectral counts of the proteins from the S. pombe samples using the output. These QTools were Visual Basic macros for automated spectral count analysis, and included assignment of functions of the proteins using the Gene Ontology (
Discussion and Conclusion
Large-scale proteomics analyses require high quality sample preparation and analysis using sophisticated HPLC and MS instrumentation. In this article, an analytical approach featuring an advanced and customizable data management platform was presented. The requirement for specialized infrastructure IT solutions is common in proteomics and genomics studies, and we believe that the method presented here satisfies this need. The data management platform enhanced the speed of data searches and effectively analyzed the data.
By producing a solution to the challenges in data generation, analysis, and evaluation in proteomics studies highlighted by Nilsson and colleagues (1), the skepticism regarding the technology needed to perform reproducible proteomics studies is being overcome. This approach enables many of the questions of cell biology to be answered more quickly, definitively, and in greater depth using MS-based methods, as well as the creation of large-scale proteomic profiling methods such as the one for S. pombe described here.
Laurence M. Brill is with NCI Cancer Center Proteomics Facility, Sanford-Burnham Medical Research Institute, La Jolla, California.
References
(1) T. Nilsson et al., Nature Methods 9, 681–685 (2010).
(2) L. Brill, K. Motmedchaboki, S. Wu, and D.A. Wolf, Methods 48(3), 311–319 (2009).
(3) N.J. Denis, J. Vasilescu, J.P. Lambert, J.C. Smith, and D. Figeys, Proteomics 7, 868–874 (2007).
(4) A. Keller, A.I. Nesvizhskii, E. Kolker, and R. Aebersold, Anal. Chem. 74, 5383–5392 (2002).
(5) A.I. Nesvizhskii, A. Keller, E. Kolker, and R. Aebersold, Anal. Chem. 75, 4646–4658 (2003).
(6) L.M. de Godoy, J.V. Olsen, J. Cox, M.L. Nielsen, N.C. Hubner, F. Frohlich, T.C. Walther, and M. Mann, Nature 455, 1251–4 (2008).
(7) H. Liu, R.G. Sadygov, and J.R. Yates, 3rd Anal Chem 76, 4193–4201 (2004).
(8) H. Choi, D. Fermin, and A.I. Nesvizhskii, Mol. Cell. Proteomics 7, 2373–2385 (2008).
Articles in this issue
over 15 years ago
25-Hydroxyvitamin D2/D3 Analysis in Human Plasma Using LC–MSover 15 years ago
Mass Spectrometry Advances Fossilomicsover 15 years ago
Vol 9 No 1 Current Trends in Mass Spectrometry March 2011 Issue PDFAdvertisement
Related Content
Advertisement


Advertisement
Advertisement
Trending on LCGC International
1
Sample Preparation Strategies for PFAS Analysis
2
HTC-19 Insights: Why develop HPLC—XRF?
3
The PFAS Analyst’s Wish List
4
AI/ML in Practice: Machine-learning Prediction of Chromatographic Retention Times for Small Molecules in Pharmaceutical Applications
5