

Publication|Events|August 8, 2023
- August 2023
- Volume 19
- Issue 8
- Pages: 10–15
Can I Separate These Two Polymers by Gel Permeation Chromatography/Size-Exclusion Chromatography?
Author(s)Wolfgang Radke
Advertisement
To tailor the properties of polymeric materials, different polymers are often mixed. To identify and quantify this blend ratio, the individual components must be separated. As gel permeation chromatography/size-exclusion chromatography (GPC/SEC) is the main technique for the separation of macromolecules, the question often arises if two polymeric materials differing in molar mass can be sufficiently separated by GPC/SEC. This article will offer tips on how to judge the potential success of separating two polymers using GPC/SEC.
Polymeric components are often blended together to optimize application properties. While the mixing ratio of chemically differing components can be obtained using spectroscopic techniques, information on the molar mass distributions of the blend components cannot be assessed spectroscopically. Even more challenging is obtaining the blend ratio of two components that differ in molar mass but consist of the same monomer units. Such blends can be used to tailor a product’s molar mass distribution if the molar mass distribution of a single component does not provide the desired properties.
When separating the peaks of monodisperse substances, a chromatographic resolution of at least R = 1.5 is usually required for reliable quantitation of the components (1). The resolution is defined by the ratio of difference in peak retention time to the average peak width (1).
However, macromolecular samples are usually heterogeneous with respect to molar mass. This means there exists a very large number of species differing in molar mass. Each of these species should in principle provide a peak. However, for high molar mass samples, the small differences in the peaks’ retention times does not allow for their separation. Therefore, a broad peak rather than a series of separated peaks is obtained.
As a consequence, the information that the two samples are of different molar mass is insufficient to predict whether these samples can be separated by gel permeation chromatography/size-exclusion chromatography (GPC/SEC). This is due to the fact that the low molar mass tail of the higher molar mass component might contain identical molar masses to the high molar mass end of the component of lower molar mass.
Therefore, peak width in GPC/SEC—which is still the main separation technique for polymers and macromolecules—is determined by two elements: the width of the sample molar mass distribution, which is related to sample molar mass dispersity, D, and the band broadening contribution of the column or column combination.
If two macromolecular species are to be separated by GPC/SEC, their molar mass difference and the widths of their molar mass distributions dictate whether a separation of the components is possible at all. The peak broadening contribution then impacts on whether the components can be separated in practice.
Therefore, when separating macromolecular mixtures, one should first estimate whether the sample components can be separated in principle. To do so, the difference in molar mass, as well as the width of the molar mass distributions, need to be considered.
How Do Dispersity and Molar Mass Affect Resolution of Macromolecular Blends in GPC/SEC?
In GPC/SEC, the hydrodynamic volume defines the elution volume. If two heterogeneous sample components are to be separated by GPC, the first question that needs to be asked is whether chains of identical hydrodynamic size exist? Information on hydrodynamic size distributions is usually rare. Therefore, we will investigate under what conditions molar mass distributions differ sufficiently enough to allow for their separation. This is justified when comparing samples of identical chemistry and topology. However, the assumption that identical molar masses correspond to identical hydrodynamic sizes is not justified when the components differ in chemical structure or topology. However, as the purpose of this article is to provide reasonable estimates, rather than strict scientific limits, the approximation seems to be justified. Furthermore, it is assumed that the molar mass distributions follow log normal distributions, as characterized by weight average molar masses of Mw,1 and Mw,2 and dispersities D1 and D2, respectively. Again, the assumption of a log normal distribution will suffice for the purpose.
For a log normal distribution, the peak molar mass, MP, and variance, σln, are related to the weight average molar mass, Mw, and sample dispersity, D, by (2):
where once again the index ln refers to a log normal distribution.
Similar to peak resolution in chromatography, the resolution between two molecular weight distributions (MWDs) can be defined as:
which can relate the weight average molar masses and dispersities to yield:
Figure 1 shows the resolution as a function of the ratio of the weight average molar masses and the dispersity of the second component for a fixed dispersity D1 = 1.5 of the first component. Quantitation in chromatography is usually assumed to be possible for R > 1.5, while for R = 1 there is still a significant mutual overlap of the peaks. As can be seen, baseline separation can only be achieved in a very small region. If the dispersity (D2) of the second component exceeds 1.1 (see red points in Figure 1), a full separation can only be realized for Mw,1/Mw,2 > 14.1 (log[M1/M2] > 1.149) or Mw,1/Mw,2 < 0.0514 (log[M1/M2] < -1.289), thus the weight average molar mass of the second component must be at least 14 times higher (or 19 times lower) than that of the first component. To visualize the distribution of such mixtures, Figure 2 shows the distribution of a polymer with Mw,2 = 105 g/mol and D = 1.1 and compares it to the distributions of Mw,1 = 1.4 × 10⁶ or Mw,1 = 5250 g/mol and D = 1.5.
Despite the fact that there is a large difference in weight average molar masses between the broadly and the narrowly distributed samples, any increase in dispersity of the sample with Mw = 105 g/mol would result in insufficient separation.
In Figure 3, the ratio of weight average molar masses required to achieve a baseline resolution (R = 1.5) is plotted as a function of the dispersities of both components.
If one component has a dispersity of 1.2, while the other has a dispersity of 1.5, the higher molar mass component must exceed the lower molar mass by at least a factor of 27, if the higher molar mass component is the one of higher dispersity (point 1 in Figure 3). If, however, the higher molar mass component has the lower dispersity (point 2 in Figure 3), the higher molar mass component must exceed the molar mass by a factor of approximately 22. If both samples have a dispersity of D = 1.6 (point 3 in Figure 3), the weight average molar masses need to differ by more than a factor of 60.
The Impact of Band Broadening on the Separation of Polymer Mixtures
Once it has been established that the two components differ sufficiently enough so that their molar mass distributions do not overlap, it now needs to be determined what GPC/SEC column or column combination is needed to achieve this separation. Of course, the column combination must provide the required separation range. However, all chromatographic systems suffer from band broadening. Even if the molar mass distributions provide a sufficient mass difference for the separation, band broadening effects diminish resolution, meaning that the separation might not be attainable in a real‑life analysis.
A comprehensive analysis of the effect of dispersity and band broadening is beyond the scope of this article. For mixtures of broadly distributed samples, the above estimate on whether a separation is possible at all helps to reduce unnecessary attempts by GPC/SEC.
However, in the case of oligomer separations, some thoughts on the resolution and its dependence on plate count, slope of calibration curve, and molar mass difference between the oligomers may help in the selection of appropriate chromatographic conditions. The resolution, R, of two molar masses, M1 and M2, can be estimated as:
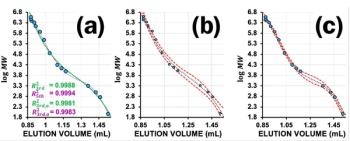
where B = |(logM1 – logM2)⁄ΔV| is the slope of the calibration curve, L is the column length, and Nth is the number of theoretical plates per metre (m-1). The slope of the calibration curve for a column or column combination can be easily obtained from either the column manufacturer’s catalogue or from measurements of the calibration curve (see Figure 4). The number of theoretical plates on the column of interest is easily determined by injecting a monodisperse substance and determining the peak width and elution volume.
To apply equation 5 for a given problem, let us assume that the task involves quantifying the amount of oligomers of three (trimer) or less monomer units in a polymer mixture. The quantification requires a resolution between trimer and tetramer of R > 1.5. For simplicity it is assumed that the repeating unit has a molar mass of 100 g/mol.
The calibration curves in Figure 4 represent the calibration curves of a typical linear, also called a mixed-bed column, in comparison to a single-pore size column with a nominal pore size of 100 Å.
From Figure 4 the slopes of the calibration curves of the mixed-bed and 100 Å column were estimated as 0.53 and 0.41 mL-1, respectively. Trimer and tetramer elute at approximately 7.8 mL, as can be read from the calibration curves. To achieve a resolution of R = 1.5 using a single linear or a single 100 Å column of 30 cm in length requires at least 131,000 m or 78,600 m-1, respectively, as calculated from equation 5. The steeper slope of the linear column requires less band broadening (higher plate counts) due to the smaller volume difference on the mixed-bed column. A larger number of theoretical plates can be obtained when using smaller particles; however, this has an impact on column back pressure.
The very high number of theoretical plates required are rarely provided by typical GPC/SEC columns. If the column does not provide the required number of theoretical plates, a longer column could be applied. Equation 5 helps to estimate the required number of theoretical plates. When doubling the column length (thereby also increasing VP and reducing B by a factor of 2, respectively) to achieve the desired separation, the required numbers of theoretical plates reduced to 65,700 m and 39,300 m-1 for the linear and 100 Å columns, respectively.
While the required number of theoretical plates might not be easily achieved by two linear columns, the targeted separation is easily achievable on a column set of two 100 Å columns. These are better suited for low molar mass separations, due to the lower slope of the calibration curve.
Knowing plate counts and calibration curves of the column under consideration can help to identify whether a separation can be achieved on the column set. This avoids needless experiments, thereby reducing workload, solvent consumption, and instrument wear.
Summary
- Separating two polymers using GPC/SEC does not depend on the column performance alone.
- The equation provided can help to estimate the achievable resolution based on the weight average molar masses and the corresponding dispersities.
- To achieve a resolution of R = 1.5 and to allow for quantitation of two polymer components with a dispersity of 1.5, the weight average molar masses need to differ by approximately a factor of 45.
- The resolution of two monodisperse peaks of a given molar mass depends on a combination of plate count, slope of calibration curve, and column length.
References
(1) Striegel, A.; Yau, W.W.; Kirkland, J.J.; Bly, D.D. Modern Size-Exclusion Liquid Chromatography: Practice of Gel Permeation and Gel Filtration Chromatography; Wiley, 2009. Chapter 4.
(2) Nichetti, D.; Manas-Zloczower, I. Viscosity Model for Polydisperse Polymer Melts. J. Rheol. 1998, 42 (4), 951–969. DOI:
Wolfgang Radke studied polymer chemistry in Mainz, Germany, and Amherst, Massachusetts, USA, and is head of the PSS contract analysis department. PSS is now part of Agilent. Email:
Articles in this issue
almost 3 years ago
Markes International Enters into Agreement with ExtraTechalmost 3 years ago
Rising Stars of Separation Science: Selina Tisleralmost 3 years ago
Analytical Chemistry: There is No Green Like More Greenalmost 3 years ago
Vol 19 No 8 The Column August 2023 Europe & Asia PDFalmost 3 years ago
Vol 19 No 8 The Column August 2023 North American PDFAdvertisement
Related Content
Advertisement


Advertisement
Advertisement
Trending on LCGC International
1
How Should You Respond to FDA 483 Observations?
2
LC-MS/MS Links Vitamin D Levels to Sleep Timing
3
Analytical Procedure Lifecycle Approaches in Accordance With ICH Q14 and ICH Q2(R2): Opportunity Knocks or Just Another Challenge and Headache? (Part 2)
4
HPLC, PTR-ToF-MS Enable AI Grading of White Tea
5