Articles by Veronika R. Meyer

Sampling can be the most demanding part of an analysis. Anybody in charge of sampling needs a good understanding of the composition of the material to be investigated, its heterogeneity (or homogeneity, in simple cases), and the chemical properties of the analytes. Sampling procedures must be described in detail. Detecting the bias of a sampling procedure can be difficult; this fact is trivial, but it must not be forgotten.

How does one meet the most demanding part of an analysis-sampling? A typical example is soil, which presents a twofold problem for the analyst: first, the selection of the sites where the samples are taken, and second, the reduction of a sample (for example, 1 kg) to the analysis aliquot size (for example, 10 μL). This paper describes the details of sampling issues.

Spreadsheet computer simulations can identify the influencing factors for the set-up of a calibration function such as the number of calibration points and their distribution or the position of the experimental points. By using a Monte Carlo approach, the quality of the experimental results (bias and standard deviation) can be studied under different conditions. This article presents a spreadsheet for the simulation of unweighted and weighted linear least-squares fit.

The statistical nature of experiments leads to the fact that standard deviation (SD) of replicate analysis is not constant but a number with some variability: a standard deviation has its own standard deviation. As a consequence, a SD calculated from three experiments is not rugged and even SDs from ten experiments show a great variability. Analysts should be aware that with 100 or more the results have low scatter

Many HPLC analyses could be performed at lower expenditure. This could involve a combination of reducing the analysis time, reducing the resolution between critical peaks, and lowering the consumption of mobile phase. Successfully optimizing the method in such instances - as well as in situations where it is necessary to transfer the method to another laboratory that lacks the same selection of columns - can save the analyst time and money.
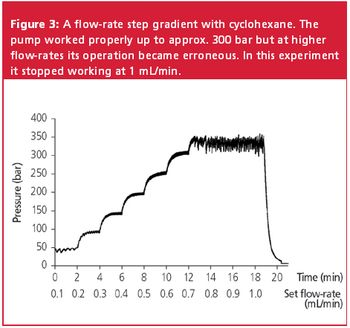
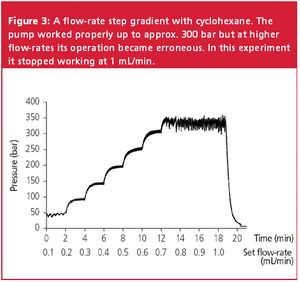
If cyclohexane is mixed with even low amounts of other solvents, the melting pressure increases remarkably.

In this article, the authors look at the contemporary features of a UV detector and the design improvements that have been made over the last 30 years. Recommendations concerning technical details are also given that may influence the choice in purchase.
Guest author Veronika Meyer provides tips for decreasing measurement uncertainty caused by sample preparation.

This installment of "Milestones in Chromatography" looks at two major international meetings held in Las Vegas, Nevada, and Seattle, Washington, that were pivotal in the early development of HPLC.