
|Articles|August 1, 2018
- LCGC Europe-08-01-2018
- Volume 31
- Issue 8
Analyzing Thermoreversible Bonding and Debonding in Macromolecular Systems by Temperature-Dependent Size-Exclusion Chromatography
The potential of TD SEC for in situ analyses of thermoreversibly bonded polymers is discussed. TD SEC allows the evolution of the polymer’s molar mass distribution to be monitored during temperature-sensitive bonding and debonding reactions. Through quantitative evaluation of the chromatograms, the reaction-influencing parameters can be studied, which is crucial for the effective development of novel functional materials. By using TD SEC, the effect of polymer size and flexibility on the debonding temperatures of DA polymers was confirmed, their debonding and bonding ability studied, and the de-crosslinking of thermoreversibly cross-linked DA polymers assessed. TD SEC offers a versatile platform for a broad variety of different polymer materials and to assess a variety of different analytical questions.
Advertisement
The potential of temperature-dependent size-exclusion chromatography (TD SEC) for in situ analyses of thermoreversibly bonded polymers is discussed. TD SEC allows the evolution of the polymer’s molar mass distribution to be monitored during temperature-sensitive bonding and debonding reactions. Through quantitative evaluation of the chromatograms, the reaction-influencing parameters can be studied, which is crucial for the effective development of novel functional materials. By using TD SEC, the effect of polymer size and flexibility on the debonding temperatures of Diels-Alder (DA) polymers was confirmed, their debonding and bonding ability studied, and the de-crosslinking of thermoreversibly cross-linked DA polymers assessed. TD SEC offers a versatile platform for a broad variety of different polymer materials and to assess a variety of different analytical questions.
Polymer materials can be found everywhere in our daily lives. In recent decades, polymeric materials have evolved from simple packaging towards functional and advanced technological materials for highly sophisticated applications, such as drug delivery compounds (1–3), lowâweightâfibreâreinforced materials (4,5), membranes (6–10), responsive materials (11–14), and many more. A particularly attractive class of polymers are dynamic polymers. In contrast to conventional polymers, the repeating units of a dynamic polymer are bonded by reversible bonds of either supramolecular or covalent nature (refer to Figure 1) (15–21) (22). Consequently, the material can be bonded or debonded on demand, making it important for applications such as self-healing materials (23–27), drug delivery compounds (2,28,29), and printable (3,1) or reversibly crossâlinked networks (30–34).
There exists a wide variety of approaches for preparing such dynamic covalent polymers (15,16), and for different applications, specific approaches have to be implemented. This article will focus on polymers based on Diels-Alder (DA) chemistry that renders them thermosensitive in the sense that bonds are generated by a [4+2]-cycloaddition at ambient temperatures and cycloreversion takes place at elevated temperature (that is, higher than 70–100 °C) by the retro DA (rDA) reaction. The DA approach is very versatile and, hence, very frequently used for several types of thermoreversible polymers, often in the field of self-healing (35–40). Regardless of what chemical platform is used, it is critical to comprehensively analyze the polymer systems to evaluate what parameters need to be modified to tailor the materials’ behaviour. The analysis of stimuli responsive dynamic polymers is challenging, not only because of the inherent complexity of the materials, but also because of their responsiveness to changing ambient conditions, such as temperature, solvent, pH, or light irradiation. The analysis must therefore be performed under in situ conditions, indicating that the same conditions are applied that are required for the bonding or debonding events to occur (22). In the case of thermoresponsive polymers, the analysis can be performed in a broad range of temperatures. High temperatures are challenging for the instrumentation, yet are of particular interest for the development of new materials, as in most cases the debonding reactions occur at elevated temperatures. Thus, the conditions required for the debonding step can potentially induce unwanted thermal degradation. As a consequence, the debonding temperature has to be tuned to be sufficiently low, yet still well above the continuous service temperature of the target material.
Frequently used analysis methods are spectroscopic techniques, such as UV–vis (41–43), Fourier-transform infrared spectrometry (FT-IR) (24,44), or nuclear magnetic resonance (NMR) (41,45–48) spectroscopy, which allow changes in concentration of functional groups to be monitored during the bonding and debonding reactions. Despite their high acceptance and frequent use, spectroscopic methods have some disadvantages that are crucial for the effective analysis of thermoreversible polymers. They require that the relevant functional groups lead to well resolved peaks within the spectra sufficiently intense to be integrated for quantitative interpretation. The latter requirement can be particularly difficult to achieve if only polymer end groups are reacting and, thus, the actual reacting functional groups are present in high dilution.
It is therefore critical to explore alternative approaches, namely monitoring the size of the polymers instead of the change in concentration of the functional groups. The size of the polymers is inherently changing with each molecular bonding or debonding event, regardless of what chemistry is used for establishing the dynamic bonding moieties. In addition, it is relatively easy to monitor the size of polymers by different analytical methods that are already employed for studying reversible bonding reactions or temperatureâdependent association phenomena. Methods that exploit mass spectrometry (MS) (49–51) and light scattering (LS) (41,52–54) are of particular value; but this article will focus on size-exclusion chromatography (SEC) in temperature-dependent mode (TD SEC) (55).
Using SEC for monitoring polymer size features is advantageous because SEC can be used more universally than MS (the polymer must only be soluble in a suitable SEC solvent, molar masses up to several million Da can be accessed) and provides more detailed insights into the size or molar mass distributions (MMD) than LS. Furthermore, SEC can be readily performed with different solvents and can operate at elevated temperatures, given that all relevant parts (the autosampler, the column[s], and the detector[s]) are within a temperature controlled oven system. The TD SEC instrument has a temperature-controlled sample compartment, and a sample of the thermoresponsive polymer can be kept under defined temperature conditions in the autosampler. Subsequently, after desired time intervals (for example, 30 or 60 min), samples can be drawn and their MMD can be acquired under identical conditions.
Experimental
The TD SEC experiments were performed using a PL-GPC 220 (Agilent Technologies) high temperature chromatograph system. For detection, the instrument was equipped with a differential refractive index (dRI) detector, a viscometer, and a tailor-made on-line UV–vis spectrometer (Testa Analytical Solutions). 1,2,4-Trichlorobenzen (TCB) with 1 mg/mL butylated hydroxytoluene (BHT), N,N-dimethyl sulfoxide (DMSO) with 1 mg/mL BHT, or N,N-dimethyl acetamide (DMAc) with 3 g/L LiCl were used at a flow rate of 1 mL/min. The separations were performed using a 300 mm × 7.7 mm, 3-µm ResiPore column (Agilent Technologies) or a 300 mm × 8.0 mm, 5-µm ABOA DMAcPhil column (Applichrom).
Studying Debonding Driving Parameters
TD SEC experiments can be performed at varying levels of complexity. The most basic setup only uses dRI detection for the chromatogram acquisition, which allows the MMD to be monitored. During debonding, the MMD will change according to the design of the polymer systems. In Figure 2, the evolution of the MMDs during debonding of two differently designed DA polymers is shown. The DA polymer in Figure 2(a) is composed of two small monomers carrying the diene and dienophile moieties, respectively (56). With increasing rDA time at 80 °C, the peak shifts towards higher elution times (that is, lower molar masses) and the distinct oligomer and monomer peaks appear and their intensity increases. In Figure 2(b), a different DA polymer is analyzed, in which-for the purpose of an industrial application-components of very low molar masses are avoided (57). Specifically, polymeric building blocks are connected by small linker molecules. The chromatograms after different rDA times at 80 °C show that, again, the peak shifts towards lower molar masses but eventually converges with the peak shape of the building block polymer, while only low amounts of small molecules are released.
Deriving quantitative information from the chromatograms regarding the debonding reactions is, unfortunately, non-trivial. The main problem is associated with the chemical heterogeneity of the DA polymer systems, making it virtually impossible to interpret the dRI trace as a simple concentration signal because chemically different components contribute differently to the signal. Consequently, it is not feasible to perform molar mass calculations according to standard calibrations. In our recent studies, we established procedures based on peak deconvolution and calculating fractions of individual components (55,57,58) or simulating and fitting MMDs (56), which proved to yield reliable results. These approaches require some careful considerations when setting up the exact calculation strategies, but robust results could be obtained for all studied systems so far.
Being able to quantitatively follow the progress of the rDA reactions gives important insight into the molecular parameters that drive the debonding reactions. In general, the equilibrium of a chemical reaction can be influenced by controlling the reactions enthalpy or entropy. The enthalpy contributions are represented by the exact chemical constitution of the reacting groups, while the entropy contributions are mostly represented by physicochemical properties, such as size, mass, or flexibility (57,59). In the last few years, comprehensive studies into the impact of entropic effects on the debonding temperatures of DA polymers have been carried out by Barner-Kowollik, Coote, Lederer, and colleagues (57,59). Figure 3 qualitatively shows the effects that can be expected based on ab initio quantum mechanical calculations.
The net entropy gain for the system upon debonding is expected to increase when the size or mass of a released polymer block is increased (that is, a higher degree of polymerization or heavier monomers are used) or if the released polymer block is more flexible. A higher entropy gain makes the debonding more favourable so that at a particular temperature a higher degree of debonding is achieved, or, vice versa, that for a particular degree of debonding a lower temperature is required (57,59).
To assess these entropy effects in real samples, several studies were conducted. At first the rDA reactions of DA polymers with poly(iso-bornyl acrylate) (PiBoA) building blocks of different molar masses were compared. After measuring all samples using TD SEC and calculating the corresponding %BondingDecrease values (for details see reference 59), the predicted effect of polymer size could be confirmed (Figure 4[a]), as in fact the larger polymer building blocks lead to higher %BondingDecrease.
In a second study, a set of DA polymers, in which the polymer building blocks were of identical size and mass but of different flexibility, was investigated. Building blocks of poly(nâbutyl acrylate) (PnBuA), poly(iso-butyl acrylate) (PiBuA), and poly(tert-butyl acrylate) (PtBuA) with a degree of polymerization of 50 were used for preparing the DA polymers. Again, all samples were studied in detail by TD SEC to assess the effect of polymer flexibility on the degree of debonding. As can be seen in Figure 4(b), the expected trend was confirmed experimentally, and the most flexible PnBuA led to the highest degree of debonding. Note, however, that the “stiffness effect” is of smaller magnitude than the “size–mass effect”. Therefore, making a polymer less flexible, larger, or heavier will most likely decrease the debonding temperature because the size effect overcompensates the stiffness effect (57). Both the size and the stiffness effect were readily evidenced by NMR spectroscopy by monitoring the integral intensities of characteristic proton signals. Hence, the TD SEC observed changes in elution volume can be assigned to the rDA reactions, rather than other chain degradation mechanisms (40,41,57,60).
The obtained chromatograms can not only be used for studying the number of bonds that are cleaved (that is, calculating %BondingDecrease), but also for extracting information about where the cleaved bonds were located within the polymer chain. If a polymer chain is cleaved in the middle, the resulting MMD will be different than if the chain was cleaved at a position close to the end. Our experiments indicate that chains are cleaved preferentially in the middle; a consequence of the size effect, which makes debonding reactions that release larger fragments more favourable (61). That effect became evident during the analysis of the rDA reaction of a DA-poly(methyl acrylate) (DA PMA). The DA PMA was prepared by connecting a PMA polymer building block with a low molar mass cyano-dithioesther (CDTE) dilinker (61). When performing the SEC analysis in nonpolar 1,2,4-trichlorobenzene (TCB), the dilinker experiences enthalpic interactions with the column material and this leads to additional retention. In Figure 5(a), the chromatograms of the DA PMA after different rDA times at 90 °C are shown. Comparing the SEC chromatogram of the DA PMA after 0 and 225 min at 90 °C shows a clear shift towards higher elution times. However, the DA PMA after 225 min elutes later than the PMA building block (without any dilinker), although the molar mass of the DA PMA cannot be lower than the molar mass of the PMA building block. In order to test if the additional retention results from a small linker molecule still linked to the PMA, a DA PMA sample was heated for an additional 30 min to 160 °C and then measured again at 90 °C. The corresponding peak was distinctly shifted to lower elution times and started to converge to the peak position and shape of the PMA building block. This experiment shows that at 90 °C the rDA reaction yields only block-linker “dimers” and at substantially higher temperatures the bonds close to the ends of the chains are cleaved in order to release the small linker molecules (Figure 5[b]) (61).
Studying the Reversibility of Bonding and Debonding Reactions
The previous sections focused on evaluating the extent of rDA reactions at elevated temperatures. Another important question of thermoreversibly bonding polymers is, however, if the debonding is actually reversible. The next section focuses on assessing the reversibility of different DA polymer systems by TD SEC, on the example of an amphiphilic diblock copolymer as an example, comprised of a polar and an unpolar building block (58).
Although the debonding reactions can be readily investigated by TD SEC in situ at elevated temperatures, it is not directly possible to study the corresponding bonding reaction at low temperatures at in situ conditions as well. Therefore, it would be necessary to quickly heat and cool the entire TD SEC system, which is neither technically possible nor advisable as it would place all instrument components under very high stress. Therefore, the reversibility of the DA–rDA reactions can be tested only at one moderately high temperature, at which the rDA reaction takes more than 30 min to reach equilibrium. The following general procedure for assessing the DA reversibility is described using only one temperature:
- Measure the DA polymer directly at the elevated temperature; the chromatogram will represent a state of partial debonding.
- After the rDA reaction reaches equilibrium, measure the sample again; the chromatogram will reflect a higher %BondingDecrease than the previously taken sample.
- Place the sample at a lower temperature (outside the instrument) in order to promote the DA reaction, which decreases the %BondingDecrease.
- Repeat steps 1–3 for as many cycles as desired.
A simple way of quantifying the progress of the rDA is to deconvolute the chromatograms and monitor the peak areas of the individual components over multiple DA–rDA cycles. Figure 6 shows the result of the explained procedure for the amphiphilic copolymer at 90 °C. The peak areas of both building blocks and the DA polymer were plotted over multiple DA–rDA cycles. As similar peak areas are obtained the DA–rDA reaction appears to be reversible.
The Chemical Composition Distribution in Focus
Studying polymer systems that comprise multiple components, such as a polymer building block and a linker, is difficult, because besides the MMD, the chemical composition distribution (CCD) also needs to be carefully analyzed. The experiments discussed above were based exclusively on dRI detection, which provides only limited insight into the CCD and requires careful calibrations with appropriate reference samples.
More detailed and reliable information can be gained if an additional UV–vis detector is available. As many polymers do not feature characteristic UV–vis absorptions, most SEC instruments are not equipped with UV–vis detection. In the case of functional polymers, however, it is worth upgrading the SEC system with an online UV–vis detector because the functional groups are likely to be UV–vis active.
Deriving detailed information on the CCD was of particular importance when fragments of reversibly cross-linked DA polymers (a tetra-functional linker connecting four polymer building blocks) were analyzed (32). The cross-linked DA network is inherently insoluble and, thus, not directly accessible for SEC analysis. Therefore, the DA network was thermally de-crosslinked at elevated temperatures within the TD SEC instrument to obtain soluble fragments. The chemical composition of the obtained fragments can be very different, as shown schematically in Figure 7. A fragment with six linker molecules can, theoretically, be connected to at least six polymer building blocks (the blue lines in Figure 7), but also an additional five blocks (green) or even seven blocks (red). Hence, the linker-to-block ratio ranges from 1:1 up to 1:3 in that particular example. Different ratios lead to different detector responses, which makes a detailed assessment of the chemical composition mandatory.
Figure 8 shows the chromatogram of a fragment of the DA PtBuA network, as obtained after heating to 70 °C for 280 min in N,N-dimethylacetamide (DMAc). Both the dRI trace (red) and the UV-absorption trace at 386 nm (black) are shown. Comparing the traces reveals distinct differences, especially at high elution times, that is, low molar masses. In this case the UV-response is substantially stronger than the dRI-response, as the UV-absorption is mainly caused by the Cï½S double bond in the unbound CDTE-tetralinker (41). More detailed information can be derived from the spectra acquired at different times in the chromatogram, as shown in the inset of Figure 8 (62). At low elution times, that is, high molar masses, the spectra show a convolution of two absorptions at 340 and 386 nm, respectively. The first one can be assigned to the DA adduct, while the latter one is due to the free CDTE-moiety in the tetralinker. With increasing retention time the contribution of the 340 nm decreases and the sharp absorption of the Cï½S double bond at 386 nm becomes more and more pronounced, as more free linker functions are produced through the rDA reaction.
According to the measured spectra the chromatogram can be subdivided into different parts in which the chemical composition does not change significantly, as indicated by the differently coloured parts in Figure 8.
Calculating the average chemical composition precisely for each slice of the chromatogram is in principle possible by combining the information gathered by multiple concentration detectors (63). The traces of the dRI detector and of the UV–vis detector that simultaneously collected the absorption signals at two wavelengths (386 and 425 nm) were used. In Figure 9, the collected traces of a DA PtBuA network fragment are shown, together with the calculated content of the tetralinker in the polymer. In the high molar mass region, the linker content appears at a value of 6 to 8 weight-%, which resembles the bulk linker content. At higher elution times the linker content increases, and at 10 min to 11 min only the linker is responsible for the detector signals.
Performing these calculations provides valuable information, but requires a number of reference measurements to be performed to set up all the required detector calibrations and noticeable effort to put all the information together. Hence, if only the “polymer part” at high molar masses is of interest, the procedure can be drastically simplified by assuming a constant linker concentration.
Deriving Conformational Information
An additional layer of information can be gained from the TD SEC measurements by including an on-line viscometer. Measuring the intrinsic viscosities not only allows universal calibration for more reliable molar masses to be applied, but also allows conformational analyses to be conducted. The latter is of particular interest when nonlinear polymers are studied, as in the case of thermoreversible DA polymer networks.
During de-crosslinking of a network, one expects the formation of highly branched fragments in the beginning and less branched polymers at later stages of the de-crosslinking, when presumably the linear precursor polymers are being released (Figure 10[a]). The degree of branching is reflected by the Kuhn-Mark-Houwink (KMH) exponent α, which ranges from 0.3 for highly branched structures to 0.7–0.8 for linear polymers in good solvent conditions (64).
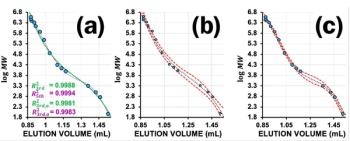
In Figure 10(b) two example chromatograms of DA PtBuA network fragments are shown, obtained after 60 min and 120 min, respectively, at 80 °C in DMAc. The x-axis of the graph shows the molar mass calculated using universal calibration and the calculated viscosities are overlaid as a scattering diagram so that the α parameter can be determined directly from the graph. The obtained α parameters indicate very compact structures in both cases, the fragment after 120 min appearing slightly less compact than the fragment after 60 min at 80 °C.
Calculating viscosities precisely is always a challenging task and becomes particularly difficult if results from different temperatures have to be compared. Working at different temperatures requires very careful and frequent calibration of all detectors to minimize the experimental error. Our experiments show that such conformational studies are possible, yet the required effort is not to be underestimated. The determination of α becomes prone to errors from band broadening and inter-detector delays, particularly in the case of narrow distributions (for example, the 120 min sample in Figure 10[b]) (62).
Supplementary Methods
The previous sections have covered different fields of application for the TD SEC method. However, the analysis of sophisticated materials should never rely on only one particular methodology. The correlation with data obtained from orthogonal techniques is critical for deriving robust and reliable information.
Suitable techniques for corroborating the results obtained from TD SEC are dynamic light scattering (DLS) and NMR spectroscopy. Although DLS essentially delivers the hydrodynamic radius, similarly to SEC (assuming absence of enthalpic interactions), it is based on a completely different analysis concept. Instead of distribution of polymer molecules within the pores of a stationary phase, the free diffusion of polymers in solution is observed by time resolved light scattering. Thus, DLS is insensitive to all phenomena that originate from interactions between polymer and stationary phases. Further advantages of DLS are measurements that can be performed with a very small sample amount (< 100 µL) in a very short time (< 1 min) and high heating and cooling rates for measuring at different temperatures. Performing DLS in a temperature-dependent mode is, therefore, very useful for studying the reversibility of temperature-dependent bonding and debonding reactions (41,58).
NMR spectroscopy, on the other hand, tracks reactions by monitoring the molar concentrations of functional groups and, therefore, proves that the expected reactions actually occur. When performed in temperature-dependent mode, NMR is very valuable for following the bonding and debonding reactions under in situ conditions (41,57,61). However, NMR requires relatively high concentrations of polymers and might lack sensitivity, particularly when the reacting functional groups are present as end groups of rather large polymer building blocks.
Conclusions
TD SEC is a valuable tool for studying thermoreversible bonding reactions as it allows a parameter that always changes during such reactions-the molecules’ size-to be observed. Therefore, a universally applicable methodology is available that can be used for investigations under in situ conditions, enabling the minimization of side effects that could bias the analysis results. Being able to derive quantitative results makes the tool powerful for assessing reaction influencing parameters that can be exploited for fineâtuning the polymer system’s final properties.
To date, the TD SEC concept has been applied to a variety of different DA polymer systems, ranging from small monomers to reversibly linked and even cross-linked polymer building blocks of different chemical compositions. The exact analysis strategy has to be tailored to each particular polymer system, but so far for all polymer systems under investigation suitable methods were developed for reliably following the course of the bonding and debonding reactions.
The TD SEC methodology is still in its infancy and has significant potential for expanding the illustrated concepts. Including interaction chromatography, such as high performance liquid chromatography (HPLC), could be beneficial when the chemical composition distributions are becoming more complex. The highest possible amount of information may be obtained from a two-dimensional experiment that combines both HPLC and SEC (65).
Acknowledgements
A.L. and C.B.K. are thankful for financial support and the outstanding collaboration with Evonik Industries AG. The authors are grateful to N. Guimard, K. Öhlenschläger, and M. Coote for performing synthesis as well as theoretical modelling and fruitful discussions throughout the project. C.B.-K. acknowledges the Australian Research Council for funding in the context of a Laureate Fellowship.
References
- K. Kataoka, A. Harada, and Y. Nagasaki, Adv. Drug Deliv. Rev.47(1), 113–131 (2001).
- E.R. Gillies and J.M.J. Fréchet, Chem. Commun.14, 1640 (2003).
- V.V. Ranade, J. Clin. Pharmacol.30, 10–23 (1990).
- Y. Ohama, Adv. Cem. Based Mater.5(2), 31–40 (1997).
- C.H. Wang, K. Sidhu, T. Yang, J. Zhang, and R. Shanks, Compos. Part A Appl. Sci. Manuf.43(3), 512–518 (2012).
- O. Ikkala and G. ten Brinke, Science (80-.) 295(5564), 2407–2409 (2002).
- E.D. Rodriguez, X. Luo, and P.T. Mather, ACS Appl. Mater. Interfaces3(2), 152–161 (2011).
- L. Haining, X. Yuan, C. Zaisheng, and S. Jie, J. Appl. Polym. Sci.124, 2–8 (2011).
- D. Kowalski, M. Ueda, and T. Ohtsuka, J. Mater. Chem. 20(36), 7630 (2010).
- B.a. Miller-Chou and J.L. Koenig, Prog. Polym. Sci.28(8), 1223–1270 (2003).
- M.A.C. Stuart, W.T.S. Huck, J. Genzer, M. Müller, C. Ober, M. Stamm, G.B. Sukhorukov, I. Szleifer, V.V. Tsukruk, M. Urban, et al., Nat. Mater. 9(2), 101–113 (2010).
- H.B. Lu, Pigment Resin Technol. 42(4), 237–246 (2013).
- M.R. Islam, Z. Lu, X. Li, A.K. Sarker, L. Hu, P. Choi, X. Li, N. Hakobyan, and M.J. Serpe, Anal. Chim. Acta789, 17–32 (2013).
- M. Bajomo, J.H.G. Steinke, and A. Bismarck, J. Phys. Chem. B111, 8655–8662 (2007).
- J.-M. Lehn, Prog. Polym. Sci.30, 814–831 (2005).
- S.J. Rowan, S.J. Cantrill, G.R.L. Cousins, J.K.M. Sanders, and J.F. Stoddart, Angew. Chemie Int. Ed.41(6), 898–952 (2002).
- T. Maeda, H. Otsuka, and A. Takahara, Prog. Polym. Sci. 34(7), 581–604 (2009).
- Y. Jin, C. Yu, R.J. Denman, and W. Zhang, Chem. Soc. Rev. 42(16), 6634–6654 (2013).
- R.J. Wojtecki, M.A. Meador, and S.J. Rowan, Nat. Mater. 10(1), 14–27 (2011).
- W. Knoben, N.A.M. Besseling, L. Bouteiller, and M.A.C. Stuart, Phys. Chem. Chem. Phys.7, 2390–2398 (2005).
- L.M. De Espinosa, G.L. Fiore, C. Weder, E. Johan Foster, and Y.C. Simon, Prog. Polym. Sci. 49–50, 60–78 (2014).
- J. Brandt, K.K. Oehlenschlaeger, F.G. Schmidt, C. Barner-Kowollik, and A. Lederer, Adv. Mater.26(33), 5758–5785 (2014).
- J. Canadell, H. Goossens, and B. Klumperman, Macromolecules 44(8), 2536–2541 (2011).
- Y. Zhang, A.A. Broekhuis, and F. Picchioni, Macromolecules 42(6), 1906–1912 (2009).
- N.K. Guimard, K.K. Oehlenschlaeger, J. Zhou, S. Hilf, F.G. Schmidt, and C. Barner-Kowollik, Macromol. Chem. Phys. 213(2), 131–143 (2012).
- R.P. Wool, Soft Matter 4(3), 400–418 (2008).
- Y. Yang and M.W. Urban, Chem. Soc. Rev. 42, 7446–7467 (2013).
- C. Wang, G. Wang, Z. Wang, and X. Zhang, Chem. Eur. J. 17(12), 3322–3325 (2011).
- H. Lee, W. Wu, J.K. Oh, L. Mueller, G. Sherwood, L. Peteanu, T. Kowalewski, and K. Matyjaszewski, Angew. Chemie Int. Ed.46(14), 2453–2457 (2007).
- C.J. Kloxin, T.F. Scott, B.J. Adzima, and C.N. Bowman, Macromolecules43(6), 2643–2653 (2010).
- F. Liu, F. Li, G. Deng, Y. Chen, B. Zhang, J. Zhang, and C.-Y. Liu, Macromolecules45(3), 1636–1645 (2012).
- K.K. Oehlenschlaeger, J.O. Mueller, J. Brandt, S. Hilf, A. Lederer, M. Wilhelm, R. Graf, M.L. Coote, F.G. Schmidt, and C. Barner-Kowollik, Adv. Mater. 26(21), 3561–3566 (2014).
- S.P. Khor, R.J. Varley, S.Z. Shen, and Q. Yuan, J. Appl. Polym. Sci. 128(6), 3743–3750 (2013).
- B.J. Adzima, C.J. Kloxin, and C.N. Bowman, Adv. Mater.22(25), 2784–2787 (2010).
- M.A. Tasdelen, Polym. Chem.2(10), 2133–2145 (2011).
- R. Pipkorn, W. Waldeck, B. Didinger, M. Koch, G. Mueller, M. Wiessler, and K. Braun, J. Pept. Sci.15(3), 235–241 (2009).
- P. Reutenauer, E. Buhler, P.J. Boul, S.J. Candau, and J.-M. Lehn, Chem. Eur. J.15(8), 1893–1900 (2009).
- A. Sanyal, Macromol. Chem. Phys.211(13), 1417–1425 (2010).
- J. Zhou, N.K. Guimard, A.J. Inglis, M. Namazian, C.Y. Lin, M.L. Coote, E. Spyrou, S. Hilf, F.G. Schmidt, and C. Barner-Kowollik, Polym. Chem.3(3), 628–639 (2012).
- K. Pahnke, N.L. Haworth, J. Brandt, U. Paulmann, C. Richter, F.G. Schmidt, A. Lederer, M.L. Coote, and C. Barner-Kowollik, Polym. Chem.7(19), 3244–3250 (2016).
- K.K. Oehlenschlaeger, N.K. Guimard, J. Brandt, J.O. Mueller, C.Y. Lin, S. Hilf, A. Lederer, M.L. Coote, F.G. Schmidt, and C. BarnerâKowollik, Polym. Chem.4(16), 4348–4355 (2013).
- M. Frenette, C. Aliaga, E. Font-Sanchis, and J.C. Scaiano, Org. Lett. 6(15), 2579–2582 (2004).
- E. Goiti, M.B. Huglin, and J.M. Rego, Macromol. Rapid Commun.24(11), 692–696 (2003).
- A.A. Kavitha and N.K. Singha, ACS Appl. Mater. Interfaces1(7), 1427–1436 (2009).
- J.A. Syrett, G. Mantovani, W.R.S. Barton, D. Price, and D.M. Haddleton, Polym. Chem. 1(1), 102 (2010).
- A. Cappelli, S. Galeazzi, G. Giuliani, M. Anzini, A. Donati, L. Zetta, R. Mendichi, M. Aggravi, G. Giorgi, E. Paccagnini, et al., Macromolecules 40(9), 3005–3014 (2007).
- H. Kawai, T. Umehara, K. Fujiwara, T. Tsuji, and T. Suzuki, Angew. Chemie Int. Ed.45(26), 4281–4286 (2006).
- P.A. Bottomley, T.H. Foster, R.E. Argersinger, and L.M. Pfeifer, Med. Phys.11(4), 425–448 (1984).
- H. Lee, J.H. Jeong, and T.G. Park, J. Control. Release 76(1–2), 183–192 (2001).
- G.W.M. Vandermeulen, C. Tziatzios, and H. Klok, Macromolecules 36(11), 4107–4114 (2003).
- C.B. Minkenberg, L. Florusse, R. Eelkema, G.J.M. Koper, and J.H. van Esch, J. Am. Chem. Soc. 131(32), 11274–11275 (2009).
- W. Polik and W. Burchard, Macromolecules982(10), 978–982 (1983).
- J. Jacob, M.A. Anisimov, J.V. Sengers, V. Dechabo, I.K. Yudin, and R.W. Gammon, Appl. Opt. 40(24), 4160–4169 (2001).
- A. Ritzl, L. Belkoura, and D. Woermann, Phys. Chem. Chem. Phys.1(8), 1947–1955 (1999).
- J. Brandt, N.K. Guimard, C. Barner-Kowollik, F.G. Schmidt, and A. Lederer, Anal. Bioanal. Chem. 405(28), 8981–8993 (2013).
- J. Brandt, N.L. Haworth, F.G. Schmidt, B. Voit, M.L. Coote, C. Barner-Kowollik, and A. Lederer, ACS Macro Lett.5(9), 1023–1028 (2016).
- K. Pahnke, J. Brandt, G. Gryn’ova, P. Lindner, R. Schweins, F.G. Schmidt, A. Lederer, M.L. Coote, and C. Barner-Kowollik, Chem. Sci.6(2), 1061–1074 (2015).
- M. Langer, J. Brandt, A. Lederer, A.S. Goldmann, F.H. Schacher, and C. Barner-Kowollik, Polym. Chem.5(18), 5330–5338 (2014).
- N.K. Guimard, J. Ho, J. Brandt, C.Y. Lin, M. Namazian, J.O. Mueller, K.K. Oehlenschlaeger, S. Hilf, A. Lederer, F.G. Schmidt, et al., Chem. Sci. 4(7), 2752–2759 (2013).
- K. Pahnke, O. Altintas, F.G. Schmidt, and C. Barner-Kowollik, ACS Macro Lett.4(7), 774–777 (2015).
- K. Pahnke, J. Brandt, G. Gryn’ova, C.Y. Lin, O. Altintas, F.G. Schmidt, A. Lederer, M.L. Coote, and C. Barner-Kowollik, Angew. Chemie Int. Ed.55(4), 1514–1518 (2016).
- J. Brandt, J. Lenz, K. Pahnke, F.G. Schmidt, C. Barner-Kowollik, and A.Lederer, Polym. Chem.8(43), 6598–6605 (2017).
- W. Hiller and M. Hehn, Anal. Chem. 86(21), 10900–10908 (2014).
- A.M. Striegel, W.W. Yau, J.J. Kirkland, and D.D. Bly, Modern SizeâExclusion Liquid Chromatography, 2nd ed. (John Wiley & Sons, Hoboken, New Jersey, USA, 2009).
- J. Brandt, Ph.D. dissertation, Technische Universität Dresden, Dresden, Germany (2016).
Josef Brandt is a postdoc at IPF Dresden (Germany).
Johannes Lenz is a PhD student at IPF.
Kai Pahnke is currently a researcher at BASF SE.
Friedrich Georg Schmidt is at Creavis Technologies and Innovation (part of Evonik Industries).
Christopher Barner-Kowollik is a Professor of Soft Matter Materials Science at Queensland University of Technology (QUT) (Australia) and Group Leader at Karlsruhe Institute of Technology (KIT) (Germany).
Albena Lederer is Group Leader Polymer Separation Group at IPF and Extraordinary Professor at Stellenbosch University (South Africa).
Articles in this issue
almost 8 years ago
Vol 31 No 8 LCGC Europe August 2018 Regular Issue PDFalmost 8 years ago
The Vital Role of Blanks in Sample Preparationalmost 8 years ago
Advantages of Supported Liquid Extractionalmost 8 years ago
SFC 2018Advertisement
Related Content
Advertisement


Advertisement
Advertisement
Trending on LCGC International
1
Chromatography's Role in Spotting False Leachables
2
Fast GC-MS/MS Detects PFAS in Food Packaging
3
LC-MS/MS Detects Contaminants in Cat Food
4
HTC-19 Insights. Multidimensional Pyrolysis Gas Chromatography To Investigate Fluoropolymer Degradation
5