

|Articles|May 1, 2017
- LCGC Europe-05-01-2017
- Volume 30
- Issue 5
Combining HIC, SEC, and IEX with Fluorescence Polarization for Drug Target Discovery
Fluorescence polarization (FP) is a highly regarded technique for studying drug–protein interactions, but has limited value regarding protein mixtures. As a novel approach to drug target discovery, the possibility of combining FP with liquid chromatography (LC) was explored. Nondenaturing protein LC principles such as size-exclusion chromatography (SEC), hydrophobic interaction chromatography (HIC), and ion exchange chromatography (IEX) were found to be orthogonal and compatible with FP because the mobile phases used do not negatively affect detection. For simple protein mixtures, the SEC/HIC/IEX–FP approach was able to identify tankyrase as the target of a triazole-based inhibitor of the Wnt signaling pathway, which is heavily associated with colon cancer. However, the total peak capacity of the three LC dimensions was not sufficient to resolve at cell-proteome level, calling for higher resolution of intact proteins to enable stand-alone drug target discovery with LC and FP.
Advertisement
Tore Vehus1, Jo Waaler2, Stefan Krauss2, Elsa Lundanes1, and Steven Ray Wilson1, 1Department of Chemistry, University of Oslo, Blindern, Oslo, Norway, 2Unit for Cell Signaling, Oslo University Hospital, Rikshospitalet, Oslo, Norway
Fluorescence polarization (FP) is a highly regarded technique for studying drug–protein interactions, but has limited value regarding protein mixtures. As a novel approach to drug target discovery, the possibility of combining FP with liquid chromatography (LC) was explored. Nondenaturing protein LC principles such as size-exclusion chromatography (SEC), hydrophobic interaction chromatography (HIC), and ion exchange chromatography (IEX) were found to be orthogonal and compatible with FP because the mobile phases used do not negatively affect detection. For simple protein mixtures, the SEC/HIC/IEX–FP approach was able to identify tankyrase as the target of a triazole-based inhibitor of the Wnt signaling pathway, which is heavily associated with colon cancer. However, the total peak capacity of the three LC dimensions was not sufficient to resolve at cell-proteome level, calling for higher resolution of intact proteins to enable stand-alone drug target discovery with LC and FP.
Drug discovery is essential to combat disease. There are two main strategies: one is where the target is known (target based), and the second is phenotype-based drug discovery (1). The latter variant faces the daunting task of identifying the target of a prototype drug (drug deconvolution). This key piece of information allows the mode of action of the drug to be identified. A central bottleneck of drug deconvolution is the techniques available (2,3). Approaches to drug deconvolution include affinity chromatography, drug affinity responsive target stability (DARTS), target identification by chromatographic coelution (4) (TICC), and stability of proteins from rates of oxidation (SPROX) (5) (the mentioned approaches are extensively reviewed in references 3 and 6). However, drug deconvolution is far from mature, and alternative or complementary procedures can ease the process. One approach can be to combine chromatography with detectors that specifically measure drug–protein binding. There are a number of approaches that are suited for this purpose, for example, isothermal titration calorimetry (ITC) (7), surface plasmon resonance (SPR) (8), nuclear magnetic resonance (NMR) spectroscopy (9), microscale thermophoresis (MST) (10), and fluorescence polarization (FP) (11). Of these, FP is arguably the simplest, and is quite inexpensive.
FP measurements are based on rotational differences between an unbound and bound fluorescent (FLU)âtagged molecule, and can be briefly explained as follows: a drug rotates freely and rapidly in a solution, but rotates slower when bound to a much larger protein; the FP instrument can detect this rotational difference and hence a binding. Parameters that can affect the performance of FP measurements include fluorescence intensity, sample viscosity, and quenching of drug fluorescence. For more details on the technique, see Figure 1 and references 12, 13, and 14. Although FP is frequently used for measuring binding strength and kinetics (15), it has not been used in drug deconvolution with biosamples because it has limitations regarding mixtures. FP should in principle detect a drug-binding in a protein mixture, but cannot tell which protein is involved. Therefore, we wanted to test the approach of chromatographically resolving proteins in a mixture before FP measurements. FP has previously been described as a detection device with capillary electrophoresis (CE) techniques (16–18), but not with liquid chromatography (LC) (to our knowledge). We examined a number of chromatographic principles (size-exclusion chromatography [SEC], hydrophobic interaction chromatography [HIC], and ion exchange chromatography [IEX]) that are suited for separating proteins without perturbing their biological activity and could be combined with FP. We evaluated LC and FP with two FLU-tagged drugs that antagonize the Wnt pathway (“161-FLU” and “XAV-FLU”, see Figure 2[a and b] and Figure 3), a signaling cascade system strongly associated with, for example, colon cancer, and a current focus in drug discovery (19,20). Emphasis was placed on evaluating the orthogonality of the three separation principles (crucial for multidimensional separations prior to FP), optimizing the peak capacity of the LC principles, and ensuring that LC and FP are compatible.
Experimental
Chemicals: Type 1 water (resistivity [MΩ•cm @ 25 °C] >18.0) was from a Milli-Q ultrapure water purification system (Millipore). 10K cut-off 500 µL, 2 mL, or 5 mL ultracentrifugation filters were also from Millipore. 2-(N-morpholino)ethanesulfonic acid (MES), L-arginine, ribonuclease B (rib B), γ-globulin, holo-transferrin, lysozyme, cytochrome C, bovine serum albumin (BSA), myoglobin, carbonic anhydrase, α-chymotrypsinogen, trypsinogen, Fluorescein-5-EX N-hydroxysuccinimide ester (NHS-FLU), sodium phosphate, and ammonium sulfate were from Sigma-Aldrich. Hemoglobin and NaCl were from Merck. The SW480 cell line, Leibowitz’s L-15 medium were from ATCC. Fetal bovine serum (FBS), Penicillin streptomycin (Pen Strep, PS) (Invitrogen), and trypsin ethylene diamine tetraacetic acid (T-EDTA) were acquired from Gibco, Invitrogen. Native cell lysis buffer was from Cell Signaling Technology and phenylmethylsulfonyl fluoride (PMSF) from Nigu Chemie GmbH. Compounds OD139, OD198, and G007-LK was acquired from Prof. Stefan Krauss’s laboratory.
Preparation of Solutions and Samples: Protein standard mixtures containing different combinations of rib B, γ-globulin, holo-transferrin, lysozyme, cytochrome C, BSA, myoglobin, hemoglobin, carbonic anhydrase, α-chymotrypsinogen, trypsinogen, and TNKS2a were prepared in appropriate mobile phases. Samples containing TNKS2a and other standard proteins are hereafter referred to as TP.
Compound 161 (Figure 2[a] and [b]) was based on the JW74-molecule (21), where an amine functionalized polyethylene glycol was added. Labelling of 161 with FLU was done according to the NHS-FLU manufacturer’s protocol, and preparation of TNKS2a according to (22).
Cell Culturing: The SW480 wild type cell line was cultured in Leibowitz’s L-15 medium containing 10% (v/v) FBS and 1% (v/v) PS. To detach cells, T-EDTA was used. Cells were harvested when they were ~90% confluent. Prior to cell lysis, cells were counted using a hemocytometer. Lysis of cells was performed by adding 400 µL cell lysis buffer per 107 cells with 50 mM PMSF. Tubes were immersed in a sonication bath at 4 °C for 1 min × 5 with a 20 s delay between sonications. Cell debris was removed with centrifugation at 13000 × g for 10 min and supernatant was transferred to eppendorf tubes. Cell lysates were snap-frozen in liquid nitrogen, and stored at -80 °C until use.
Liquid Chromatography: All protein LC experiments were performed with a PerkinElmer Series 200 pump and autosampler. UV absorption was measured at 280 nm with a SPD-10AV UV detector (Shimadzu). Column temperature was regulated with a Mistral-column oven (Spark Holland) or a PerkinElmer Series 200 Peltier column oven. Fraction collection was done with a Gilson FC204 fraction collector.
IEX separations were performed on a 4.6 × 200 mm PolyCATWAX mixed-bed ion-exchange column (PolyLC Inc.) temperature regulated to 20 °C with an injection volume of 100 μL. The column temperature was set to 4 °C. Mobile phase A (MP A) contained 20 mM MES and mobile phase B (MP B) contained 20 mM MES and 0.8 M NaCl. For most separations the elution (at 1 mL/min) started at 10% B for 10 min, then linear gradient increased to 52.5% B in 20 min and held for 2 min at 100% B. Equilibration was done for 30 min at 10% B between analyses.
HIC separations were performed on a 4.6 × 100 mm ProPac HIC-10 column from Dionex (Thermo Fisher Scientific). The column temperature was 20 °C. Injection volume was 100 μL. MP A contained 2 M ammonium sulfate, 0.05 M sodium phoshate pH regulated to 7.0, and MP B contained 0.05 M sodium phoshate pH = 7.0. Most gradients started at 0% B for 2 min with a linear gradient elution to 75% B in 18 min and a hold for 3 min at 100% B. Equilibration was done for 30 min at 0% B between analyses.
SEC separations were performed with a 4.6 × 35 mm TSKgel-SuperSW guard column (Tosoh Corp.) coupled in-line with a 4.6 × 300 mm TSKgel SuperSW3000 SEC column (Tosoh Corp.). Separations were done isocratically with a flow rate of 0.35 mL/min and a mobile phase containing 0.05 M sodium phosphate and 0.3 M NaCl pH adjusted to 7.0 or 0.05 M sodium phosphate and 0.3 M L-Arginine pH adjusted to 7.0.
The durations of fraction collections are shown in figure legends and varied for each separation principle and sample type. After fraction collection, the fractions were (when needed) concentrated with cut-off filters of various sizes.
Fluorescence Polarization: Fluorescence polarization detection was performed with a Tecan F200 Pro (Tecan Group Ltd.) using either 96- or 384-well plates (Flat black polysterol, Greiner Bio One GmbH). For fluoresceinâlabeled compounds, excitation was performed at 485 ± 20 nm and emission measured at 535 ± 25 nm with cut-off filters. The number of flashes was set to 25 and emitted light was integrated for 40 µs. The settle time before measurements was 60 ms. Four wells with water were used as instrument blanks. Aliquots of 200 µL of the chromatographic fractions solution
were added to the 96-well plates, and 30 µL to the 384âwell plates.
LC–MS/MS: LC–tandem mass spectrometry (LC–MS/MS) experiments were performed as described in reference 23.
Results and Discussion
FP as a Tool for Detecting Drug–Protein Interaction: As a model for this initial investigation, we chose to use FLU-tagged tankyrase inhibitors. Inhibition of tankyrase allows axin proteins to engage in a so-called destruction complex that degrades beta catenin for moderation of Wnt signaling (Figure 3). TNKS2a (recombinant, binding part of tankyrase) and ribonuclease B (non-binding) were added to 161-FLU. For the TNKS2a–161-FLU solution, the FP signal increased approximately 3.5 times, whereas with the non-binding protein added, the signal did not significantly increase (Figure 4). An additional step for verifying a drug–protein interaction “FP event” is to add a competing, nonâfluorescent drug, which will reduce the FP signal as a result of the unbinding of the FLU-tagged drug; this was observed when adding G007-LK (22) (see Supplementary Figure 1; supplementary information can be found at http://www.chromatographyonline.com/supplementary-information-combining-hic-sec-and-iex-fluorescence-polarization-drug-target-discovery), also performed in subsequent experiments. Hence, FP was suited for assessing binding between TNKS2a–161-FLU.
Sensitivity: An approach to detect drug–protein interactions must be sensitive because biotargets may be present in minute amounts. Varying amounts of TNKS2a were added to 2 pmoles 161-FLU (Figure 5). It was found that the addition of 4 times more moles TNKS2a compared to the drug gave a significant change in FP value, thus indicating that the mass limit of detection (mLOD) in this example was about 8 pmoles; this sensitivity of the TNKS2a–161-FLU FP experiment was considered satisfactory.
Binding in Complex Samples: To confirm that FP could detect a binding protein in a complex sample such as a cell lysate (but not tell which protein is binding), an FP assay with 161-FLU in SW480 cell lysate (contains human tankyrase-2) with and without TNKS2a was performed. Indeed, the FP value increased when a whole cell lysate was added to 161-FLU, implying that one or more proteins present in the sample binds to 161âFLU (Figure 6). It is very likely that this is at least partly a result of tankyrase binding, because this drug variant is highly selective (21). When the cell lysate was spiked with TNKS2a, the FP signal increased further, implying that the drug was initially present at higher mole ratios compared to the target protein. We concluded that FP experiments can function for complex samples, in that a binding can also be detected in the presence of nonâbinding proteins.
FP Measurement Robustness in Common Solvents for Protein LC: To pinpoint which protein in a complex mixture is causing an FP-event with a drug, they must be separated prior to measurement. To maintain the tertiary structure of proteins (typically necessary for interaction with a drug), nondenaturing chromatographic conditions must be used. This is achievable with HIC, SEC, and IEX. Substantial amounts of salts are present in the mobile phase used for these principles, often varying in composition during a solvent gradient. It was feared that FP signals could be affected by varying salt amounts, because this could affect viscoscity. However, FP-events were largely unaffected by the mobile phases of HIC, SEC, and IEX (Supplementary Figure 2). Hence, mobile phases of common nondenaturing protein LC principles were quite compatible with FP.
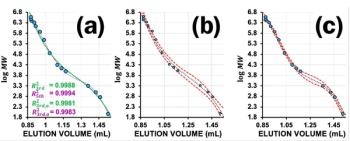
Estimating the Orthogonality of HIC, IEX, and SEC: Cell lysates constitute a typical matrix for drug deconvolution. However, a single LC separation will not be able to separate all proteins in a biological sample, which contains thousands of different proteins. Hence, a multidimensional approach is called for, which dramatically increases the resolution if the dimensions have a degree of orthogonality (24). The orthogonality of HIC, IEX, and SEC for protein separation was therefore evaluated. Model proteins chosen featured a range of isoelectric points (pI) and molar masses (MM). An orthogonality plot (Figure 7) shows an obvious deviation from linearity in normalized retention times, indicating that the separation principles are indeed highly orthogonal. Hence, HIC, IEX, and SEC were suited for multidimensional LC separation of proteins for FP measurements.
HIC/IEX/SEC–FP with a Simple Protein Mixture: A protein mixture was chromatographed in parallel on HIC/IEX/SEC, and fractions were mixed with 161-FLU and FP-measured (Figure 8[a–f]). FP-event fractions were digested with trypsin and a peptide separation and identification was performed with LC–MS/MS, confirming the presence of TNKS2a in all the FP-event fractions. None of the other proteins were identified in all FP-event fractions (Supplementary Figure 3), and this was in accordance with the known retention times of the proteins in the various dimensions. Hence, a simple proof of concept for identifying a drug target in a mixture, using multidimensional LC and FP, was demonstrated.
Peak Capacities: The previous experiment showed that HIC/IEX/SEC–FP could be used to pinpoint drugâbinding proteins in simple mixtures. At this stage, the system can be functional, for example, as a step following protein pullâdown with immobilized drug columns (25). We wanted, however, to assess the potential for an LC and FP-only approach to drug deconvolution of very complex samples. For maximum resolution, peak capacity was optimized. Regarding IEX, the peak capacity of a 180âmin long ammonium acetate gradient with the conditions described was approximately 35 (Supplementary Figure 4). In HIC, the peak capacity was about 20 (with a 20-min long gradient, and did not substantially increase with longer gradients) for the 200-mm long column when applying a decreasing ammonium sulfate gradient (Supplementary Figure 5). The peak capacity for SEC was estimated to be 5 with phosphate buffer and sodium chloride in the MP (Supplementary Figure 6) (in later experiments NaCl was exchanged with L-arginine to increase recovery from SEC, but this did not affect the peak capacity significantly [data not shown]). Combining the maximum peak capacity from each column with a generously estimated orthogonality of 0.9, the overall peak capacity of the system was 20 × 35 × 0.9 × 5 × 0.9 = 2835. This number is well below the number of proteins in a biological samples (which can be on the ten thousand-scale), and an additional separation and isolation step seems to be necessary, or further peak capacity enhancements. The approach was, however, investigated on protein extract from cells, which provided a strong FP-event signal in fraction number 2 for SEC–FP (Figure 9).
Conclusions
As a novel approach to drug deconvolution, FP has been shown to be compatible with nondenaturing liquid chromatography. HIC, SEC, and IEX provided orthogonal separation prior to FP measurements, allowing for drug targets to be pinpointed in a mixture. For the technique to be a completely stand-alone technique for very complex
cell samples, the total peak capacity of protein chromatography must be strengthened; the development and application of higher resolving columns than those used here are key. If this level is reached, the technique can have potential for drug target discovery for (fluorescent) compounds, even without the need for immobilizationâbased approaches.
References
- G.C. Terstappen, C. Schlupen, R. Raggiaschi, and G. Gaviraghi, Nature Review Drug Discovery6, 891–903 (2007).
- E. Tashiro and I. Imoto, Bioorganic & Medicinal Chemistry20, 1910–1921 (2012).
- J.N.Y. Chan, C. Nislow, and A. Emili, Trends in Pharmacological Sciences31, 82–88 (2010).
- J.N.Y. Chan et al., Molecular & Cellular Proteomics11(7), M111.016642 (2012).
- G.M. West, L. Tang, and M.C. Fitzgerald, Analytical Chemistry80, 4175–4185 (2008).
- J. Lee and M. Bogyo, Current Opinion in Chemical Biology17, 118–126 (2013).
- R. Ghai, R.J. Falconer, and B.M. Collins, Journal of Molecular Recognition25, 32–52 (2012).
- J.A. Maynard et al., Biotechnology Journal 4, 1542–1558 (2009).
- A.L. Skinner and J.S. Laurence, Journal of Pharmaceutical Sciences97, 4670–4695 (2008).
- S. Patnaik et al., Journal of Medicinal Chemistry55, 5734–5748 (2012).
- F. Perrin, Journal de Physique et le Radium7, 390–401 (1926).
- A.M. Rossi and C.W. Taylor, Nature Protocols6, 365–387 (2011).
- W.A. Lea and A. Simeonov, Expert opinion on drug discovery6, 17–32 (2011).
- N.J. Moerke, Current Protocols in Chemical Biology1(1), 1–15 (2009).
- T.G. Dewey, Ed., Biophysical and Biochemical Aspects of Fluorescence Spectroscopy (Springer, 1991).
- Q.-H. Wan and X.C. Le, Analytical Chemistry 72, 5583–5589 (2000).
- E. Ban and E.J. Song, Journal of Chromatography B929, 180–186 (2013).
- L. Ye, X.C. Le, J.Z. Xing, M. Ma, and R. Yatscoff, Journal of Chromatography B: Biomedical Sciences and Applications 714, 59–67 (1998).
- J.N. Anastas and R.T. Moon, Nature Reviews Cancer13, 11–26 (2013).
- B.T. MacDonald, K. Tamai, and X. He, Developmental cell 17, 9–26 (2009).
- J. Waaler et al., Cancer Research 71, 197–205 (2011).
- A. Voronkov et al., Journal of Medicinal Chemistry56, 3012–3023 (2013).
- M. Rogeberg, S.R. Wilson, H. Malerod, E. Lundanes, N. Tanaka, and T. Greibrokk, Journal of Chromatography A 1218, 7281–7288 (2011).
- M. Gilar, P. Olivova, A.E. Daly, and J.C. Gebler, Analytical Chemistry77, 6426–6434 (2005).
- S. Sato, A. Murata, T. Shirakawa, and M. Uesugi, Chem. Biol.17, 616–623 (2010).
Tore Vehus is an Assistant Professor at Department of Engineering Sciences, University of Agder, Norway. He graduated with a M.Sc. in analytical chemistry from University of Oslo (UiO) in 2012 and is currently finishing a Ph.D. under Ass. Prof. Steven R. Wilson at UiO. His work is currently focused on the development of instrumentation and chromatographic columns for fitâforâall analyses of complex biological samples.
Jo Waaler is a Researcher at Oslo University Hospital.
Stefan Krauss is a Professor at Oslo University Hospital.
Elsa Lundanes is a Professor at the Department of Chemistry at the University of Oslo.
Steven Ray Wilson is an Associate Professor at the Department of Chemistry, University of Oslo. Research interests have included miniaturization, multidimensional separations, and on-line hyphenatations with MS and NMR. Application fields are in cancer research (diagnostics and drug discovery) and neuroscience.
Articles in this issue
over 9 years ago
(U)HPLC: The Shape of Things To Comeover 9 years ago
The Role of LC–MS in Lipidomicsover 9 years ago
Contemporary Trends in Biopharmaceutical Analysisover 9 years ago
Advances in Glycomics in Biology and Medicineover 9 years ago
The Rising Profile of Comprehensive 2D LCover 9 years ago
New Gas Chromatography Products for 2016–2017Advertisement
Related Content
Advertisement


Advertisement
Advertisement
Trending on LCGC International
1
HPLC, PTR-ToF-MS Enable AI Grading of White Tea
2
Py-GC–MS Reveals Microplastics in Playgrounds
3
Analytical Procedure Lifecycle Approaches in Accordance With ICH Q14 and ICH Q2(R2): Opportunity Knocks or Just Another Challenge and Headache? (Part 2)
4
LC-MS/MS Links Vitamin D Levels to Sleep Timing
5