

Publication|Articles|April 3, 2023
- April 2023
- Volume 19
- Issue 4
- Pages: 20–23
Tips & Tricks: Checking the Performance of Your GPC/SEC Column
Author(s)Wolfgang Radke
Advertisement
Although the columns are the least expensive part of a gel permeation chromatography/size-exclusion chromatography (GPC/SEC) system, the quality of the results of a GPC/SEC analysis crucially depends on the performance of the column or column set applied. Low-performing columns reduce resolution. Even the addition of sophisticated and costly detection devices, such as online light scattering or viscosity detectors, cannot overcome the limitations resulting from poor column performance. The lifetime of a column is influenced by a variety of variables, such as column handling, the type of material injected, pressure drops, and back pressure, as well as the required resolution. As it is difficult to predict how long a column can be used for a particular application, column performance should be checked regularly. Determination of the number of theoretical plates provides an easy and cost-effective way to routinely control column performance.
Number of Theoretical Plates as a Measure of Column Performance
Gel permeation chromatography/size-exclusion chromatography (GPC/SEC) has become the method of choice for molar mass determination of macromolecules. To separate a macromolecular sample, a suitable combination of column material and mobile phase must first be identified, to ensure interaction of the analyte with the stationary phase is eliminated. In addition, the pore size distribution of the column filling must be chosen to match the hydrodynamic size distribution of the samples to be analyzed (1,2). Finally, the particle size must fit the anticipated separations. To reduce the risk of stress-induced elongation and degradation, larger particles should be applied when analyzing very high molar masses, while for the separation of oligomers, small particles will help to achieve high resolution.
While the pore size and pore size distribution of the packing determines the average volume by which two molar masses are separated, that is, the slope of the calibration curve, the resolution is also influenced by peak broadening occurring during the chromatographic experiment. Peak broadening is influenced by a variety of sources within the system. These include the cell volume of the detector, bad capillary connections between the different parts of the system, the injection volume, as well as in-column band broadening. In-column band broadening results from unequal pathways or unequal velocity streams of the molecules passing through the column.
A quantitative measure of peak broadening is the number of theoretical plates of the column or column combination. Typically, the number of theoretical plates at the time of production is provided on the manufacturer’s column certificate.
However, depending on the treatment of the columns, as well as on the type of samples and matrices injected, loss of column performance will occur over time. As the performance of a column changes during its lifetime, columns are regarded as consumables that need to be replaced once performance is not sufficient for the desired application.
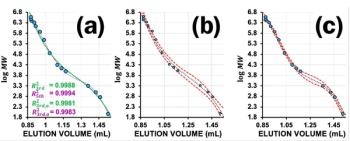
Figure 1 shows the effect of band broadening (number of theoretical plates) on the separation of polystyrene oligomers. Clearly, the resolution of the different low molar mass oligomers decreases with the decreasing number of theoretical plates. This complicates not only quantitation of the different peaks but also affects determination of molar mass averages.
Thus, it is important to ensure that columns are in a suitable condition for the desired separation task. Plate count determination is well suited for this purpose. Regularly controlling column performance is a recommendation for GPC/SEC users, and it is also mandatory to national and international norms (3,4,5). Analysis in accordance with these norms often requires the column to have a minimum number of theoretical plates.
Calculating the Number of Theoretical Plates
Plate count can be conveniently determined by injecting a monodisperse low molar mass compound, determining elution volume and estimating the peak variance. To account for the fact that peak broadening increases with the length of the column, the number of theoretical plates of a column or column combination in GPC/SEC is usually normalized to 1 m column length (Nth[m-1]). Thus:
where VP and σ are the elution volume and variance in units of volume, while L is the column length in centimetres.
Instead of the variance, the peak width at half peak height (w1/2) or the peak width at baseline (W) are often used, as these are usually easier to measure than the variance itself. Whether w1/2 or W must be used depends on the norms that are applied. For example, ISO 16014-1 (3) requests using w1/2, while ASTM norm D 5296 – 97 (5) uses W for determination of the peak width.
While application of equation 1 does not present a general problem, it is convenient to have routines for plate count calculations directly available in the data acquisition software. In addition, different equations should be implemented and associated with the respective norms. This allows the evaluation method required by the respective norm to be easily chosen, avoiding confusion and erroneous application of incorrect equations.
Figure 2 shows an example of how a plate count calculation might be set up in a data acquisition software. If signals from different detectors are acquired simultaneously—as is often the case in GPC/SEC—the choice of detector signal to be used for the band broadening calculations should be easily accessible. By selecting the norm, the correct equation is automatically applied, and the calculated results are directly compared to the requirements of the norm.
Good Practice of Tracking Column Performance
While plate count is usually assumed to characterize column performance, this is not completely true. As mentioned above, a variety of sources affect band broadening and, thus, the resulting number of theoretical plates. However, if there are no changes to the instrumental setup and experimental conditions, a loss in overall plate count can be regarded as loss of column performance and thus deceased resolution.
It is therefore good practice to check column performance after receiving a new column to ensure that no damage occurred during shipment and to document the initial condition. This test should be performed according to the test conditions supplied on the column certificate. Mobile phase, test analyte, flow rate, temperature, and column loading affect the number of theoretical plates, complicating comparison of the specified test results with own measurements if identical test conditions are not followed. However, if the experimental conditions are followed, leaving only differences in broadening resulting from tubing and instrument, a reasonable agreement between the results on the certificate and your own measurement should be achieved. This is sufficient to prove that the columns are in a suitable condition after arrival.
Once the plate count is determined for the new column or column combination, the shipping solvent can be replaced by the solvent used in the subsequent analysis. The replacement of solvent should follow the procedure recommended in the column manual to reduce the risk of column damage during this step. Once the column is equilibrated in the new solvent, column performance should be checked again, using suitable conditions for the eluent applied in the actual GPC/SEC analysis (see Table 1). The obtained number of theoretical plates now serves as a reference to which all subsequent plate count determinations can be compared. Plate count should be checked regularly and compared to the reference value to trace loss of column performance. Once the plate count has decreased by more than approximately 20%, a column replacement should be considered, especially for high resolution analysis.
It should be mentioned that plate count control does not necessarily require a separate measurement. If GPC/SEC is performed in the presence of an internal flow marker (6)—as requested in certain norms—the flow marker peak present in each run can be used to track column performance.
Test Conditions
While the plate count measurement on column arrival should be performed using the conditions on the column certificate, plate count tracking should be done in the eluent applied for the actual GPC/SEC analysis, to prevent frequent solvent exchange.
Typical test conditions may use an injection volume of 20 μL (or less, if possible), whereas concentration should be adapted to the number of columns applied. For a single column, a concentration of 0.2 g/L usually provides a suitable chromatogram, while for two and three columns, concentrations of 0.5 g/L and 1 g/L might be used. The test material depends on the eluent and detector applied. Test materials that have been proven useful for refractive index (RI) detection in typical GPC/SEC eluents are presented in Table 1.
It should be mentioned that the number of theoretical plates is only one criteria for suitable analytical conditions. It informs only about the general ability of a column, column combination, or instrumental setup to be suitable for performing analyses. However, the number of theoretical plates does neither give information on whether the combination of stationary and mobile phase is suited for running a particular application, nor does the plate count inform on whether the pore size and pore size distribution are suited for the molar mass range to be analyzed.
Summary
- GPC/SEC columns are consumables prone to loss of performance due to band broadening.
- Increasing band broadening diminishes resolution.
- Determining theoretical number of plates is an effective tool to ensure that the column is still applicable for the desired separation.
- Different norms request different formulas for determination of plate count.
- Appropriate test conditions should be applied depending on the GPC/SEC eluent used.
References
(1) Held, D. Select the Right Columns for Your Molar Mass Range. The Column 2013, 9 (22), 21–25.
(2) Radke, W.; Held, D. Separation Range and Resolution. The Column 2021, 17 (4), 26–30.
(3) ISO, ISO 16014-1:2019, Plastics — Determination of Average Molecular Weight and Molecular Weight Distribution of Polymers Using Size-Exclusion Chromatography — Part 1: General Principles (2019).
(4) EDQM, EurPh, General Chapter 2.2.46. Chromatographic Separation Techniques (EDQM, Strasbourg, France, 2023).
(5) ASTM, ASTM D 5296 – 97, Standard Test Method for Molecular Weight Averages and Molecular Weight Distribution of Polystyrene by High Performance Size-Exclusion Chromatography.
(6) Radke, W.; Held, D. Flow Marker—An Easy Concept to Increase Reproducibility. The Column 2016, 12 (6), 24–27.
About the Author
Wolfgang Radke studied polymer chemistry in Mainz, Germany, and Amherst, Massachusetts, USA, and is head of the PSS contract analysis department. He is also responsible for instrument evaluation and for customized trainings. PSS is now part of Agilent.
Email:
Website:
Articles in this issue
over 3 years ago
ExTech 2023 Event Previewover 3 years ago
Shimadzu Opens Japanese Innovation Hubover 3 years ago
Rising Stars of Separation Science: Petr Vozkaover 3 years ago
Vol 19 No 4 The Column April 2023 North American PDFover 3 years ago
Vol 19 No 4 The Column April 2023 Europe & Asia PDFAdvertisement
Related Content
Advertisement


Advertisement
Advertisement
Trending on LCGC International
1
How Should You Respond to FDA 483 Observations?
2
Analytical Procedure Lifecycle Approaches in Accordance With ICH Q14 and ICH Q2(R2): Opportunity Knocks or Just Another Challenge and Headache? (Part 2)
3
LC-MS/MS Finds PFAS Migration from Stuffed Toys
4
LC-MS/MS Links Vitamin D Levels to Sleep Timing
5