

|Articles|November 1, 2013
- LCGC North America-11-01-2013
- Volume 31
- Issue 11
Application of Existing Sample Preparation Technologies to New Areas
Author(s)Ronald E. Majors
Some sample preparation techniques that were introduced in the past are now being used for new applications.
Advertisement
New sample preparation technologies are being proposed all of the time. Many are novel and interesting but will never have a big impact on the sample preparation scene. Some, however, have been remarkably successful, such as solid-phase microextraction, QuEChERS, and stir-bar sorbent extraction. Over the next few installments of "Sample Prep Perspectives," we will examine some newer sample preparation approaches that may have the potential to break away from the field and become mainstay techniques. This first installment features techniques that have been introduced in the past and are now being used in new application areas.
Although sample preparation is an important part of this analytical cycle, it doesn't always get the respect that the separation and measurement instrumentation and the data handling aspects receive. Oftentimes, the task of sample preparation is delegated to the junior staff members who employ decades-old technology that is often manual, time-consuming, and uses a large amount of glassware and other devices. Some of the older technologies use copious amounts of solvent that must eventually be disposed of, creating expense and safety issues. Because of the use of multiple sample preparation steps in an attempt to simplify and isolate the desired analytes from a complex matrix, errors tend to creep into the assay and analyte recoveries may suffer. These observations and concerns cause many to consider sample preparation as the last bottleneck in the analytical laboratory.
In addition, sample preparation doesn't always receive the attention of the academic community because they consider the technologies dealing with preparing the sample to be simplistic and mundane and not real science. Nevertheless, if samples are not representative of the original source and are not collected, transported, and stored properly and considerable care is not taken in handling and preparing the sample in the laboratory then all the great analysis that takes place after the sample is presented to the instrument is for naught.
Despite all these obstacles, the need for faster, simpler, solvent-free, automatable sample preparation still exists. Because of the vast improvements in other parts of the analytical cycle, especially in the chromatographic analysis and detection (for example, mass spectrometry [MS]), there have been great strides in reducing the volume of sample required. This sample volume reduction in turn presents further challenges such as the need for more careful sampling but on the positive side results in a corresponding reduction in the amount of solvent and other chemicals needed for preparing the sample. The result is a reduction in overall sample preparation time and the cost of purchase and disposal of chemicals. Miniaturized sample preparation techniques such as solid-phase microextraction (SPME), single-drop microextraction, hollow-fiber membrane extractions, and microextraction by packed sorbent (MEPS) have been introduced that decrease solvent requirements by 100-fold or more. On the other hand, some of these newer technologies require more time for equilibration and thus there is a tradeoff in speed versus solvent usage.
I have been writing about sample preparation for some time and tend to collect articles and manufacturer's literature on sample preparation techniques that have been published or introduced that could become the next mainstream technique like SPME or QuEChERS (quick, easy, cheap, efficient, rugged, and safe). In this installment and in two future installments of "Sample Prep Perspectives" I will cover a number of technologies that could "cross the chasm" and become more widely used. In formulating these presentations, I divided the technologies into three categories:
- Existing technologies that have found new and different application areas from their original intent;
- New media that could be more useful in liquid–solid extractions (to be covered in a future installment); and
- New approaches to sample preparation that could bring added value (to be covered in a future installment).
QuEChERS
One of the hottest areas in sample preparation in the past five years has been QuEChERS. Much has been written about the technique previously (1–3), so I won't dwell on the methodology here. QuEChERS was originally designed for the multiresidue analysis of pesticides in fruits and vegetables. It was an evolutionary technique that combined salting out liquid–liquid extraction as the first step followed by dispersive solid-phase extraction (dSPE) as the second step. Because extracts were not as clean as with other sample preparation techniques, selectivity had to be generated elsewhere in the analytical method and thus liquid chromatography (LC)–MS-MS and gas chromatography (GC)–MS-MS with their high selectivity and sensitivity go hand in hand with QuEChERS. So why confine the samples and matrices to just pesticides and fruits and vegetables? The answer is clear: QuEChERS has expanded well beyond its classical application. Table I shows a sampling of recent published applications of QuEChERS that expands outside of the pesticide laboratory. Application areas range from environmental to food to biologicals. It is expected that QuEChERS will continue to expand its scope as time goes on.
Table I: Representative applications of QuEChERS other than pesticides in fruits and vegetables
QuEChERS has, for the most part, been a manual process with a great deal of shaking, pipetting, and moving centrifuge tubes around. The dSPE step was automated a couple of years ago but the extraction step was still a manual operation capable of creating carpal tunnel syndrome for somebody performing it many times a day. At Pittcon 2013, Teledyne-Tekmar introduced a sample preparation workstation that automates most of the QuEChERS steps including the handling of the initial 50-mL centrifuge tubes. The system is designed to automate the entire process from homogenate to the sample vial so that the sample is ready to inject into an LC–MS-MS or GC–MS-MS system. Workers in the field will now have to get their daily exercise by some other laboratory activity!
Miniaturized Salting Out Liquid–Liquid Extraction
The first stage in QuEChERS, salting out liquid–liquid extraction (SALLE), is a sample preparation technique in its own right. I reviewed the technology associated with SALLE in an earlier article (4). In keeping with the trend for miniaturization of sample preparation experiments, Khosraviani and Sereshti (5) developed a two-syringe system that allowed them to use microliter volumes of extraction solvent (see Figure 1). They used coupled mechanically driven 1-mL syringes to pump the extraction solvent (acetonitrile) into a saline aqueous solution in at a rate of 0.5 cycles/s. The large contact surface area between the phases led to a rapid equilibrium and extraction. With the antibiotic sulfanilamide as a test solute, the best performance was achieved with 250 μL of acetonitrile, a salt concentration of 250 mg/mL, a solution pH of 7, and five sequential mixings. The linear dynamic range was 0.001–10 μg/mL and the relative standard deviation was 1.55% (n = 3). They were able to quantitatively measure the antibiotic in tea and water samples.
Figure 1: Flow diagram of the process for miniaturized salting out liquidâliquid extraction in coupled syringes. (Adapted from a drawing supplied by Marzieh Khosraviani.)
Dried Blood Spotting and Beyond
The pharmaceutical community continues to have a great deal of interest in the application of dried blood spotting (DBS) to replace or supplement analyte measurements in whole blood (6). The advantages of greatly reduced blood sample volume for test animals and eventually humans, less invasive collection, safer and easier handling, and reduced costs are compelling arguments for DBS. Disadvantages include the spot inhomogeneity due to the patient's hematocrit levels, the handling of colorless liquids, and the current drudgery of manually punching out numerous dried blood spots for further analysis. Slow acceptance by regulatory bodies has not discouraged workers in the field of furthering the technology. Besides whole blood, DBS has been extended to other body fluids such as urine, serum, plasma, synovial fluid, tears, and cerebrospinal fluid, so the technique might be better referred to as dried media spotting (DMS).
Because DBS/DMS has been a rather manual technique, workers are striving to automate part or all of the process. The first approach was to automate the spot punching out operation, and this has been accomplished by several vendors. In this approach, the punched out spots are transferred directly to a vial for further processing and extraction of the compounds of interest. Camag has used its experience of handling thin-layer chromatography plates and has come up with a robotic automated card handling and extraction system that can process as many as 500 DBS cards. The system uses optical card recognition to locate spots and record bar-code information, and it can add an internal standard just before extraction. Liquid extraction is performed directly through the dried blood spot on the DBS card. The sample is directed into a sample loop that can be configured in the system in several ways including the addition of traps to enrich the diluted extract. After elution, the system automatically rinses the module to prevent any carryover and returns the used DBS card to the card rack.
Agilent Technologies has developed a variation of this system that includes the LC–MS-MS analysis portion (Figure 2). This system includes two traps, one that traps and concentrates the elution from the DBS card and another used on the LC analysis side to further enrich the eluted sample by adding water diluent to the flow stream before the second trap; this enrichment ensures that the analytes are trapped on the reversed-phase column. By operating the 6- and 10-port valves in the proper sequence, the entire process is automated.
Figure 2: Fully automated dried blood spot card extraction and analysis system (Agilent AACE DBS LCâMS system initial configuration: 1200 Infinity LC system, 6400 Series triple-quadrupole LCâMS system).
Spark Holland is developing a robotic autosampler with a flow-through card desorption system with a similar arrangement of valving. The company's DBS card clamp has an internal rim diameter of 6 mm, which is large enough to sample the entire DBS spot. Thus, the blood hematocrit level does not come into play. The system also adds internal standard and elutes the analytes into a short SPE column for trapping purposes. Finally, the effluent of SPE column is directed to the MS-MS system. A unique feature of the Spark Holland approach is temperature-enhanced desorption that aids in dissolution of the dried blood spot components.
With the continued interest in DBS/DMS, there is no doubt that further automated card handling systems will appear on the market to take advantage of the huge potential after regulatory bodies accept the measurement data.
When blood spots are placed onto the DBS card and the card is dried, some analytes of interest that may have poor stability in liquid blood, such as drug metabolites, are stabilized. However, compounds that may be highly susceptible to oxidation are those containing thiol groups. Usually they are protected in whole blood by derivatization to thioethers. Garofolo and coworkers (7) from Algorithme Pharma (Laval, Quebec, Canada) transferred this derivatization process to DBS cards. They found that a solution of the derivatizing agent 2-bromo-3'-methoxyacetophenone (BMP) could be added to the card before blood spotting. Using thiorphan, an active metabolite of the drug racecadotril, as a test solute and a deuterated compound as an internal standard, they were able to show that a derivatized thiol compound was stabilized on the DBS card. They used electrospray LC–MS-MS in the positive ion mode with multiple reaction monitoring and obtained a limit of quantitation (LOQ) of 5 ng/mL and a linear calibration range of 5.0–600 ng/mL for the derivatized thiol compound.
Column Switching as a Sample Preparation Technique
It has long been known that 2D chromatography can be used to eliminating interferences and clean up "dirty" samples. However, users have been left to configure their own valving systems with complex plumbing, multiple pumps, and precise timing requirements. Most users didn't feel it was worth the effort and so column switching was usually not the first sample preparation technique that came to a chromatographer's mind. Nowadays, manufacturers offer preconfigured column switching systems that have the capability to perform heart cutting, direct-to-waste, comprehensive LC×LC or GC×GC, and many other multicolumn tasks. A popular configuration is set up to perform on-line SPE in which a short column is configured across two of the ports of a 10-port valve (much like a sample loop), and unlike conventional SPE where cartridges are used once and discarded, the on-line column is used over and over again. The SPE column is often used in a backflush mode so that, before the next run, the column can be rid of any strongly held compounds that could show up in a later run if not removed.
A popular application of column switching is enrichment of trace organics in water using a reversed-phase SPE trapping column. An external pump transfers a large volume (several hundred milliliters) of water through the column. Because water is a very weak solvent in reversed-phase SPE, the organics in the water sample are strongly retained by hydrophobic interactions (retention factor [k] values very large). Some polar analytes such as phenol may not be trapped as efficiently (k values low). More recently, with the advent of very sensitive triple-quadrupole mass spectrometers, analysts can use smaller volumes of water, less than 1 mL, and still achieve parts-per-billion analysis. Schneider and Schuhn (8) required only 900 μL of water to effectively trap 28 trace-level herbicides from drinking water and measure them using automated on-line SPE–LC–triple-quadrupole MS-MS. In this case, only 22 min was required for both trapping and analysis. Concentrations in the range of 10–350 ng/L were successfully quantitated with an area precision of less than 5% and a retention time precision of less than 0.1%. Using a similar setup, Stoll and coworkers (9) investigated trace-level antibiotics in Minnesota river and wastewater effluents. Although they observed substantial matrix effects with 1D on-line SPE, quantitation was quite feasible using standard addition. However, adding a second-dimension column and using heart cutting reduced the number of unwanted matrix components reaching the detector and kept the LC–MS system inlet much cleaner; hundreds of samples could be run between cleanings. A system wash with a strong solvent was required to minimize analyte carryover.
The analysis of drugs and metabolites in biofluids is very important in pharmacokinetic studies. Often, sample preparation is needed to obtain adequate sensitivity and eliminate undesired matrix components. Protein precipitation and SPE are two approaches commonly used to address the cleanup problem. Instead, Lopes and coworkers (10) used a direct injection of biofluids to analyze rifampicin and 25-desacetylrifampicin in rat liver microsomes. Rifampicin is widely used in the treatment of tuberculosis and mycobacterial infections.
In the past, restricted access media (RAM) columns have been used for sample cleanup and reducing the time required for sample preparation. A RAM column normally has two chemistries to accomplish the cleanup task. The outer surface of the RAM particle is usually hydrophilic, and combined with size exclusion (smaller pore opening), will exclude high-molecular-weight proteins so that they can be directed to waste and not interfere with the analysis of the lower-molecular-weight drugs and their metabolites. The inner surface of a RAM particle usually is covered with a reversed-phase functional group such as C4 or C8. The smaller, low-molecular-weight compounds can diffuse into the pores of the RAM packing and interact with the reversed-phase functional group and be retained without interference from the proteins in the biological extract. Lopes and coworkers (10) used a different twist and employed a RAM support consisting of a bovine serum albumin (BSA) coating as the hydrophilic outer surface modification and a cation-exchange functionality to retain rifampicin and 25-desacetylrifampicin. The RAM column excluded 94% of the microsomal proteins within 2 min, and the analytes of interest were eluted in the 4.0–5.5 min time period. By using a switching valve, this volumetric "window" was directed to a C8 analytical column and the separation of the two analytes was accomplished by reversed-phase chromatography. For quantification, a triple-quadrupole mass spectrometer was used for detection with selective reaction monitoring in the positive ion mode. The total analysis time was only 12 min.
Stir-Bar Sorbent Extraction
The principle of stir-bar sorbent extraction (SBSE) is related to SPME, but because of the higher surface area of the polymer-coated stir bar versus the polymer-coated fiber, sensitivity is greatly enhanced. The standard stir bar has a polydimethylsiloxane coating and is thus hydrophobic. Hydrophobic compounds, characterized by a high octanol–water partition coefficient (Kow), are extracted from water with high recovery. However, hydrophilic compounds with low Kow values are recovered with low yield. By adding salt to the water (salting out), users can substantially improve the recoveries of hydrophilic compounds via the salting out effect. However, that approach decreases the recovery of hydrophobic compounds. Thus, a compromise has to be made. Dual SBSE, proposed by a Gerstel team in Japan (11), solves this problem by splitting the sample and performing two extractions, one with salt and one without salt, to capture the hydrophilic and hydrophobic compounds, respectively. The captured analytes on the two stir bars are then desorbed together for the simultaneous analysis of the hydrophilic and hydrophobic analytes. With help from Ed Pfannkoch from Gerstel U.S., a further modification called sequential SBSE was developed (11). In the first experiment, the standard polymethylsiloxane-coated stir bar is placed in the water sample and hydrophobic compounds are extracted. The stir bar is then removed, a 20–30% sodium chloride content is added to the sample, and a second stir bar is added to extract the hydrophilic compounds. As before, both stir bars are inserted into the thermal desorption chamber for subsequent GC–MS analysis. Yields for both hydrophobic and hydrophilic pesticides were greater than 80% with limits of detection (LOD) less than 10 ng/mL and good linearity.
Additional embellishments of the dual SBSE technique involve two stir bars with different stationary phase coatings and the use of other modifiers to improve recoveries (for example, different solvents, pH modification, and derivatization).
Solvent Sublation
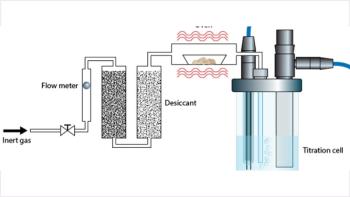
Solvent sublation is an adsorptive bubble enhancement technique in which hydrophobic surface active compounds in aqueous solution are adsorbed on the bubble surfaces of an ascending gas stream and then are collected in an organic layer placed on top of the aqueous phase (12). Figure 3 outlines the simple experimental setup used for solvent sublation studies. Employing this technique, Chang and coworkers (13) were able to enrich trace levels of polymer additives (antioxidants and UV absorbers) in plastic beverage packaging and then analyze them by high performance liquid chromatography (HPLC). The authors were interested in finding out the level of these chemical compounds that would leach out of the plastic bottles over a period of time using distilled water for normal beverages and 3% acetic acid for acidic beverages. The leaching experiments were carried out over a 10-day period at 40 °C. In developing their solvent sublation technique, the authors investigated several parameters, including the pH of the aqueous phase to increase the solubility of the target compounds in the sublation (collection) solvent (Figure 3); the addition of sodium chloride; the nitrogen gas flow rate; the flotation time (the time that the bubbles are percolated through the aqueous sample); and the type of sublation solvent. In the investigation of the solvent type, they looked at the following solvents: n-octanol, isoamyl alcohol, n-hexane, and n-butanol. n-Butanol yielded the best overall recovery of the 10 polymer additives studied. However, the solubility of n-butanol in water necessitated the addition of sodium chloride to reduce its solubility in water, and its presence also increased the rate of recovery of the polymer additives as a result of the salting out effect. They found that the optimum experimental conditions included the use of n-butanol as sublation solvent, 80 g of sodium chloride in 300 mL of aqueous sample solution (pH 3), a nitrogen flow of 60 mL/min, and flotation time of 60 min. At this flotation time with the trace level of polymer additives studied, they found that ambient light caused the decomposition of some of the compounds and that the operation was best performed in the dark. Using the optimum conditions with the 10 polymer additives in real samples, they obtained limits of detection in the range of 0.34–1.25 ng/mL, limits of quantitation in the range of 1.13–4.15 ng/mL with good linearity with recoveries in the range of 88.73–107.65% and relative standard deviations of 2.16–10.55%.
Figure 3: Schematic of the apparatus for solvent sublation studies. (Adapted from reference 13.)
Conclusion
Existing sample preparation methods can always be extended to new application areas that give a new life to the technique or solve problems where other sample preparation techniques fail to perform. In this installment of "Sample Prep Perspectives," I looked at some successful new and novel applications of existing sample preparation methods that may cause readers to think about applying the technology to solve their sample preparation problems. In subsequent installments, I will examine new sample preparation media for liquid–solid extraction as well as new approaches to sample preparation that could be applied in your laboratory today with only minimal disruption.
References
(1) M. Anastassiades, S.J. Lehotay, D. Štajnbaher, and F.J. Schenck, J. AOAC Int. 86, 412–431( 2003).
(2) R.E. Majors, LCGC North Am. 25(5), 436–446 (2007).
(3) S.J. Lehotay, M. Anastassiades, and R.E. Majors, LCGC North Am. 28(7), 504–516 (2010).
(4) R.E. Majors, LCGC North Am. 27(7), 526–533 (2009).
(5) M. Khosraviani and H. Sereshti, Univ. of Tehran, IR, private communication.
(6) R.E. Majors, LCGC North Am. 29(1), 14–27 (2011).
(7) F. Garofolo et al., Biomed. Chromatogr. 26, 1617–1624 (2012).
(8) S. Schneider and B. Schuhn, HPLC 2013 poster paper SAMP30-WE, Amsterdam, The Netherlands, June 19, 2013.
(9) R. Stoll, D.C. Harmes, and K. Witt, "Quantitation of Trace Level Antibiotics in Minnesota River Water and Wastewater Effluent Using an Automated, Integrated on-line SPE LC-MS/MS System," HPLC 2013 poster paper INST24_WE, Amsterdam, The Netherlands, June 19, 2013.
(10) B. Lopes, J. Cardoso, B. Silva, Q. Cass, and R. Vincenzi, "Target-2D UHPLC-MS/MS Quantification of Rifampicin and 25-Desacetylrifampicin in Rat Liver Microsomes," HPLC 2013 poster paper SAMP21_WE, Amsterdam, The Netherlands, June 19, 2013.
(11)
(12) Y.J. Lv and H.X. Zhu, Sep. Purif. Methods 30, 157–189 (2001).
(13) L. Chang, P. Bi, Y. Liu, Y. Mu, F. Nie, S. Luo, and U. Wei, J. Agric. Food Chem. 61, 7165–7171 (2013).
(14) J. Dominguez-Alvarez, M. Mateos-Vivas, D. Garcia-Gomez, E. Rodriguez-Gonzalo, and R. Carabias-Martinez, J. Chromatogr. A 1278, 166–174 (2013).
(15) N. Arroyo-Manzanares, A.M. Garcia-Campaña, and L. Gámiz-Gracia, J. Chromatogr. A 1282, 11–19 (2013).
(16) H.R. Norli, A. Christiansen, and E. Deribe. J. Chromatogr. A 1218, 7234–7241 (2011).
(17) P. Yogendrarajah, C. Van Poucke, B. De Meulenaer, and S. De Saeger, J. Chromatogr. A 1297, 1–11 (2013).
(18) I.M. Valente, C.M. Santos, M.M. Moreira, and J.A. Rodrigues, J. Chromatogr. A 1271, 27–32 (2013).
(19) A.Garrido Frenich, R. Romero-González, M.L. Gómez-Pérez, and J.L. Martínez Vidal, J. Chromatogr. A 1218, 4349–4356 (2011).
(20) M.J. Martínez Bueno, C. Boillot, H. Fenet, S. Chiron, C. Casellas, and E. Gómez, J. Chromatogr. A 1305, 27–34 (2013).
(21) M. Lombardo-Agui, L. Gámiz-Gracia, C. Cruces-Blanco, and A.M. Garcia-Campaña, J. Chromatogr. A 1218, 4966–4971 (2011).
(22) W. Peysson and E. Vulliet, J. Chromatogr. A 1290, 46–61 (2013).
(23) S. Herrero Martín, C. García Pinto, J.L. Pérez Pavón, and B. Moreno Cordero, J. Chromatogr. A 1217, 4883–4889 (2010).
(24) N. León, M. Roca, C. Igualada, C.P.B. Martins, A. Pastor, and Vicent Yusá, J. Chromatogr. A 1258, 55–65 (2012).
(25) J.A. Padilla-Sánchez, P. Plaza-Bolañosa, R. Romero-González, A. Garrido-Frenich, and J.L. Martínez Vidal, J. Chromatogr. A 1217, 5724–5731 (2010).
(26) A. Jakimska, B. Huerta, Z. Barganska, A. Kot-Wasik, S. Rodríguez-Mozaz, and D. Barceló, J. Chromatogr. A 1306, 44–58 (2013).
(27) H. Gallart-Ayala, O. Núñez, E. Moyano, and M. Teresa Galceran, J. Chromatogr. A 1218, 459–466 (2011).
(28) A.R. Fontana, A. Camargo, L.D. Martinez, and J.C. Altamirano, J. Chromatogr. A. 1218, 2490–2496 (2011).
(29) M-.V. Salvia, C. Cren-Olivé, and E. Vulliet, J. Chromatogr. A 1315, 53–60 (2013).
(30) M. Whelan, J. O'Mahony, M. Moloney, K.M. Cooper, A. Furey, D.G. Kennedy, and M. Danaher, J. Chromatogr. A 1275, 41–47 (2013).
(31) L. Monaci, E. De Angelis, and A. Visconti, J. Chromatogr. A 1218, 8646–8654 (2011)
(32) S-.S. Cai, J. Stevens, and J.A. Syage, J. Chromatogr. A 1227, 138–144 (2012).
(33) B.O. Pule and N. Torto, Agilent Technologies Application Note 5990-8988EN (2012).
(34) B.O. Pule, L.C. Mmualefe, and N. Torto, Agilent Technologies Application Note 5990-5395EN (2012).
(35) S.L. Stead, H. Ashwin, B.H. Johnston, A. Dallas, S.A. Kazakov, J.A. Tarbin, M. Sharman, J. Kay, and B.J. Keely, Anal. Chem. 82, 2652–2660 (2010).
(36) S.C. Nanita, A.M. Pentz, J. Grant, E. Vogl, T.J. Devine, and R.M. Henze, Anal. Chem. 81, 797–808 (2009).
(37) V. Homen, J. Aveline Silva, C. Cunha, A. Alves, and L. Santos, J. Sep. Sci. 36, 2176–2184 (2103).
Ronald E. Majors "Sample Prep Perspectives" Editor Ronald E. Majors is a Senior Scientist in the Columns and Supplies Division at Agilent Technologies (Wilmington, Delaware) and is a member of LCGC's editorial advisory board. Direct correspondence about this column to
Ronald E. Majors
Articles in this issue
over 12 years ago
Market Profile: Laboratory Information Management Systemsover 12 years ago
What's the Problem with the LLOQ? — Case Studyover 12 years ago
Mobile-Phase Optimization Strategies in Reversed-Phase HPLCover 12 years ago
Gas Chromatography: Practical Proceduresover 12 years ago
Peaks of Interestover 12 years ago
Vol 31 No 11 LCGC North America November 2013 Regular Issue PDFAdvertisement
Related Content
Advertisement

Webcasts

Advertisement
Advertisement
Trending on LCGC International
1
Chromatography's Role in Spotting False Leachables
2
Fast GC-MS/MS Detects PFAS in Food Packaging
3
AI/ML in Practice: Machine-learning Prediction of Chromatographic Retention Times for Small Molecules in Pharmaceutical Applications
4
Emerging Contaminants and the Shifting PFAS Landscape
5