
|Articles|January 19, 2023
- January 2023
- Volume 19
- Issue 01
- Pages: 9–12
Tips & Tricks GPC/SEC: A Look at Molar Mass Averages and How They Are Affected By SEC Baseline and Integration Settings
Author(s)Wolfgang Radke
Advertisement
Determination of molar mass distributions and the molar mass averages derived therefrom are the main objectives of gel permeation chromatography/size-exclusion chromatography (GPC/SEC) analysis. But what is the meaning of these averages and how are they influenced by the setting of baselines and integration limits? This instalment of Tips and Tricks in GPC/SEC will try to provide a better understanding.
Gel permeation chromatography/size‑exclusion chromatography (GPC/SEC) has become the main technique used to determine molar mass distributions and molar mass averages. In GPC/SEC, macromolecules are separated according to their size, which for most polymers correlates to molar mass. At the appropriate conditions the high molar mass species elute first, while smaller molecules elute later from the column. The use of a calibration curve allows the chromatogram to be translated into a molar mass distribution from which average molar masses, such as the number (Mn) and weight average molar masses (Mw), can be obtained. These average molar masses can then be used for quality control or to release products for further use. For example, pharmacopoeias often request molar mass averages to lie within defined limits before the materials can be used for pharmaceutical applications.
But what is the meaning of these molar mass averages? Most of us know how to calculate these averages, but what do these values tell us?
According to reference books (1), the Mn and Mw can be calculated according to:
Where ci, Ni, and wi are the weight concentration, number, and weight fraction of molecules with molar mass Mi. The sums must be evaluated over all species present in the sample. Other versions of the above formulas that use integrals do exist. The difference between the integrating versions and the summations above result from the assumption of the existence of discrete molar masses (summation) or a continuum of molar masses (integrations) present in the sample. The latter assumption is often applied in theoretical calculations.
Descriptive Meanings of Mn and Mw
While the formulas given above are mostly known, their physical meaning and the consequences are often not clear.
Let us first have a look at the number average molar mass, Mn.
The right side of equation 1 provides a simple rule for the determination of the number average molar mass. As the numerator is equal to the total mass of the sample, while the denominator equals the total number of molecules in the sample, the rule reads “weigh in your sample and determine the number of molecules within the sample”. The number average molar mass is therefore what we would typically provide if someone asked us to calculate
“an average”.
While the meaning of the number average molar mass is largely clear, a descriptive meaning of the weight average molar mass is often lacking. The weight average molar mass neither provides the median of the weight distribution where above and below exists the same amount of sample molecules, nor does the weight average molar mass correspond to the maximum of the molar mass distribution or to the most abundant molar mass.
To get a better understanding of Mw, we can rearrange equation 2 to yield:
Equation 3 resembles the equation defining the centre of gravity, with (Mi–Mw) interpreted as the distance at which a force proportional to wi is acting. Thus, Mw can be regarded as the centre of gravity of the linear molar mass distribution, w(M). This is schematically shown in Figure 1, where the position of Mw is indicated in the logarithmic and the linear molar mass distribution. Note: To convert a logarithmic molar mass distribution into a linear one it is not sufficient to simply replot the x-axis, the y-values also need to be recalculated.
If a support (black triangle) is placed below the linear weight distribution at Mw, the distribution is in balance. Any displacement of the support from Mw results in an imbalance.
Origin of the Effect of Setting of Baseline and Integration Limits on Mn and Mw
The descriptive meaning of Mn given above helps us to understand the effect of setting baseline and integration limits in GPC/SEC on Mn.
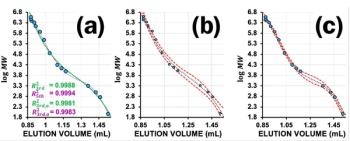
The chromatogram in Figure 2 shows a small peak at high elution volume. Although this peak contributes by less than 1% of the total peak area, its inclusion or exclusion significantly alters the number average molar mass—from 22200 g/mol when including the peak to 24100 g/mol when the peak is excluded. The weight average molar mass remains nearly unaffected (36100 g/mol vs. 36000 g/mol). Knowing that determination of number average molar mass is based on the total weight of the sample in relation to the number of molecules within the sample, and keeping in mind that the total area under the curve is proportional to the total mass of the sample, which varies by less than 1%, the origin of the variation in number average molar mass must be due to the presence of a significantly higher number of polymer chains when including the small peak. Figure 3 shows a comparison of the corresponding weight distribution (the weight fraction of molecules of a given molar mass) and the number or frequency distribution (the molar fraction of molecules of a given molar mass). While the small peak contributes to less than 1% of the total sample weight, it contains nearly 8% of all polymer molecules. Excluding this peak will therefore substantially alter the number average molar mass. The settings of baseline and integration limits, particularly at high GPC/SEC elution volumes, is therefore of great importance to help achieve reliable number average molar masses.
Similarly, a small peak of very high molar mass species, for example, from aggregates, will move the weight average up substantially to higher values. In the example shown in Figure 4, the weight average molar mass corresponding to the complete chromatogram is 102000 g/mol. Ignoring the small peak at low elution volume—which accounts for only 3% of the total mass—results in a weight average molar mass of 68200 g/mol. This large difference is because the weight fraction of the high molar mass species though low is multiplied with its distance from the centre of gravity (Mw).
Summary
- The number average molar mass corresponds to the usual arithmetic average.
- The number average molar mass is obtained by determining the number of molecules within a given amount of sample.
- The weight average molar mass corresponds to the centre of gravity of the linear mass distribution.
- Small variations in the setting of the baseline or integration may significantly affect the number of molecules in a sample, and therefore may have a strong impact on the determination of the number average molar mass by GPC/SEC.
- Ignoring small fractions of high molar mass will alter Mw as determined by GPC/SEC because the weight faction is multiplied with its deviation from the centre of gravity.
Reference
- Odian, G. Principles of Polymerization, Fourth Edition; John Wiley & Sons, 2004.
Wolfgang Radke studied polymer chemistry in Mainz, Germany, and Amherst, Massachusetts, USA, and is head of the application development department at PSS—now a part of Agilent. He is also responsible for instrument evaluation and for customized trainings.
Articles in this issue
over 3 years ago
Playing with Selectivity for Optimal Chiral Separationover 3 years ago
Rising Stars of Separation Science: Martina Cataniover 3 years ago
Agilent Achieves “Angel” Level Sponsorship of My Green Labover 3 years ago
Thermo Opens New Site in Chinaover 3 years ago
A Focus on Forensic Taphonomy and Chromatographyover 3 years ago
SCM-10 Event Previewover 3 years ago
Vol 19 No 1 The Column January 2023 North American PDFover 3 years ago
Vol 19 No 1 The Column January 2023 Europe & Asia PDFAdvertisement
Related Content
Advertisement


Advertisement
Advertisement