
Publication|Articles|November 4, 2020
- The Column-11-04-2020
- Volume 16
- Issue 11
Tips & Tricks GPC/SEC: Alternatives to Narrow Standard Calibration in GPC/SEC
Author(s)Daniela Held, Wolfgang Radke
A review of alternative approaches to narrow standard calibration.
Advertisement
Molar mass determination by GPC/SEC requires column calibration. This is usually performed using narrowly distributed polymer standards of known molar mass. However, by this procedure true molar masses result only, if the chemical structure of the analyte matches the one of the standards used for calibration. As narrowly distributed standards of appropriate chemical structure are often not available, this instalment of Tips & Tricks describes alternative approaches to narrow standard calibration.
GPC/SEC is a powerful separation technique allowing determination of molar mass distributions and molar mass averages of macromolecules. However, GPC/SEC is a relative method requiring molar mass reference materials, standards, for calibration. To obtain true molar masses the calibration standards have to be of identical chemical structure and topology as the samples. However, often appropriate narrowly distributed standards are not available. In such cases GPC/SEC with expensive detectors such as on‑line light scattering (GPC/SEC‑LS) or viscometry (GPC/SEC‑visc.) detectors might be applied (1,2). Apart from methodological challenges with such instrumentation, the availability of such instrumentation is not given in every laboratory. Therefore, affordable and easy-to-use alternatives to narrow standard calibration are often sought after.
Calibration in GPC/SEC
In GPC/SEC a sample is separated according to the size—more precisely the hydrodynamic radius—of the individual chain. Separation occurs in columns filled with porous particles. Molecules of a size larger than the pores of the particles cannot enter the pores and are pushed forward by the flowing eluent. Smaller molecules may diffuse into the pores, where they reside before diffusing out of the pores back into the flowing mobile phase. Therefore, smaller molecules elute behind larger ones.
In order to relate the elution volume to the molar mass of the sample, a calibration needs to be established. This is typically done by injecting a series of narrowly distributed standards of identical structure and known molar mass at peak maximum of the distribution (MP). By plotting the elution volume of the peak maximum versus molar mass, MP, the calibration curve is established. This can be easily performed for narrowly distributed standards, as the number and weight average molar masses, Mn and Mw, closely agree with MP (Figure 1). However, this approach is not feasible for broadly distributed samples. For such samples broad chromatographic peaks arise and it is not possible to unambiguously assign a molar mass to the maximum of the chromatogram for the following reasons. First, for broadly distributed samples, only average molar masses are typically provided. These molar masses usually differ from the maximum of the molar mass distribution (Figure 1). Second, even if the maximum of the molar mass distribution is known, the molar mass at the peak maximum of the molar mass distribution usually does not coincide with the molar mass at the chromatogram’s peak maximum, because the shape of the chromatogram is a function of both, the molar mass distribution and the slope of the GPC/SEC calibration curve. For these reasons, narrowly distributed standards are usually employed.
Since at a given molar mass the hydrodynamic sizes for polymers of different chemical structure are not identical (Figure 2) the molar mass determined by GPC/SEC for a polymer sample depends on the chemical structure of the analyte applied for calibration. That is why molar masses derived by GPC/SEC are often referred to as relative molar masses.
To obtain true molar masses, the analyte and the calibration standards need to be of identical chemical structure.
Unfortunately, narrowly distributed samples are commercially available only for a limited number of polymers, resulting in the need for alternative calibration approaches.
Universal Calibration Based on Mark‑Houwink Equation
Benoit and Grubisic empirically showed that polymers eluting at the same GPC/SEC elution volume have identical products of intrinsic viscosity, [n], and molar mass, M. This observation forms the basis for the concept of universal calibration. Applying the Mark‑Houwink equation, [n]=K×Ma the relation between two polymers eluting at the same elution volume can be written:
where K1, K2, a1 and a2 represent the Mark‑Houwink parameters of the two polymers in the GPC/SEC eluent.
Knowing the two sets of Mark-Houwink parameters, Equation 1 allows transferring a calibration curve established using standards of one chemical structure (Equation 1, index 1) into a calibration curve of the analyte (Equation 1, index 2).
Mark-Houwink parameters for a large number of polymers can be found in literature, for example, in the “Polymer Handbook” (3).
After entering the appropriate Mark‑Houwink parameters for the two polymers modern software tools calculate for each molar mass of the original calibration curve the corresponding molar mass for the analyte.
Broad Standard Calibration
If neither suitable narrowly distributed standards nor suitable Mark-Houwink parameters are available, broadly distributed standards of the analyte’s structure can be applied, to convert a calibration curve established using narrowly distributed standards (base calibration) into the appropriate calibration curve for the analyte.
The basis for this approach is again given by Equation 1. If the individual parameters are unknown, Equation 1 can be recast as:
where A and B are yet unknown parameters, which need to be identified. To do so, one or more broadly distributed samples with one or more known molar mass averages (Mn or Mw, target values) are required. The broadly distributed samples are analyzed on the column set to be calibrated to obtain the corresponding chromatograms. By choosing an arbitrary test set of A and B the previously established base calibration is converted into a new calibration curve based on Equation 2 and the number and/or weight average molar mass are calculated for each chromatogram. The relations between the test parameters A and B, the chromatogram (S(V)) and the calculated average molar masses are given by:
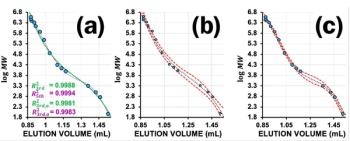
where Mw,i (A,B) and Mn,i(A,B) are the weight and number average molar masses calculated from chromatogram i, using a test set of the parameters A and B, while M1(V) is the molar mass at elution volume V of the base calibration. Obviously, the calculated average molar masses depend on the choice of the parameters A and B and will agree with the true molar mass averages of the samples only, if A and B are chosen correctly. Thus, by selecting different test sets of A and B molar mass averages are calculated for each chromatogram and are compared to the target values for the samples, until the best agreement between the calculated molar mass averages and the target values is obtained (see Figure 3). Obviously, a large number of calculations are required, which are tedious if to be performed manually. However, using commercial GPC/SEC software packages the calculations are user friendly performed within a few seconds.
The so obtained set of A and B can now be applied to convert the previous established base calibration curve into the appropriate calibration curve for the analyte.
Moreover, the derived set of A and B can be used later on to convert base calibrations obtained for other columns or columns banks using the same eluent system.
Since two parameters are to be determined, at least two target values of broadly distributed samples have to be supplied. These can be either Mn and Mw of a single broadly distributed standard or single or multiple averages of different broadly distributed standards. It is recommended, however, to use several standards covering a wide range of molar masses.
The described calibration procedure uses target values for one or more broadly distributed samples. The target values for the samples can be obtained from laboratories performing contract analysis on polymers.
Sometimes modified approaches to broad standard calibration are applied in which the general shape, that is, a mathematical function which depends on some unknown parameters (such as a straight line), is assumed. The task is then to determine the parameters of the function such that the best agreement between the target values for the standards and the ones calculated based on the parameter dependent calibration curves is achieved. Such an approach is, for example, requested by European and US pharmacopoeias for the characterization of dextrans (4).
Integral (Cumulative) Calibration
Another alternative to overcome the issue of non‑available narrow standards of suitable chemical structure uses a single broadly distributed standard of well‑known molar mass distribution. The cumulative or integral molar mass distribution I(M) characterizes the weight fraction of chains having molar masses below M. The cumulative distribution can be provided tabulated, as given in Figure 4, for example.
Here we see that, for example, 25% of the sample correspond to chains having molar masses of less than 34,000 Da, while the molar masses of 50% of all chains are lower than 59,000 Da. Clearly, the table can contain a much larger number of entries. The cumulative molar mass distribution is easily calculated from the differential molar mass distribution.
In order to calibrate the GPC/SEC column, a broadly distributed standard of known molar mass distribution having the same chemical structure than the analyte is analyzed on the column to be calibrated to obtain the chromatogram. The chromatogram is integrated from low to high elution volume and the integral is normalized to 100%. To assign a molar mass to an elution volume, a molar mass of the cumulative distribution table is selected, in our example we use the molar mass 34,000 Da. According to our table the fraction of material having a lower molar mass than 34,000 Da is 25%. Since chains of lower molar mass than 34,000 Da elute after the elution volume, of a chain of molar mass 34,000 Da, we need to identify the elution volume after which 25% of the sample elute, that is, for the last eluting 25% of the chromatogram. In our example this corresponds to approx. 24.78 mL. Thus, a molar mass of 34,000 Da elutes on our column at 24.78 mL. By performing this assignment of elution volume to molar mass step by step for a number of entries of the cumulative distribution, the calibration curve is constructed. Modern GPC/SEC software often allows reading in a cumulative calibration table from a file and automatically performing the required assignments.
Clearly, the so-constructed calibration covers only the range of molar masses, present in the broadly distributed standard. Therefore, the sample should cover the elution range and thus the molar mass range of the analytes. If a single broadly distributed sample is insufficient, several broad samples of known cumulative distribution might be applied.
The cumulative distributions of broadly distributed samples can be determined and provided by contract laboratories equipped with molar mass sensitive detection devices. This very elegant approach has become more popular in recent years and is applied in a number of Pharmacopeia methods, such as for Heparin (5).
Summary
- GPC/SEC requires calibration for molar mass determination.
- The molar masses derived by GPC/SEC are molar masses relative to the calibration standards applied.
- To obtain true molar masses the standards must be of identical chemical structure than the sample to be analyzed.
- If no appropriate narrowly distributed standards are available, an existing calibration curve might be converted using Mark-Houwink parameters from literature sources.
- Alternatively, at least two molar mass averages corresponding to a single or several broadly distributed samples of the analyte’s chemical structure can be applied to convert a previous established calibration.
- A single broadly distributed sample of known cumulative distribution can also be applied to establish a calibration curve for the analyte without before setting up a base calibration.
References
- A.M. Striegel, W.W. Yau, J.J. Kirkland, and D.D. Bly, Modern Size-Exclusion Liquid Chromatography: Practice of Gel Permeation and Gel Filtration Chromatography, Second Edition (Wiley, Hoboken, New Jersey, USA, 2009).
- “GPC/SEC Detection” (e-book 3), PSS Polymer Standards Service GmbH (Mainz, Germany, 2019). https://www.pss-polymer.com/en/about-us/news/news/e-book-3-gpcsec-detection.html
- J. Brandrup, E.H. Immergut, and E.A. Grulke, Eds., Polymer Handbook (Wiley, Hoboken, New Jersey, USA, 4th ed., 2003), Vol. 1.
- W. Radke, D. Held, H. Bock, and P. Kilz, Application Note: “Molecular weight determination for Dextran 40/60/70 according to USP/EP Monograph”, PSS Polymer Standards Service GmbH (Mainz, Germany, 2018). https://www.pss-polymer.com/uploads/tx_pss/pdf/publication/Pharma_Dextran_USP_EP_WinGPC.pdf
- D. Held and F. Gores, Application Note: “EP/USP GPC/SEC Molar Mass Determination for Low Molecular Weight Heparin (LMWH)”, PSS Polymer Standards Service GmbH (Mainz, Germany, 2017). https://www.pss-polymer.com/fileadmin/pdf/publication/PSS_App_Note_Pharma_USP_EP_Heparin_2017.pdf
Daniela Held studied polymer chemistry in Mainz, Germany, and is working in the PSS software and instrument department. She is also responsible for education and customer training.
Wolfgang Radke studied polymer chemistry in Mainz, Germany, and Amherst, Massachusetts, USA, and is head of the PSS application development department. He is also responsible for instrument evaluation and for customized trainings.
E-mail:
Website:
Articles in this issue
over 5 years ago
Advances in Gas Chromatography for Optimal Dioxin GC Separationover 5 years ago
Identifying Algal Bloom Toxins Using LC–HRMSover 5 years ago
Shimadzu’s Danish Expansionover 5 years ago
Vol 16 No 11 The Column November 2020 Europe & Asia PDFover 5 years ago
Vol 16 No 11 The Column November 2020 North American PDFAdvertisement
Related Content
Advertisement


Advertisement
Advertisement
Trending on LCGC International
1
The Silent Crisis: Can The Demise of Chromatography Teaching in Universities Be Reversed?
2
Multiplexed HILIC-HRMS Method Quantifies LPC and CAR Biomarkers for HCC
3
GC-MS Reveals Regional Flavor and Aroma Shifts in Oranges
4
Micro-LC-MS/MS Links 2-AG to Depression, Not Migraine
5