

|Articles|November 1, 2016
- Special Issues-11-01-2016
- Volume 34
- Issue 11
Analyzing Host Cell Proteins Using Off-Line Two-Dimensional Liquid Chromatography–Mass Spectrometry
The use of off-line 2D-LC–MS for the characterization of HCPs and their monitoring during downstream processing
Advertisement
Protein biopharmaceuticals are commonly produced recombinantly in mammalian, yeast, or bacterial expression systems. In addition to the therapeutic protein, these cells also produce endogenous host cell proteins (HCPs) that can contaminate the biopharmaceutical product, despite major purification efforts. Since HCPs can affect product safety and efficacy, they need to be closely monitored. Enzyme-linked immunosorbent assays (ELISA) are recognized as the gold standard for measuring HCPs because of their high sensitivity and high throughput, but mass spectrometry (MS) is gaining acceptance as an alternative and complementary technology for HCP characterization. This article reports on the use of off-line two-dimensional liquid chromatography–mass spectrometry (2D-LC–MS) for the characterization of HCPs and their monitoring during downstream processing.
In contrast to small-molecule drugs that are commonly synthesized by chemical means, protein biopharmaceuticals result from recombinant expression in nonhuman host cells. As a result, the biotherapeutic is co-expressed with hundreds of host cell proteins (HCPs) with different physicochemical properties present in a wide dynamic concentration range. During downstream processing, the levels of HCPs are substantially reduced to a point considered acceptable to regulatory authorities (typically <100 ppm–ng HCP/mg product). These process-related impurities are considered as critical quality attributes because they might induce an immune response, cause adjuvant activity, exert a direct biological activity (such as cytokines), or act on the therapeutic itself (for example, proteases) (1,2). To mention some specific examples, during the clinical development phase of Omnitrope, Sandoz’s human growth hormone biosimilar expressed in E. coli, adverse events associated with residual HCPs were encountered. The European Medicines Agency (EMA) only granted approval after additional purification steps for HCP clearance were incorporated (3–5). Scientists at Biogen Idec demonstrated fragmentation of a highly purified monoclonal antibody as a result of residual Chinese hamster ovarian (CHO) cell protease activity in the drug substance, despite an enormous purification effort undertaken (protein A affinity chromatography with subsequent orthogonal purification steps by cation- and anion-exchange chromatography) (6). The authors of the study state that it is of utmost importance to identify residual protease activity early in process development to allow a revision of the purification scheme or ultimately to knockdown the specific protease gene.
Multicomponent enzyme-linked immunosorbent assay (ELISA) is presently the workhorse method for HCP testing because of its high throughput, sensitivity, and selectivity (1,2). Polyclonal antibodies used in the test are typically generated by the immunization of animals with an appropriate preparation derived from the production cell, minus the product-coding gene. However, ELISA does not comprehensively recognize all HCP species-that is, it cannot detect HCPs to which no antibody was raised, it only provides information on the total amount of HCPs without providing insight in individual HCPs, and, in a multicomponent setup, it has a poor quantitation power. In that respect, MS nicely complements ELISA because it can provide both qualitative and quantitative information on individual HCPs. In recent years, various papers have appeared dealing with the mass spectrometric (MS) analysis of HCPs (2,3,712). These studies typically rely on bottom-up proteomics approaches in which peptides derived from the protein following proteolytic digestion are handled. A clear trend is observed toward the use of upfront multidimensional chromatography to tackle the enormous complexity and wide dynamic range (2,3,7,8,10). Compared to one-dimensional liquid chromatography (1D-LC), two-dimensional LC (2D-LC) drastically increases peak capacity as long as the two dimensions are orthogonal (13). In a 1D chromatographic setup the separation space is dominated by peptides derived from the therapeutic protein, in 2D-LC the increased peak capacity allows one to look substantially beyond the therapeutic peptides and detect HCPs at low levels. Three recent papers using 2D-LC–MS/MS demonstrate that HCPs can be revealed at levels as low as 10 ppm (2,3,7). In these cases, label-free quantification was based on the three most intense tryptic peptides making use of single-point calibration against spiked exogenous proteins.
An off-line 2D-LC–MS/MS setup was used in our laboratory for the characterization of HCPs throughout the downstream manufacturing of a therapeutic enzyme recombinantly expressed in yeast. The workflow is schematically presented in Figure 1. Supernatant was collected at different purification steps. Following desalting of the supernatant, the proteins were reduced using dithiothreitol (DTT) and alkylated using iodoacetamide (IAM) before overnight trypsin digestion. The peptide mixture was subsequently subjected to 2D-LC–MS/MS.
Figure 1: Workflow for the characterization of HCPs using off-line 2D-LC–MS/MS.
In successfully applying 2D-LC, the selectivity of the two separation mechanisms toward the peptides must differ substantially to maximize orthogonality and, hence, resolution. Various orthogonal combinations targeting different physicochemical properties of the peptides have been described. Bottom-up proteomics setups initially relied on the combination of strong-cation exchange and reversed-phase LC to separate by charge in the first dimension and by hydrophobicity in the second dimension (13–15). In recent years, various researchers have shifted their efforts to the combination of reversed-phase LC and reversed-phase LC (13,16–19). The orthogonality in this nonobvious combination is mainly directed by the mobile-phase pH, in this instance, high pH in the first dimension and low pH in the second dimension, and by the zwitterionic nature of the peptides. In contrast to the combination of strong-cation exchange and reversed-phase LC, where the first dimension has an intrinsic low peak capacity, the combination of reversed-phase LC in both dimensions benefits from the high peak capacities of the two independent dimensions, which results in an overall high peak capacity of the 2D setup.
In the characterization of yeast HCPs, we opted to use reversed-phase LC in both dimensions with the first dimension operated at pH 10 and the second dimension at pH 2.6. An acidic pH is preferred in the second dimension since it maximizes MS sensitivity for peptides. Figure 2 shows the first dimension ultraviolet (UV) 214-nm chromatogram of a selected downstream manufacturing sample. A reversed-phase LC column with an internal diameter of 2.1 mm was used, which allowed substantial amounts of sample to be loaded, in this particular case the amount corresponding to 115 µg of protein. The peptides were nicely spread throughout the acetonitrile gradient and 22 fractions were collected and further processed after drying and reconstitution in 50 µL of low-pH mobile-phase A (2% acetonitrile and 0.1% formic acid).
Figure 2: First-dimension reversed-phase LC–UV 214 nm chromatogram of a selected downstream manufacturing sample. HPLC system: Agilent Technologies 1200; Column: 150 mm × 2.1 mm, 3.5-µm Waters XBridge BEH C18; mobile-phase A: 10 mM NH4HCO3 pH 10; mobile-phase B: acetonitrile; flow rate: 200 µL/min; gradient: 5–50% B in 30 min; column temperature: 25 °C; injection volume: 50 µL; fraction interval: 1.5 min (300-µL fractions).
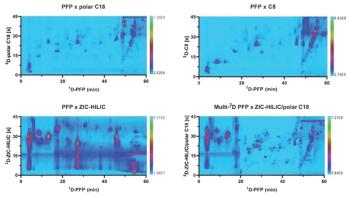
The second dimension consisted of a reversed-phase LC capillary column with an internal diameter of 75 µm, which was directly coupled through a nanospray interface to high resolution quadrupole time-of-flight (QTOF)-MS operated in the data-dependent acquisition (DDA) mode. The LC–MS/MS traces of some selected fractions are shown in Figure 3 illustrating good orthogonality between first and second dimension separations.
Figure 3: Second dimension LC–MS/MS chromatograms of selected fractions (Figure 2). HPLC system: Thermo Scientific Ultimate3000 RSLC nano; MS system: Agilent Technologies 6530 Q-TOF; column: 150 mm × 75 µm, 3-µm Thermo Scientific Acclaim PepMap100 C18; precolumn: 20 mm × 75 µm, 3-µm Acclaim PepMap100 C18 (Thermo Scientific); mobile-phase A: 2% acetonitrile, 0.1% formic acid; mobile-phase B: 80% acetonitrile, 0.1% formic acid; loading solvent: 2% acetonitrile, 0.1% formic acid; flow rate: 300 nL/min (nano pump), 5 µL/min (loading pump); gradient: 0-60% B in 60 min; column temperature: 35°C; injection volume: 20 µL.
The MS system was programmed so that an MS survey measurement preceded three dependent MS/MS acquisitions. Precursors selected twice for collision-induced dissociation (CID) were placed in an exclusion list. Generated MS/MS spectra were subjected to database searching (yeast proteins and therapeutic enzyme sequence) and relative protein quantification was performed from total protein intensities computed by the Spectrum Mill search engine. Total intensity is the sum of intensities for all spectra of peptides belonging to a given protein. Figure 4 shows the evolution of the therapeutic enzyme and some selected HCPs throughout the final stages of purification. Of particular interest, during downstream manufacturing, a nonyeast-derived glycosidase was added to shape the glycosylation profile of the therapeutic enzyme (in between stage 1 and 2). This glycosidase temporarily reduced the purity of the therapeutic enzyme but was rapidly cleared. The HCPs detected were mainly proteases, which influenced stability of the therapeutic enzyme. While some were clearly reduced throughout the process (serine carboxypeptidase 1 and aspartyl peptidase), others were enriched (serine carboxypeptidase 2 and metallopeptidase). While these proteases were present at low levels (<0.1%), stability studies have shown that they act on the protein. With the identity of these proteases revealed, they could be the subject of a gene knockout to increase product stability.
Figure 4: Evolution of the therapeutic enzyme, the exogenous glycosidase, and some selected HCPs throughout the final stages of downstream manufacturing. The numbers on the bars represent the relative abundances and the number of unique peptides identified and quantified. Relative abundances were calculated based on the MS signal of identified peptides. Note: the therapeutic enzyme contains various fully occupied glycosylation sites. These glycopeptides are not identified by the MS/MS search engine and therefore not taken into account in the calculation of relative abundances.
It is important to note that none of the HCPs reported could be identified using 1D-LC–MS/MS operated under exactly the same conditions as reported in the legend of Figure 3. Column load was evidently much lower compared to the 2D-LC–MS/MS analysis (4 µg versus 115 µg).
In conclusion, off-line 2D-LC–MS/MS represents a valuable new tool for the characterization of HCPs and their monitoring throughout downstream processing. The use of multidimensional chromatography substantially increases peak capacity and improves the dynamic range providing access to otherwise unmined HCPs. Based on the output of the 2D-LC–MS/MS experiment, processes can be adjusted and identified HCPs can be incorporated in single product ELISAs or in targeted multiple reaction monitoring (MRM) MS assays for routine monitoring.
References
- F. Wang, D. Richardson, and M. Shameem, BioPharm Int.28, 32–38 (2015).
- Q. Zhang, A.M. Goetze, H. Cui, J. Wylie, S. Trimble, A. Hewig, and G.C. Flynn, mAbs6, 659–670 (2014).
- C.E. Doneanu, A. Xenopoulos, K. Fadgen, J. Murphy, S.J. Skilton, H. Prentice, M. Stapels, and W. Chen, mAbs4, 24–44 (2012).
- M. Pavlovic, E. Girardin, L. Kapetanovic, K. Ho, and J.H. Trouvin, Horm. Res.69, 14–21 (2008).
- J. Geigert, The Challenge of CMC Regulatory Compliance for Biopharmaceuticals and Other Biologics (Springer Science & Business Media, Heidelberg, Germany, 2013).
- S.X. Gao, Y. Zhang, K. Stansberry-Perkins, A. Buko, S. Bai, V. Nguyen, and M.L. Brader, Biotechnol. Bioeng.108, 977–982 (2011).
- M.R. Schenauer, G.C. Flynn, and A.M. Goetze, Anal. Biochem.428, 150–157 (2012).
- J.H. Thompson, W.K. Chung, M. Zhu, L. Tie, Y. Lu, N. Aboulaich, R. Strouse, and W. Mo, Rapid Comm. Mass Spectrom.28, 855–860 (2014).
- V. Reisinger, H. Toll, R.E. Mayer, J. Visser, and F. Wolschin, Anal. Biochem.463, 1–6 (2014).
- C.E. Doneanu and W. Chen, Methods Mol. Biol.1129, 341–350 (2014).
- K. Bomans, A. Lang, V. Roedl, L. Adolf, K. Kyriosoglou, K. Diepold, G. Eberl, M. Mølhøj, U. Strauss, C. Schmalz, R. Vogel, D. Reusch, H. Wegele, M. Wiedmann, and P. Bulau, PLoS One8, e81639 (2013).
- M.R. Schenauer, G.C. Flynn, and A.M. Goetze, Biotechnol. Bioeng.29, 951–957 (2013).
- K. Sandra, M. Moshir, F. D’hondt, R. Tuytten, K. Verleysen, K. Kas, I. François, and P. Sandra, J. Chromatogr. B877, 1019–1039 (2009).
- M.P. Washburn, D.A. Wolters, and J.R. Yates, Nat. Biotechnol.19, 242–247 (2001).
- D.A. Wolters, M.P. Washburn, and J.R. Yates, Anal. Chem.73, 5683–5690 (2001).
- N. Delmotte, M. Lasaosa, A. Tholey, E. Heinzle, and C.G. Huber, J. Proteome Res.6, 4363–4373 (2007).
- M. Gilar, P. Olivova, A.E. Daly, and J.C. Gebler, Anal. Chem.77, 6426–6434 (2005).
- G. Vanhoenacker, I. Vandenheede, F. David, P. Sandra, and K. Sandra, Anal. Bioanal. Chem.407, 355–366 (2015).
- K. Sandra, K. Mortier, L. Jorge, L.C. Perez, P. Sandra, S. Priem, S. Poelmans, and M.P. Bouche, Bioanalysis6, 1201–1213 (2014).
Koen Sandra is Director at the Research Institute for Chromatography (RIC) in Kortrijk, Belgium.
Alexia Ortiz is a Proteomics Researcher at the Research Institute for Chromatography (RIC).
Pat Sandra is Chairman at the Research Institute for Chromatography (RIC) and Emeritus Professor at Ghent University in Ghent, Belgium.
Articles in this issue
almost 10 years ago
Advances in Biopharmaceutical Analysisalmost 10 years ago
Higher Order Mass Spectrometry Techniques Applied to BiopharmaceuticalsAdvertisement
Related Content
Advertisement


Advertisement
Advertisement