

|Articles|January 1, 2011
- LCGC North America-01-01-2011
- Volume 29
- Issue 1
New Directions in Whole Blood Analysis: Dried Blood Spot Analysis and Beyond
Author(s)Ronald E. Majors
New methods are available for whole blood analysis. Here, various approaches are compared and contrasted.
Advertisement
The analysis of drugs and drug metabolites in biological fluids is important in preclinical and clinical studies in the pharmaceutical industry. Conventionally, drug exposure in human and animal studies has been determined in plasma for practical reasons. However, there have been a number of recent reports demonstrating the practical sampling and subsequent transport and analysis of whole blood. In pharmacokinetic (PK) and toxicokinetic (TK) studies, rodents are the animals most used for preclinical testing. Small rodents such as mice have a limited blood supply. Typically samples of 200–250 µL (total volume up to 1500 µL) are needed for TK testing. To obtain a blood sample volume, the animal must be warmed for 10 min before sampling. Often several rats or mice must be pooled to obtain enough blood for testing. Clearly, using less blood for these tests would save on animal usage and the associated costs of housing, handling, and dosed test substance. Further, the decreased blood volume enables serial sampling from fewer animals, which leads to improved exposure data. It also raises the possibility of sampling from central study animals, rather than using extra satellite animals for the determination of exposure only. In clinical testing for neonatal humans, a large amount of blood is never available. Thus using a reduced volume of blood would enable more pediatric studies for metabolic and other testing.
Ronald E. Majors
A similar benefit can also be realized in critically ill patients. Further, the requirement for small blood volumes opens the possibility of sampling from finger and heel pricks rather than canulla, which in turn leads to improved study recruitment, patient compliance, and improved exposure data because more sampling points can be obtained. A further benefit for therapeutic drug monitoring is that the patient may be able to self-sample at home.
The question of whether to use plasma or whole blood for analytical measurements is often asked. Some studies have shown that a number of drugs tend to distribute evenly between plasma and blood cells while other studies show that some drugs bind selectively to plasma proteins. Reports have also shown that drugs such as immunosuppressants bind predominantly to blood cells. Conventionally, plasma has been used for drug metabolism (DM) and PK–TK studies because of its ease of handling, shipping, and storage compared to whole blood. However, regulatory authorities in both the ICH (1) and the FDA (2) note that blood is an acceptable biological matrix for measurement of drug exposures. So in some cases, the use of whole blood for analysis in DMPK and TK studies could be preferable.
Traditional Whole Blood Analysis
Figure 1 depicts the various ways to analyze and process whole blood. Traditional approaches are shown in the middle of the figure. It should be noted that whole blood is not routinely used for drug bioanalysis, as it tends to be very difficult to manipulate and subsample after freezing; many drugs and their metabolites are unstable if whole blood is stored at room temperature. Dialysis, liquid–liquid extraction, precipitation, (hemo)lysis, membrane filtration, and anticoagulation are the more traditional approaches. Such approaches generally require larger volumes of blood and multiple, time-consuming steps where analyte losses may occur. Many of the traditional methods are performed manually, but obviously when faced with large numbers of samples, automation via robotics or other approach may be warranted. All these approaches end up with a matrix-depleted (preprocessed) sample. Depending on the final analytical technique used for measurement of drugs and metabolites, some additional sample preparation such as solid-phase extraction (SPE) may be required for cleanup and preconcentration. In recent years, liquid chromatography–tandem mass spectrometry (LC–MS-MS) has been used for further separation and detection. The heightened sensitivity and selectivity of this hyphenated method has been a boon to trace analysis. In fact, in many fields this combination has become the norm for trace analysis. Using LC–MS-MS, one can often determine parts-per-billion levels of compounds in biological samples, even without extensive sample cleanup. For quantitative analysis, LC–MS-MS is a must.
Figure 1: Various experimental approaches for processing whole blood. (Reproduced from reference 18 by permission of the authors.)
However, these traditional techniques for whole blood analysis still don't meet the needs for small volumes of whole blood samples. The purpose of this installment of "Sample Prep Perspectives" is to introduce some more-recent technologies that use a much lower amount of blood sample than previously considered.
Dried Blood Spot Analysis
The use of dried blood spot (DBS) analysis was described in 1913 by Bang (3) in the estimation of blood glucose concentration. However, the most prominent use of dried blood spots dates to the early 1960s when Dr. Robert Guthrie developed an assay for the detection of phenylketonuria (4). His application of collecting blood on filter paper led to the population screening of newborns for the detection of inherited metabolic diseases. In recent years, the collection of blood on filter paper has become a significant tool for screening individuals for clinical purposes, for animal testing for preclinical purposes, for therapeutic and illicit drug monitoring, and for the potential application to routine drug development. Today, pressure in the pharmaceutical industry to deliver high-quality PK data in the shortest possible timeframe is requiring workers in the field to accurately and precisely collect, share, store, and analyze thousands of biological samples. In addition the movement to reduce, refine, and replace the use of animals in drug development is challenging analysts to collect adequate samples while remaining within acceptable total blood collection volumes and avoiding excess animal usage. Thus DBS analysis is a way to address these challenges in the pharmaceutical industry. In addition, the use of techniques picked up in performing DBS analysis is extending this approach to other fields.
As shown in the left side of Figure 1, dried blood spot handling and analysis is fairly simple and involves only a few steps. A finger or a heel prick followed by blood flow into a glass capillary is one method of collection (although sometimes a pipette tip is used) that is enabled by the technique, although conventional sampling via canulla is also common. Generally the site of sampling in animals is the same as that used for plasma sampling. However, the nature of the technique facilitates the collection of much smaller volumes (typically <80 µL). For rodent studies, a tail prick is preferred. Thus, the use of a syringe for venous blood drawing is not required. Depending on the size of the capillary, a sufficient amount of blood is drawn to allow multiple spottings. Usually, only a few tens of microliters are needed. Blood is sometimes collected from the subject in a microvessel. As shown in Figure 2, after collection, the blood is spotted onto the DBS filter paper. A typical card, shown in Figures 2a and 2b, would allow for the application of as many as four blood spots (Figures 2c and 2d). Typically 10–30 µL of blood is applied for each spot. The blood is delivered by the capillary (or sometimes a micropipette). To obtain a homogeneous sample, it is of utmost importance to avoid letting the capillary touch the filter paper. A typical blood spot is in the range of 5–9 mm in diameter depending on the volume of blood spotted and the characteristics of the paper substrate used. Next the blood spots are allowed to dry for a period of 2 h at room temperature. Drying racks are available for this purpose. When the blood is treated in this manner, it can be stored for long periods of time at room temperature without degradation. To ship or store loaded cards, they should be placed in sealable plastic bags containing a desiccant. For analysis, a circular portion (disk) of each dried blood spot is punched out (Figure 2e) into a vial or well of a 96-well plate. A typical punch size is a 3–6 mm disk. The disk size can be optimized based on the required lower limit of detection and available spotted blood volume. With a trained technician, manual punch times are typically 10–15 min for 96 samples. An organic solvent, typically methanol or a methanol–water mixture containing an internal standard, is used to elute the analytes of interest. Extraction solvent volumes are in the range of a few hundred microliters. Studies have shown that using the DBS technique, spot sample sizes are usually reproducible to ±5–10% (5,6).
Figure 2: DBS card construction and steps in the processing of whole blood samples: (a) card dimensions, (b) spotting of whole blood in spot outline, (c) as many as four blood samples can be spotted, (d) completed blood spotting to be dried for 2 h, (e) punching out blood spot disks for extraction and further analysis. (Images courtesy of Neil Spooner, GlaxoSmithKline, Ware, UK.)
The DBS methods have been validated by demonstrating that the same size punches taken from spots derived from 10, 15, and 20 µL of blood provide the same analytical result (that is, no bias). This enables simplicity in sample collection for animal technicians and medical practitioners because it takes pressure off of them to deliver an accurate volume while working in a busy animal room or clinic.
Table I shows the many advantages of the DBS technique compared to conventional plasma analysis. A disadvantage of the DBS analytical technique is that it is not a preconcentration technique and thus often requires a highly sensitive analytical technique (for example, LC–MS-MS) that may be beyond the capabilities of some laboratories. However, LC–MS is becoming the standard analytical technique for all sorts of trace analysis. Presumably, the use of micro-SPE would enable some additional cleanup of the matrix-depleted DBS extract. Other considerations are that the technique cannot be used for volatile and air-sensitive compounds and certain unstable metabolites. Photosensitive compounds may require special handling. However, this aspect of DBS analysis needs further study.
Table I: Comparison of conventional blood analysis and DBS analysis
Currently, specialty DBS card formats are available commercially as depicted in Table II. As shown in Figure 2a, all DBS cards designed for drug bioanalysis are of a standardized dimension with the cellulose filter paper housed in a cardboard holder. So far only two companies have commercialized DBS specialty products although it is understood that others are working on new card materials. A plastic-coated card is under development that would more adequately protect the DBS paper during shipment and storage; however, drying times may be affected by such an arrangement. The two commercial cards with additives are are known to have additional antimicrobial activity compared with the untreated papers.
Table II: Specialty DBS cards commercially available
The DBS sample collection technique has been validated for a number of pharmaceutical compounds, and numerous studies have shown good correlation between DBS results and those of conventional blood plasma analysis methods. For example, one study showed a direct comparison of conventional blood analysis techniques versus blood spotting techniques for the quantitation of 12 pharmaceutical compounds tested in vivo in rats (7). Overall an excellent correlation was achieved between DBS and blood–water samples. Another study compared DBS and whole blood and plasma analysis for toxicokinetic studies of the drug omeprazole performed in vivo in rats (8). For the conventional plasma analysis 240 µL of blood was used but only 60 µL was required for the classic DBS card (four spottings). The analysis of drug eluted from the DBS card was performed by LC–MS-MS. The ratio of blood to plasma concentrations was calculated by the average of the DBS blood concentration to plasma concentration quotient, and predicted blood concentrations were obtained by applying this ratio to the plasma concentrations. Figure 3 shows the TK curves obtained from three measurements where the blood concentrations obtained by DBS samples and liquid whole blood samples were plotted along with the prediction-based plasma sample concentrations. Note that for this example, omeprazole is bound exclusively to plasma proteins. For 18 samples, the overall averages in percent differences between predicted, DBS, and blood plasma were less than 10%, indicating good correlation. In their studies of hemoglobin folate concentrations, when values obtained for DBS hemoglobin folate values were plotted against venous sample hemoglobin folate values, O'Broin and Gunter (9) found a good linear correlation (r =0.97, y =0.93x + 88) at the 2000–8000 pmol/g levels). Spooner and colleagues (10) developed a quantitative analytical reversed-phase LC–MS-MS assay for pharmokinetics requiring only 15 µL of sample for acetoaminophen at the concentration range of 25–5000 mg/mL in human blood. The method was entirely acceptable based on meeting internationally accepted criteria (precision, accuracy, linearity, sensitivity, and selectivity), and studies of analyte and metabolite stability in DBS samples, the effect of blood spotting volume, the spotting device (pipette and capillary), and the temperature of blood spotted all showed that high quality quantitative data can be obtained with this technique.
Figure 3: Comparison of omeprazole TK curves obtained from three sample types. (Adapted from reference 8.)
Because large numbers of samples are encountered in DMPK–TK studies, manual loading and punching dried blood spots can become a tedious task. Thus, some form of semiautomation or full automation is desired. One such automation device from BSD Robotics (Acacia Ridge, Queensland, Australia) that partially fulfills this requirement is the BSD600 semiautomated and the BSD1000 fully automated filter paper punch. The latter device will punch out 96 blood disks in 15–20 min. A 100-card magazine is available for storing DBS cards before they are punched. The disks can be directed into a 96-well plate. The automated process saves considerable time and tedium compared to manual punching and transfer. Hudson Robotics (Springfield, New Jersey) has introduced the Dried Blood Spot Processor, which also identifies, punches, and inserts the DBS samples into a 96-well plate. The product has an electrically activated punch, a computer-controlled table to position the microplate, and bar-code scanners. The sample identification is automatically linked to the plate location. Spark-Holland (Emmen, The Netherlands) has tested some concepts where the DBS card itself is extracted (without punching) on-line directly into the sample loop of an LC valve or into an SPE cartridge for further cleanup (11). In its present configuration only a small portion of the blood spot is extracted, but initial experiments look promising.
Prolab Instruments (Reinach, Switzerland) has more fully developed a similar instrument called the SCAP (sample card and prep), which is based on the PAL XYZ robotic platform (CTC Analytics, Zwingen, Switzerland) and sold by LEAP Technologies (Carboro, North Carolina). The SCAP DBS instrument directly elutes the analytes of interest from the dried blood spot on the filter paper using an on-line device that allows liquid to flow through the spot and then transfers the eluent to a multicolumn system for further separation and analysis (12). The heart of the system is depicted in Figure 4.
Figure 4: LEAP CTC Robotic Prolab SCAP DBS station workflow: (a) picks up sample from rack, (b) places card into clamp module, (c) DBS extraction, (d) sample card returned to rack. (Courtesy of LEAP Technologies.)
Direct DBS card analysis is also being investigated where the analytes could be removed directly from the card and ionized in the gas phase (13). For example, thermal desorption, laser desorption, liquid- or gas-jet desorption, or a paper spray could desorb analytes from the DBS card directly into the mass spectrometer source. These approaches could transfer the analytes by volatilization or some sort of ionization. Another approach would be liquid desorption from the DBS spot by an interface that would lower an extraction head directly onto the paper to desorb analytes into a liquid stream (14). Camag (Muttenz, Switzerland) has developed a thin-layer chromatography–MS liquid desorption interface that has the potential to automate the elution step in the DBS process. So, a number of automation approaches are being developed with some further along than others. Automation of DBS will be a hot area in the future of whole blood analysis.
The DBS technique has been generating a great deal of interest, especially among large pharmaceutical companies. At the European Bioanalysis Forum, a workshop was held June 17–18, 2010, in Brussels, Belgium. The workshop, entitled "Connecting Strategies on Dried Blood Spots," attracted researchers from a wide variety of companies, including GlaxoSmithKline, Pfizer, Novartis, Covance, Sanofi-Aventis, Bristol Myers Squibb, Abbott, and several others (15). The presentations touched on all phases of pharmaceutical development and showed that many of these companies are already implementing DBS in their drug discovery and drug development activities including DMPK and TK studies, in early clinical development, in clinical pathology, and in therapeutic drug monitoring.
An alternative procedure to generate a dried blood sample is to take 20 µL of whole blood and add to it 200 µL of a mixture of zinc sulfate in methanol containing an internal standard. After vortexing and centrifugation (5 min), the supernatant is dried using a vacuum centrifuge (5 min). The resulting dried blood sample can be shipped the same way as a dried DBS card and can be reconstituted and extracted easily (16).
Figure 5: On-line SPEâLCâUV of antimycotics in plasma and CDB samples after direct injection onto restricted access material (RAM) SPE column. SPE column: 20 mm Ã4 mm, 25-µm dp LiChrospher RP4 ADS; flow rate: 2.0 mL/min. Analytical column: 150 mm Ã4.6 mm, 3-µm dp Dionex Acclaim 120 C8, 120 à flow rate: 1.2 mL/min; temperature: 40 °C. Mobile phase (fractionation): 98:2 (v/v) waterâacetonitrile; mobile phase (transfer): 0.01 M ammonium acetateâ acetonitrile (gradient). Injection volume: 50 µL. (Reproduced from reference 18 with permission of the authors.)
The Cell-Disintegrated Blood Technique
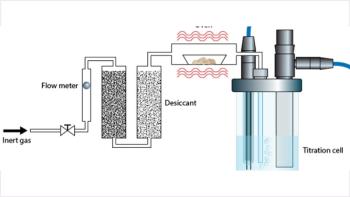
On the right hand side of Figure 1, a new approach in the sample processing of whole blood for direct SPE–LC analysis has received some attention. The cell-disintegrated blood technique developed by K.-S. Boos and coworkers of the Institute of Clinical Chemistry, University Hospital (Munich, Germany) is very simple, yet effective (17). In this procedure, a 25-µL sample of sedimented, anticoagulated whole blood sample is mixed in an autosampler before injection and an internal standard is added. Then, the homogenized blood sample is pumped through a heated stainless steel capillary (75 °C, dimensions: 300 mm × 0.5 mm). The resulting heat shock induces cell disintegration and generates a novel matrix that the authors call "cell-disintegrated blood" (CDB). An almost complete disintegration of the cellular blood components occurs during the heating process. No precipitation of blood proteins occurs. The CDB has no erythrocytes, no leucocytes, and only a couple of percent of thrombocytes remaining after the heat shock treatment. The membrane fragments that result from the heat treatment form subcellular particles. The flow rate, sample volume, volume of the heating chamber, and feed pipe volume have to be optimized for the CDB to be properly formed. For example, with a 2-µL sample, a 59-µL heated-chamber volume, and a 14-µL feed-tube volume, at a flow rate of 0.28 mL/min, the residence time of the blood in the tubes has been optimized to be 16 s. Next, the CDB is cleaned up in an on-line SPE chamber where the target analytes are selectively extracted. The analytes are then transferred to an analytical HPLC system where they are separated and then detected and quantitated by tandem mass spectrometry. The cell disintegration system is called the BloodLyser and the operation from the blood sample to the analysis can be totally automated using an on-line setup (18).
Table III: Advantages of the cell-disintegration approach to blood processing compared to conventional methods
The CDB can be stored at least one week at room temperature or frozen. Blood from humans, different types of rats, mice, guinea pig, and dog have been treated using the BloodLyser process. The procedure appears to be independent for each hematocrit level and type of blood processed. A similar process using cryogenic treatment of the anticoagulated blood also results in CDB. Here the blood sample is aspirated into a hollow stainless steel needle by a dedicated autosampler (LEAP Technologies). The needle is immersed into liquid nitrogen and the blood sample is "snap-frozen." After this treatment, the sample is thawed, and the resulting fluid is CDB. The authors refer to this procedure as the BloodIcer technique (18).
Table IV: Additional advantages of the cell-disintegration approach compared to DBS analysis
The CDB technique has been used for therapeutic drug monitoring and is especially suited for drugs predominantly bound to blood cells (for example, immunosuppressants bound to erythrocytes) and drugs bound to proteins present in blood plasma (for example, antimycotics). Table III provides a listing of some of the advantages of the technique compared to conventional blood plasma methods, and Table IV lists some additional advantages of the CDB technique compared to the DBS method. On the other hand, Table V discusses some of the advantages of the DBS approach compared to the CDB technique.
Table V: Advantages of the DBS approach to blood processing compared to cell disintegration
The CDB technique has also been compared to conventional plasma assays, and the data compare favorably (18). Table VI shows some comparable data for the analysis of the drugs rapamycin and tacrolimus by protein precipitation and by the CDB technique. The data from four patients compare very favorably in terms of the quantitative results. Both extracts were subject to SPE–LC–MS-MS analysis after preparation. In another study, coefficients of variation for the CDB method for intra-day precision for four drugs at four concentrations in blood showed average CVs of 3.8% for the heated capillary method (BloodLyser) and 2.5% for the snap-frozen technique (BloodIcer), while for the conventional whole blood analysis the CV% was 6.0%. Accuracy and recoveries for the CDB methods were all within acceptable standards.
Table VI: Analysis of immunosuppressants: comparisons of methods and sample matrices
Two sets of chromatograms are depicted in Figure 5 (18). The figure shows plasma extracts and CDB extracts for two patients. The upper trace represents the plasma data, and the bottom traces represent the CDB data. Here instead of MS detection, the concentrations of antimycotics were sufficient to detect by LC–UV. The chromatograms were quite reproducible for both types of blood processing methods. Thus, one should expect similar results using either technique as has been experimentally shown.
Future of New Blood Sampling Technologies
The advantages of using smaller samples of blood for preclinical and clinical tests should spur further developments in this area. The current success of these new blood sampling technologies has been overwhelming, especially for DBS analysis, which has been around longer and has been more thoroughly studied than the CDB technique. Just to illustrate this point, some selected published applications of the DBS approach are listed in Table VII. The technique has become well accepted throughout the pharmaceutical industry as evidenced by the many publications and workshops. Numerous studies have shown that drugs and their metabolites, including predrugs and acyl glucuronides, are stable at room temperature when in a dried state, especially with the chemically treated DBS cards that also deactivate enzymes and kill viruses and bacteria.
Table VII: Typical examples of the use of dried blood spots
The idea of spotting biological fluids on paper has already advanced beyond blood. Matrices such as plasma, urine, bile, cerebral spinal fluid, and mother's milk all have been investigated with successful results. These simple spotting techniques for other analytes and matrices could become quite popular for general purpose sample processing given the progress in mass spectrometry coupled to HPLC. Still, further work has to be done in automating the predominantly manual DBS technique. When faced with hundreds and perhaps thousands of samples, nobody wants to spend their time manually spotting cards, drying them, punching out disks, and desorbing analytes when automation could relieve the drudgery and undoubtedly improve the results. As discussed earlier, a number of companies are actively working on DBS automation.
A technique that I didn't explore is the application of the QuEChERS (quick, easy, cheap, effective, rugged, and safe) method to whole blood analysis. Although this technique was developed for the determination of pesticides in fruits and vegetables, its use has quickly spread to other analytes and complex matrices (29). For example, Plossl and coworkers (30) used a method based on QuEChERS to measure pharmaceuticals in whole blood using gas chromatography with ion-trap MS for separation and detection. They successfully determined a variety of drugs in blood with typical detection limits of less than 20 ng/mL. It will be interesting to see if others pick up on this approach to whole blood analysis.
The CDB technique is much newer and the current developments going on in automation, especially on a commercial scale, could yield wider acceptance of this technique. It is a simple, yet effective technique, but more studies have to be done on a wider variety of drug compounds and their metabolites to ensure that the heat shock and cryogenic treatment is not detrimental to drug stability and quantitation. In addition, the blood sample must still be transported from the point of collection to the analytical laboratory for the CDB process to be performed. Because of enzymic and chemical processes that take place in liquid media, whole blood cannot be stored for long periods of time at room temperature but must be frozen for transport; frozen whole blood is difficult to work with in the laboratory. Perhaps its use in drug discovery is warranted where samples are often analyzed just down the hall from where they are collected and in a short timeframe after collection. The CDB technique for drug development and therapeutic drug monitoring needs to be discussed more widely from the basis of a practical implementation.
Acknowledgments
I would like to acknowledge the helpful comments of Dr. Neil Spooner of GlaxoSmithKline (Ware, United Kingdom), a pioneer in the applications of DBS to pharmaceutical analysis, and Prof. Karl Siegfried Boos, Institute of Clinical Chemistry, University Hospital (Munich, Germany), a leader in the applications of chromatography and sample preparation to the clinical analysis environment. Their experience in blood analysis helped to clarify some of the details of these new sampling approaches.
Ronald E. Majors "Sample Prep Perspectives" Editor Ronald E. Majors is Senior Scientist, Columns and Supplies Division, Agilent Technologies, Wilmington, Delaware, and is a member of LCGC's editorial advisory board. Direct correspondence about this column via e-mail to
References
(1) ICH Harmonized Tripartate Guideline, Code S3A, 1994.
(2) FDA Fed. Regist. 60, 11264 (1995).
(3) I. Bang, Biochem. Ztschr. 49, 19–39 (1913).
(4) R. Guthrie and A. Susi, Pediatrics 32, 338–343 (1963).
(5).
(6) C. Bowen, Am. Lab. 42(10), 11–14, (2010).
(7) C.A. Evans, "The Application of Dried Blood Spots for Quantitation of Xenobiotics—A Paradigm Shift within Pre-Clinical DMPK", The Delaware Valley Drug Metabolism Discussion Group, February 11, 2010.
(8) L.M. Patrone, "Direct Comparison of DBS Analysis to Plasma and Whole Blood Analysis in Toxicokinetic Studies of Rats," EBF Workshop Connecting Strategies on Dried Blood Spots, June 17–18, 2010, Brussels, Belgium.
(9) S.D. O'Broin and E.W. Gunter, The American Journal of Clinical Nutrition 70(3), 359–367 (1999).
(10) N. Spooner, R. Lad, and M. Barfield, Anal.Chem. 81(4), 1557–1563 (2009).
(11) B. Ooms, "On-Line DBS-SPE-MS/MS: Feasibility of a Concept for Rapid DBS Analysis without Punching," EBF Workshop Connecting Strategies on Dried Blood Spots, June 17–18, 2010, Brussels, Belgium.
(12) M. Glinski, W. Dobelin, and N. Ganz, "Fully Automated Direct Application of Dried Blood Spots Combined with HPLC Coupled to Tandem Mass Spectrometry for the Simultaneous Quantification of Bosentan and its Metabolites," presented at Montreaux LC/MS 2010, November 10–12, 2010.
(13) P. Abu-Rabie, "Direct Quantitative Bioanalysis of Drugs in Dried Blood Spot Samples," EBF Workshop Connecting Strategies on Dried Blood Spots, June 17–18, 2010, Brussels, Belgium.
(14) P. Abu-Rabie and N. Spooner, Anal.Chem. 81(24), 10275–10284 (2009).
(15) F. Picard, C. Emotte, O. Heudi, T. Majumdar, W. Li, and M. Hayes, "An Overview of the Implementation of DBS at Novartis: Results and Next Step," Workshop Connecting Strategies on Dried Blood Spots, June 17–18, 2010, Brussels, Belgium.
(16) K.-S. Boos, private communication, December 17, 2010.
(17) R. Morello, J. Milojkovic, and K.-S. Boos, Therapeutic Drug Monitoring 29, 505 (2007).
(18) R. Morello and K.-S. Boos, Separation Science Singapore 2010, Biopolis, August 5–6, 2010.
(19) A.J. Wilhelm, J.C.G. den Burger, R.M. Vos, A. Chahbouni, and A. Sinjewel, J. Chromatogr. B 877, 1595–1598 (2009).
(20) J. Deglona, A. Thomasa, A. Cataldob, P. Mangina, and C. Staubam, J. Pharm. And Biomed. Analysis 49(4), 1034–1039 (2009).
(21) W. Ayele, R. Schuurman, T. Messele, W. Dorigo-Zetsma, Y. Mengistu, J. Goudsmit, W.A. Paxton, M.P. de Baar, and G. Pollakis, J. Clinical Microbiol. 45(3), 891–896 (2007).
(22) C. Smith, "Metabonomic Analysis of Dried Biofluid (Blood, Plasma, Urine) Spots", EBF Workshop Connecting Strategies on Dried Blood Spots, June 17–18, 2010, Brussels, Belgium.
(23) M.F. Suyagh, G. Iheagwaram, P.L. Kole, J. Millership, P. Collier, H. Halliday, and J.C. McElnay, Anal. Bioanal. Chem. 397, 687–693 (2010).
(24) M. Barfield, N. Spooner, R. Lad, S. Parry, and S. Fowles, J. Chromatogr. B 870, 32–37 (2008).
(25) G.S. AbuRuz, J. Millership, and J. McElnay, J. Chromatogr. B 832(2), 202–207 (2006).
(26) R.A. Thakur, M. Koleto, D. Dong, B. Begley, and L. Koetzner, Current Trends in Mass Spectrometry (supplement to LCGC North America), 14–17 (October 2010).
(27) B.R. Hoffman, H. Yu, and E.P. Diamandis, Clinical Chem. 42(4), 536–544 (1996).
(28) R.S. Plumb, P.D. Rainville, and C.A. Evans, Current Trends in Mass Spectrometry (supplement to LCGC North America), 22–27 (July 2010).
(29) S.J. Lehotay, M. Anastassiades, and R.E. Majors, LCGC North America 28(7), 504 (2010).
(30) F. Plossl, M. Giera, and F. Bracher, J. Chromatogr. A 1135(1), 19–26 (2006).
Articles in this issue
over 15 years ago
Making Elephants Flyover 15 years ago
Analytical Method Validation: Back to Basics, Part IIover 15 years ago
Optimization of Asymmetrical Flow Field-Flow Fractionationover 15 years ago
Hydrogen Carrier Gas and Vacuum Compensationover 15 years ago
Vol 29 No 1 LCGC North America January 2011 Regular Issue PDFAdvertisement
Related Content
Advertisement

Webcasts

Advertisement
Advertisement
Trending on LCGC International
1
AI/ML in Practice: Machine-learning Prediction of Chromatographic Retention Times for Small Molecules in Pharmaceutical Applications
2
Chromatography's Role in Spotting False Leachables
3
Fast GC-MS/MS Detects PFAS in Food Packaging
4
Emerging Contaminants and the Shifting PFAS Landscape
5