Volatile Organic Compound and Sensory Profiles of Alcoholic Versus Non-Alcoholic Beer Using Immersive TF-SPME and SBSE
Non-alcoholic (NA) beers, driven by consumers seeking healthier alternatives, have surged in the market. To gain consumer approval, brewers must craft NA beers that mirror the flavor of alcoholic counterparts while remaining free of “off” odors. Volatile organic compounds (VOCs) play a pivotal role in beer flavor. Analyzing VOC disparities can aid brewers to enhance NA beer quality. This study compared VOCs in NA beers to their alcoholic counterparts. The differences in VOC and sensory profiles were assessed using immersive stir-bar sorptive extraction (SBSE) and thin-film solid-phase microextraction (TF-SPME) using gas chromatography-olfactometry–mass spectrometry (GC-O–MS).
Beer contains a wide range of volatile organic compounds (VOCs) formed during brewing, including esters, ketones, acids, and terpenes. Therefore, each beer’s ingredients and brewing methods will produce unique aromas (1). However, when beers are dealcoholized, many of these unique aromas are lost in the process. Common methods to dealcoholize beer include vacuum distillation, filtration, and modified fermentation, where the former two preserve more of the original flavor, and the latter inhibits flavor formation and requires flavor additives (2). Studies have shown that non-alcoholic (NA) beers have lower concentrations of isoamyl acetate, esters, alcohols, fatty acids, and phenolic components than alcoholic versions (3,4). Small and large breweries only began to widely introduce NA beers to the market around 2010 (5). Since their introduction, these beverages have seen a swift rise in popularity. To enhance product development and further grow this market, it is vital to distinguish the varying flavor profiles between the two types of beers.
A common and effective extraction technique for volatile and semi-volatile components in beer is solid-phase microextraction (SPME) (3). However, many NA beers possess off-odors that are present at extremely low concentrations, and often SPME does not have the capacity to extract such compounds. To mitigate this, more sensitive extraction techniques, such as immersive SBSE and thin-film solid-phase microextraction (TF-SPME), are used to extract off-odors. This work investigates differences in alcoholic and NA beers produced by different dealcoholization processes. An immersive SBSE/TF-SPME extraction was utilized to concentrate analytes for gas chromatography–olfactometry-mass spectrometry (GC-O–MS). Peak areas were determined for each compound identified to compare flavor component differences in alcoholic and NA varieties.
Experimental
The automated system consisted of a multi-purpose sampler (MPS Roboticpro, Gerstel), Thermal Desorption Unit (TDU 2, Gerstel), and an olfactory detection port (ODP 4, Gerstel) coupled to a GC–MS system (8890 GC and 5977 MSD, Agilent Technologies). A 10 mL aliquot of alcoholic and NA beer samples were transferred into individual 10 mL screw-capped vials. A polydimethylsiloxane (PDMS) Twister stir bar (Gerstel) was immersed in each sample. A PDMS hydrophilic lipophilic balanced (PDMS/HLB) TF-SPME membrane was suspended in the vial with a holder. The vials were placed on a 20-position Twister stir plate (Gerstel) at room temperature. The samples were stirred at 1100 rpm for 1 h. After extraction, the Twister and the TF-SPME devices were removed, rinsed with water, and blotted dry before placing each in an empty thermal desorption unit (TDU) tube. The TDU tubes were sealed with a transport adapter and placed in a 40-position tray on the MPS Roboticpro for automated analysis.
The Twister and TF-SPME devices were desorbed in solvent vent/dry purge mode with a 50 mL/min helium flow at 250 °C with a hold time of 5 min. Analytes were cold trapped in the cooled injection system (CIS 4, Gerstel) inlet at -120 °C on a glass bead-filled liner. When desorption was complete, analytes were transferred to the column in split mode (50:1) by rapidly heating the inlet to 275 °C with a hold time of 3 min. A 30 m × 0.25 mm × 0.25 μm HP-5MS UI column (Agilent Technologies) was used with the following oven programme: 40 °C starting temperature with a hold time of 1 min, followed by 10 °C/min ramp to 280 °C, with a final hold time of 3 min. The column effluent was split 2:1 between the ODP 4 and MS, respectively. The ODP transfer line was heated to 250 °C. The mixing chamber was heated to 150 °C and purged with humidified nitrogen to prevent olfactory fatigue and nasal dehydration.
Results and Discussion
Figure 1 shows the stacked view of total ion chromatograms (TICs) obtained for three replicates of the pilsner alcoholic beer. This provides a visual of the good reproducibility obtained for the analysis. Figure 2 shows the stacked view of TICs obtained for the alcoholic (top) and NA (bottom) pilsners. Table 1 shows the relative peak areas of the compounds identified in both, normalized to the alcoholic version. In the alcoholic pilsner, ethanol, several esters, isoamyl alcohol, fatty acids, and phenylethyl alcohol were identified. Compounds such as hexanoic, octanoic, and decanoic acids are released into the beer during maturation and add creamy, cheesy, waxy, and goat-like characteristics. These short-chain
fatty acids exhibit poor peak shape on the non-polar column phase used in this study, but the peaks are reproducible and analytically useful. Esters are released in the beer during fermentation, often producing fruity notes exhibiting banana and pear-like qualities (6). In the NA pilsner, ethanol was removed via a vacuum distillation dealcoholization process. By distilling under a vacuum, ethanol can be removed at a lower temperature, but heat is still applied. While it is gentler than a standard distillation, volatiles can still be lost in the process and other compounds, such as furans, can be produced to to Maillard reactions (3). To compensate for the volatiles lost during the alcoholization process, brewers will add flavorings, which are often diluted in food-grade propylene glycol or glycerin. New compounds in the NA pilsner include propylene glycol, 4-vinyl guaiacol, γ-nonalactone, 2-furanmethanol, and 5-hydroxymethylfurfural. 4-vinylguaiacol and γ-nonalactone are common flavor compounds in beer that can be added after dealcoholization and 2-furanmethanol and 5-hydroxymethylfurfural are furans, which are common Maillard reaction products (3).

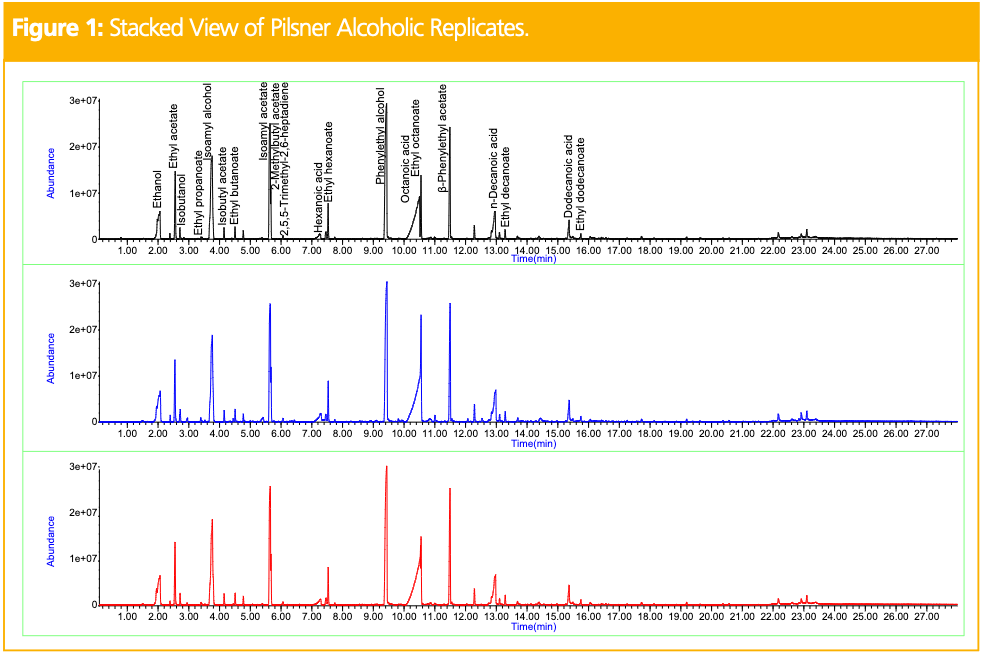


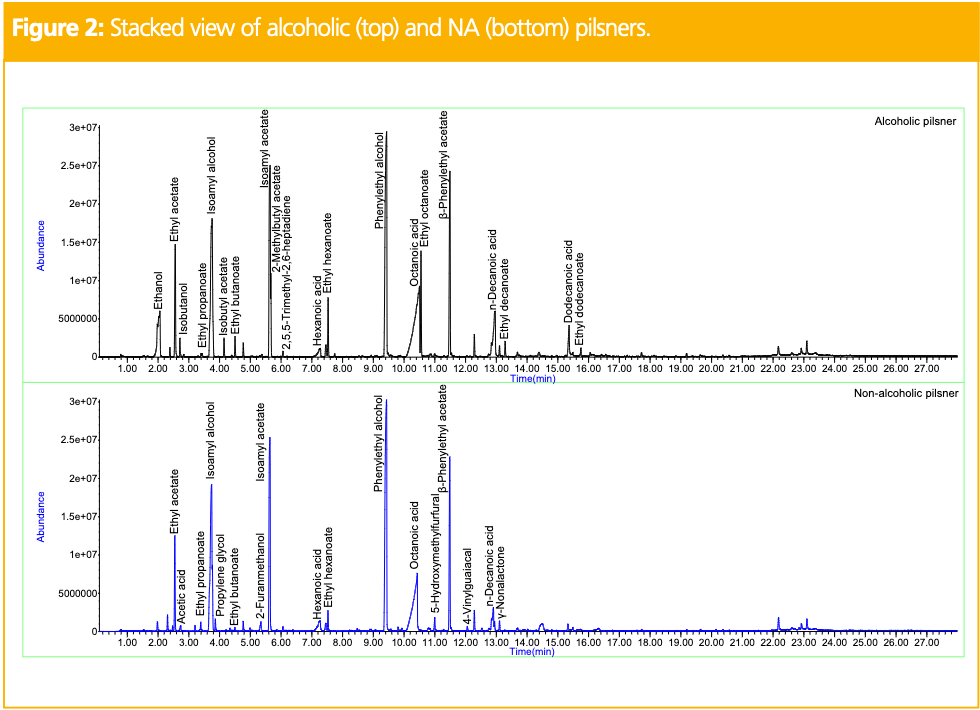


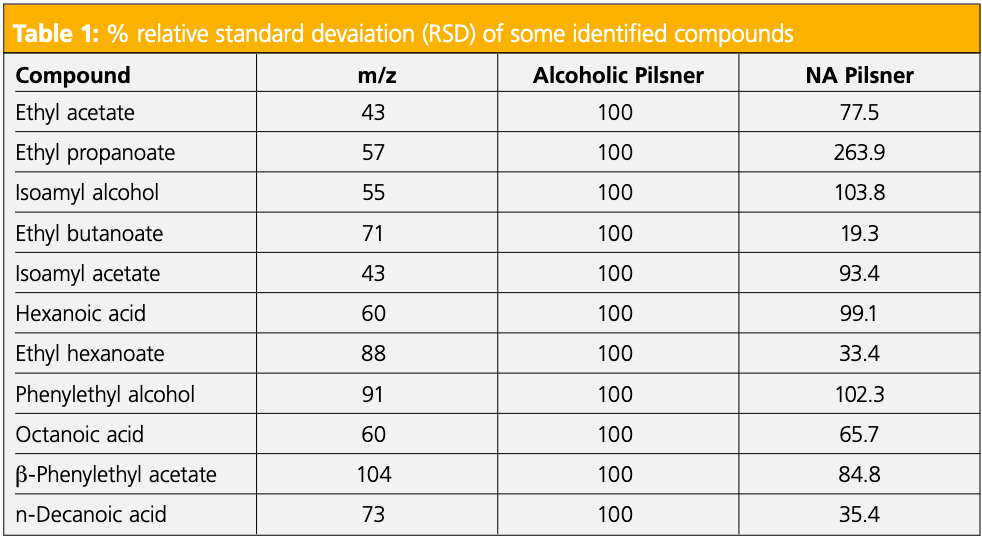
Figure 3 shows the stacked view of TICs obtained for the alcoholic (top) and NA (bottom) IPAs. IPAs are made with morehops during the brewing process, thus generating additional flavor compounds
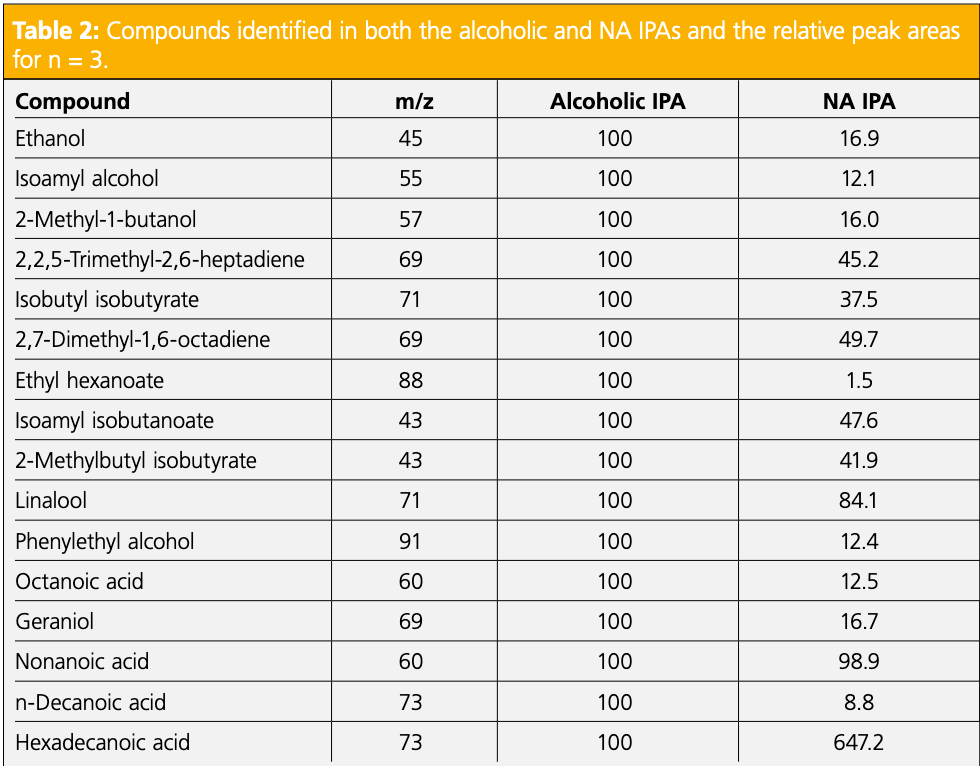
in the resulting chromatographic profiles. In the alcoholic IPA, ethanol, esters, fusel oils, fatty acids, phenylethyl alcohol, and terpenes were identified. In the NA IPA, the beer was fermented to less than 0.5% alcohol by volume to retain the integrity of the alcoholic IPA’s flavor profile, fermentation technique, and ingredients. However, differences remained in the resulting chromatogram. Fusel oils and some of the esters, terpenes, and fatty acids remained in the NA IPA, but ethyl butanoate, isobutyl acetate, hexanoic acid, and citronellol could not be accurately identified. However, new compounds like isomaltol, alpha-terpineol, and 5-hydroxymethylfurfural were identified. Like the pilsner, these differences are all characteristic of NA varieties and significantly impact the resulting flavor. Table 2 shows the relative peak areas of the compounds identified in the alcoholic and NA IPAs, normalized to the alcoholic version. All compounds exhibited reduced peak areas in the NA IPA except hexadecanoic acid which showed a significantly higher peak area. Figure 4 shows the stacked view of TICs obtained for the alcoholic (top) and NA (bottom) stouts. Stouts are commonly made with roasted barley, making them darker in appearance and creamier and dessert-like in flavor. In the alcoholic stout, fusel oils, esters, fatty acids, phenylethyl alcohol, tryptophol, and 4-vinylguaiacol were identified. Tryptophol is a sleep-inducing secondary alcohol produced during the fermentation process, and 4-vinylguaiacol is a natural product found in coffee beans offering smoky, spicy, vanilla-like organoleptic properties (7).


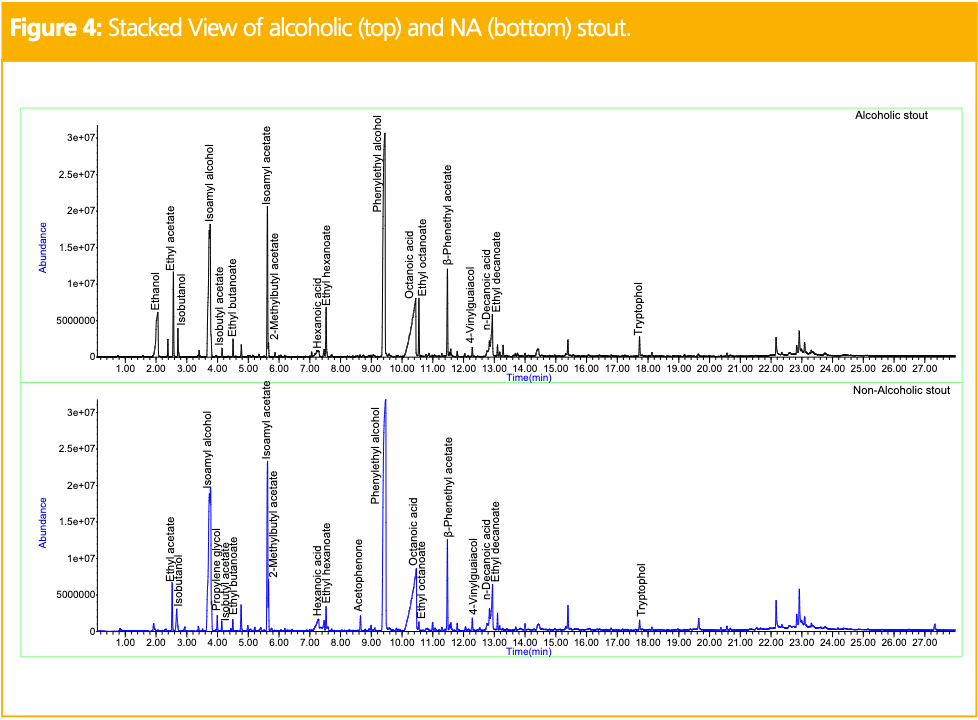

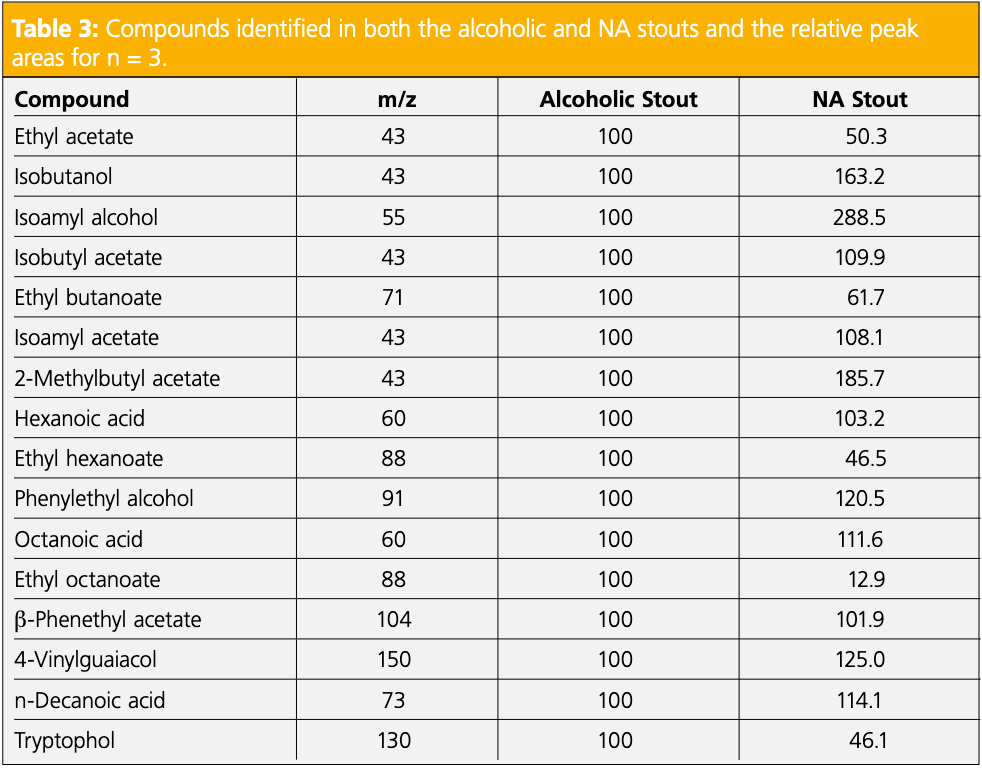
The NA stout exhibited all the same compounds with the addition of propylene glycol and acetophenone. Table 3 shows the relative peak areas of the compounds identified in both the alcoholic and NA stouts, normalized to the alcoholic version. Fewer differences were seen between the stouts because the manufacturer used a mild, cold filtration, dealcoholization approach to eliminate ethanol. While the absence of heat in the filtration process prevents the formation of Maillard reaction products, compounds may be lost in the filtration process. The lost compounds were added back by the brewer, to ensure the taste is comparable to the alcoholic version. Although the esters exhibited reduced peak areas in the NA stout, several compounds showed comparable and, in some cases, higher peak areas.


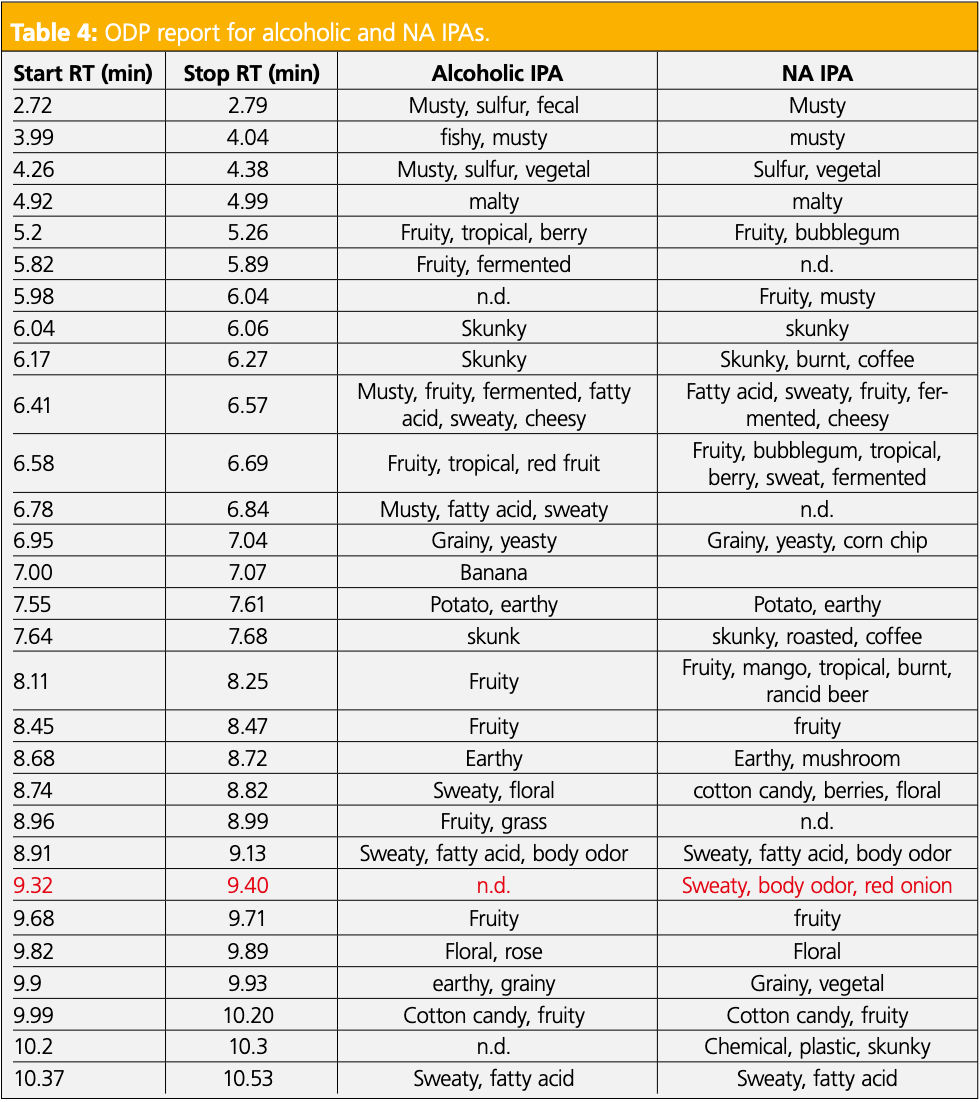
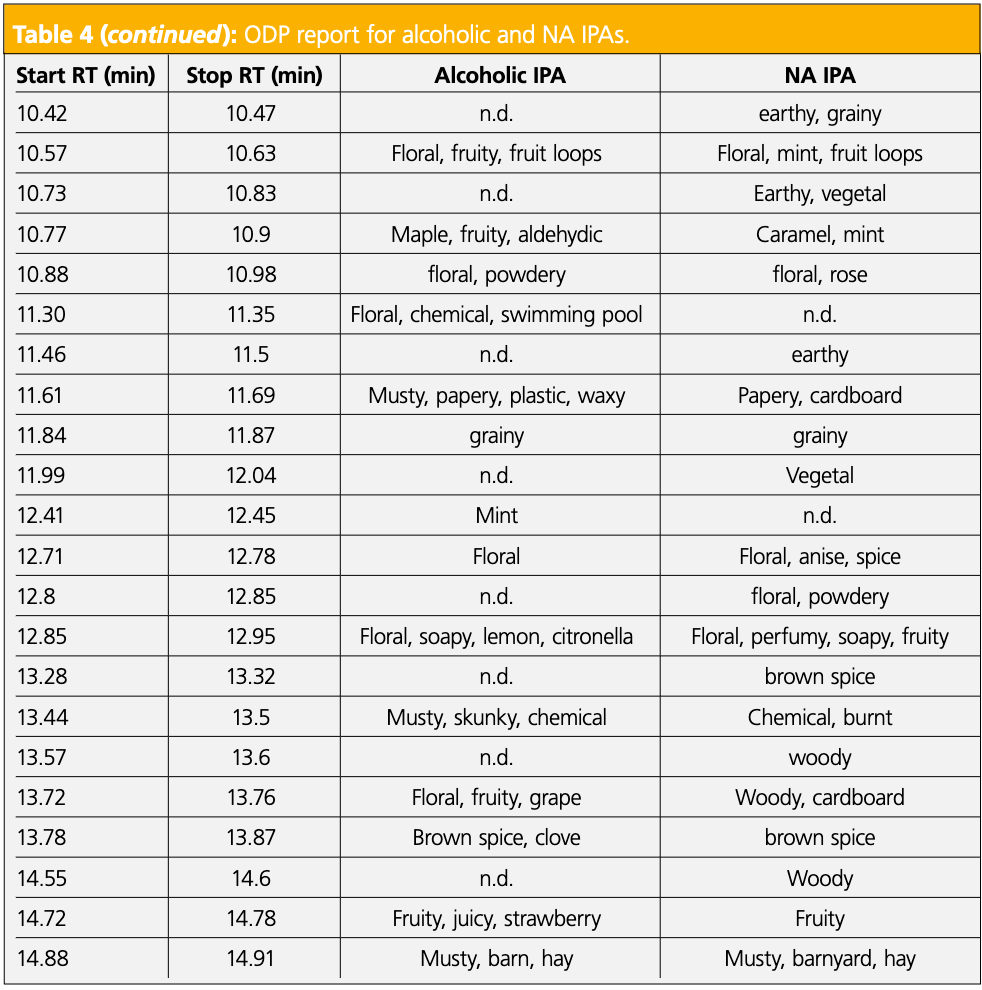
To further investigate the differences in the IPAs, sensory data was obtained. The IPAs were chosen as the alcoholic and NA varieties were the most different in terms of the number of compounds identified and overall aroma complexity. First, two panelists tasted the samples side-by-side to identify sensory differences. In the NA IPA, there was a key flavor described as fatty acid/onion that was not detected in the alcoholic variety. The two panelists then evaluated the IPAs at the ODP 4, and the combined odor descriptors are shown in Table 4. The sensory data are comparable for some retention time regions, but there remained several areas where the dealcoholization process produced clear differences. Specifically, the odor region described as sweaty, body odor, and red onion between 9.32 and 9.40 min, bolded in red in Table 4, was only detected in the NA IPA and was representative of the key odor detected in the sensory panel. However, it did not correlate with an identifiable peak at the MS.


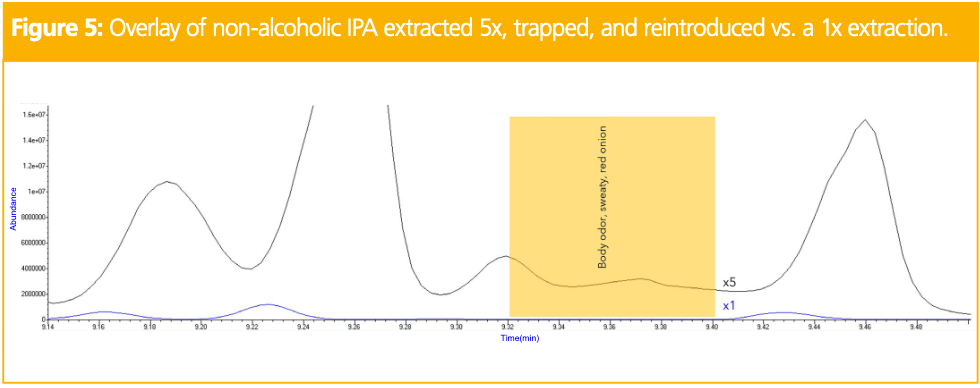
To identify this key odor region, more mass on column was achieved by trapping multiple extractions at the ODP. Five extractions, over a series of injections, of the NA IPA were used to trap the odor region between 9.32 and 9.40 min onto a single Tenax TA thermal desorption tube. Upon reintroduction of the trapped region, a small peak was visible. Figure 5 shows the zoomed-in overlay of the NA IPA chromatogram with the fivefold trapped region used for compound identification. In the trapped chromatogram, the small peak was identified as 3E-hexenoic acid. A standard of 3E-hexenoic acid was analyzed to confirm that the retention time, mass spectrum, and odor matched that of the compound in the sample.


Conclusion
Immersive extraction using SBSE and TF-SPME membranes allows for efficient and optimal pre-concentration of essential flavor compounds from alcoholic and NA beer varieties. The extraction devices’ ability to sorb the broadest range of analytes and deliver the most mass on column with reproducible results provided a simple means to obtain detailed flavor profiles of beer. The data provided offer a clear depiction of variations in peak areas, the depletion of esters, and the presence of new compounds, such as carrier solvents and furans, within the NA counterparts. These distinctions arise as a result of the implementation of three distinct dealcoholizing methods. The olfactory detection device used offered selective trapping capabilities, which allowed for the increased analyte mass on column while removing the rest of the sample matrix to produce an identifiable peak for a key sensory-active component. Having access to this kind of information is extremely valuable when it comes to enhancing and advancing product quality and development.
References
(1) Parker, D. K. Alcoholic Beverages Sensory Evaluation and Consumer Research, Piggott, J., Ed.; Woodhead Publishing Limited: Cambridge, UK, 2011; pp. 133–158.
(2) How Is Alcohol-Free Beer Made? Compound Interest. https://www.compoundchem.com/2022/08/24/alcohol-free-beer/ (accessed 2023-12-11)
(3) Riu-Aumatell, M.; Miró, P.; Serra-Cayuela, A.; Buxaderas, S.; Lópex-Tamames, E. Assessment of the Aroma Profiles of Low-Alcohol Beers Using HS-SPME–GC–MS. Food Res. Int. 2014, 57, 196–202. DOI: 10.1016/j.foodres.2014.01.016
(4) Bartolomé, B.; Peña-Neira, A.; Gómez-Cordovés, C. Phenolics and Related Substances in Alcohol-Free Beers. Eur. Food Res. Technol. 2000, 210 (6), 419–423. DOI: 10.1007/s002170050574
(5) The History of Non-Alcoholic Beer in America. NA Beer Club. https://nabeerclub.com/history-non-alcoholic-beer/ (accessed 2023-12-11)
About the Authors
Megan Harper works as an Applications Scientist at Gerstel, Inc. in Baltimore, MD, USA. While receiving her MS degree in forensic science with an analytical chemistry track from Towson University in 2022, Megan began working for Gerstel, where her current focus is optimizing automated sample extraction techniques for GC–MS applications and sensory directed analysis (SDA). Direct correspondence to: mharper@gerstelus.com
Nicole Kfoury works as an Applications Scientist at Gerstel. After receiving her PhD in analytical chemistry from Tufts University in 2018, she was a postdoc at Tufts focusing on solving complex sensory issues in various consumer products. Nicole joined Gerstel in 2020 and continues to perform sensory work for GC–MS applications while promoting SDA.
Jackie Whitecavage works as a Senior Applications chemist at Gerstel. Jackie has been a member of Gerstel’s Analytical Service group since 1999 focusing mainly on thermal desorption and pyrolysis applications for GC–MS.


Analytical Challenges in Measuring Migration from Food Contact Materials
November 2nd 2015Food contact materials contain low molecular weight additives and processing aids which can migrate into foods leading to trace levels of contamination. Food safety is ensured through regulations, comprising compositional controls and migration limits, which present a significant analytical challenge to the food industry to ensure compliance and demonstrate due diligence. Of the various analytical approaches, LC-MS/MS has proved to be an essential tool in monitoring migration of target compounds into foods, and more sophisticated approaches such as LC-high resolution MS (Orbitrap) are being increasingly used for untargeted analysis to monitor non-intentionally added substances. This podcast will provide an overview to this area, illustrated with various applications showing current approaches being employed.

Carol Robinson Awarded 2024 Lifetime Achievement European Inventor Award
July 24th 2024Carol Robinson of the University of Oxford has received the European Inventor Award 2024 for Lifetime Achievement from the European Patent Office for her work bringing mass spectrometry to structural biology.

Contaminants of Emerging Concern in Drinking Water: An HTC-18 Interview with Leon Barron
July 23rd 2024At HTC-18 in Leuven, Executive Editor of LCGC International, Alasdair Matheson, spoke to Leon Barron from Imperial College London about his innovative research focusing on modern chromatographic techniques for analyzing contaminants of emerging concern in drinking water.

Using Artificial Intelligence in Foodomics: An HTC-18 Interview with Chiara Cordero
July 19th 2024At HTC-18 in Leuven, Executive Editor of LCGC International, Alasdair Matheson, spoke to Chiara Cordero from the University of Turin about the evolving role of AI and its effect on GCxGC in foodomics.


