

"GC Connections" column editor Nicholas Snow offers a basic GC maintenance tools and supplies overview.
"GC Connections" column editor Nicholas Snow offers a basic GC maintenance tools and supplies overview.
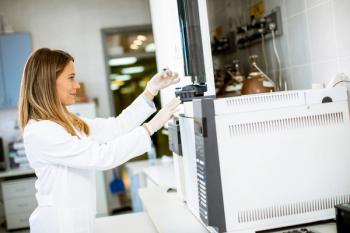
Modern capillary gas chromatographs offer excellent resolution and sensitivity with quick training time, but, like any complex scientific instrument, require regular maintenance. Nick Snow's latest "GC Connections" column covers essential maintenance practices, including carrier gas management, inlet upkeep, column care, and detector maintenance.
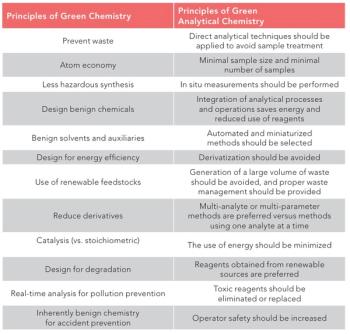
With the increasing interest in green chemistry and sustainability, analytical chemists are developing new methods and reexamining existing methods with a new emphasis on sustainability and environmental impact. Since the publication of the principles of green chemistry in the 1990s and the principles of green analytical chemistry in the 2000s, several scoring systems for evaluating the greenness or sustainability of analytical methods have been developed. In this column, we will examine three widely used scoring methods: Red, green blue (RGB), the analytical greenness metric (AGREE), and the analytical method greenness score (AMGS) with comments on how they all apply to gas chromatography (GC). We will see that classical GC, which has roots in the origins of the environmental movement, has been and remains among the greenest of analytical techniques.

In this installment, we will describe several modes of MS/MS detector operation.

The latest edition of “GC Connections” presents an annual review of new developments in the field of gas chromatography introduced in 2024–2025.

In this installment, we will review the fundamental terminology and data analysis principles in benchtop GC–MS. We will compare the three modes of analysis—full scan, extracted ion chromatograms, and selected ion monitoring—and see how each is used for quantitative and quantitative analysis.

In the third part of Nicholas Snow's series on splitless GC injections, he discusses techniques for setting up the inlet and connections for optimized injections.

In Part II of our exploration of splitless injection, we will see that it is a surprisingly complex process, and that it is difficult to understand because we cannot see what is happening during the injection process. For this discussion, we will think of the injection process as beginning with the syringe plunger being depressed and ending with the start of a temperature program in the column oven. In most splitless injections, this process requires 30 s to 1 min. There are several band broadening and focusing mechanisms that affect the peak shapes, widths, and heights resulting from splitless injection.

For trace quantitative analysis, the splitless technique is most used as an inlet capable of performing both split and splitless injections. In this and upcoming installments, we take a closer look at splitless injection.
In this article, we discuss the fundamentals of headspace extraction, including static versus dynamic extraction, establishing equilibrium in the vial, consequences of the partition coefficient, temperature, pressure, and transfer to the gas chromatograph.
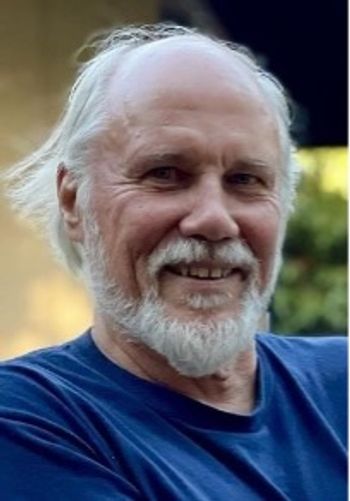
Roy Lautamo was a genius in the gas chromatography (GC) industry, responsible for numerous technical advancements. Here, we remember his storied career and accomplishments.

In this installment, we examine several of the common parameters that can affect automated peak integration and the resulting peak areas. We will consider how the data system detects the beginning and end of the peak, how it determines the peak maximum, how real peaks are differentiated from noise, and how signals at individual time intervals are summed to generate the peak area.
A recent sample preparation survey explored the critical role of sample preparation in gas chromatographic analysis.

Gas chromatography can be used in combination with molecular spectroscopy to provide structural and quantitative information on a variety of sample types.
Comprehensive two-dimensional GC×GC has made great strides in the past 20 years. The author discusses advances in instrumentation, column sets, data analysis, and the range and types of samples amenable to this method.
We offer troubleshooting tips for various gas chromatography (GC) detectors, as well as provide an overview of the different options chromatographers have when using a GC detector.
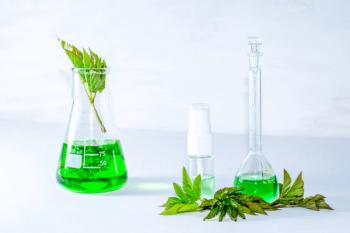
Everyone is talking about sustainability, and organizations are creating sustainability programs. But what does green chemistry really mean, and how does it apply to gas chromatography?

We assess the landscape of new gas chromatography (GC) instrumentation, supplies, and accessories introduced over the past 12 months.

Understanding the relationship between selectivity and retention is key to realizing excellent gas chromatographic separations.

By reviewing the basic thermodynamics underlying GC separations, we see how it impacts retention and method development in GC analysis.

The common measures of stationary phase polarity—McReynolds constants and the polarity scale—are not always accurate predictors of retentiveness or selectivity in GC.

The electron capture detector (ECD) for GC is still used relatively unmodified today. But using it effectively means understanding the tradeoffs between selectivity, ease of use, and sensitivity.

We pass on valuable lessons shared by the six GC speakers at ChromTalks 2022.
Hidden uncertainties in quantitative methods may make data look more precise and accurate than they really are. Take particular care when using dilution, which can increase experimental uncertainty.

Our annual review of new gas chromatography products.
The glass inlet liner is one of the most important, yet least understood and most often ignored, components of a gas chromatographic experiment.

When applying Golay’s equation for height equivalent of a theoretical plate (HETP) to capillary GC, you should ask three key questions.

We are all familiar with Golay’s equation relating to height equivalent to a theoretical plate (HETP) in GC. But do we understand it correctly?

Gas chromatographers may not have the latest equipment they need. Here, we give a list of tools and consumables that can help make workflows more efficient, detection limits lower, and GC instruments cleaner.
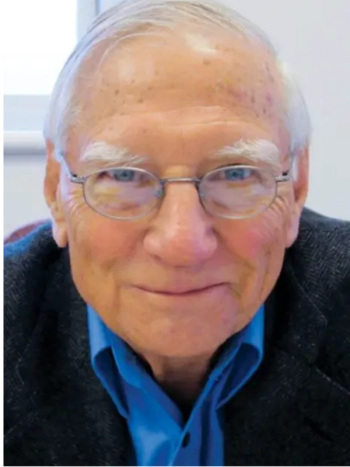
The late Harold McNair had a remarkable 60-year career as a chromatographer. He taught us many valuable lessons, three of which we discuss here.