


The basic operating principles of ion mobility spectrometers (IMS), their resulting strengths and weaknesses, and why both perfectly align with the capabilities and requirements of gas chromatographs are discussed.
The basic operating principles of ion mobility spectrometers (IMS), their resulting strengths and weaknesses, and why both perfectly align with the capabilities and requirements of gas chromatographs are discussed.
Kate Perrault Uptmor is an assistant professor at William & Mary focusing on nontargeted analysis on highly complex samples.

This study replicates reports where the use of wool in the liner has resulted in poor reproducibility and low response for semi-volatile compounds.

LCGC’s Senior Technical Editor uses artificial intelligence (AI) platform ChatGPT to answer questions about the role of AI in separation science. Do you agree with ChatGPT?

Are you a chromatographer or a chromatography user?

Here are the top five articles that the editors of LCGC International published this week.

During the 18th International Symposium on Hyphenated Techniques in Chromatography and Separation Technology, experts presented a workshop on emerging industrial applications in MS.
Here are the top five articles that the editors of LCGC International published this week.

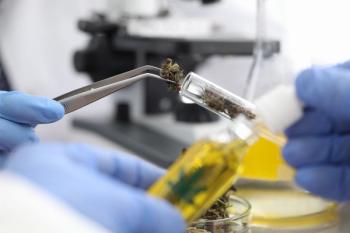
Scientists from the Shenyang Pharmaceutical University in China have developed a new quality assessment system for various types of traditional Chinese medicine (TCM).

Scientists from the Chinese Academy of Sciences recently tested out a new type of micro gas chromatographic column (µGCC) for separating light hydrocarbons.

In this installment, we examine trends in the use of sample preparation techniques through the lens of instrumental analysis by gas chromatography (GC) and GC–mass spectrometry (GC–MS).

Recent advances in coating techniques and improved polymers employed as gas chromatographic stationary phases have resulted in commercializing low phase ratio capillary column technology with respectable chromatographic efficiency and inertness.

Scientists from the University of Messina recently developed a new omega-3 fatty acid-based supplement and tested its effectiveness on metabolism and lipid profiles.

Selected ion flow tube mas spectrometry (SIFT–MS) offers real-time measurements directly from air without chromatography or sample preparation, providing an attractive alternative for these hard-to-measure volatile organic compounds.
In this edition of The LCGC Blog, Katelynn Perrault and James Harynuk discuss the technological needs one faces when setting up a workstation for chromatography data analysis.

In this edition of "The LCGC Blog," Jonathan Shackman discusses the differences between chromatographers and chromatography users, as well as advancements that have made chromatography a more accessible field.

Scientists from the Chinese Academy of Inspection and Quarantine recently published a review on how green solvents can further the evolution of microextraction techniques.

At issue in this study was the certified value of decabromodiphenyl ether (BDE 209) in a polystyrene matrix CRM relative to its regulated value in the EU Restriction of Hazardous Substances Directive.
On this Earth Day, LCGC sits down with Toby Astill of Thermo Fisher Scientific to talk about laboratory testing of PFAS and how companies and industry work in tandem with governments and regulatory agencies to share information and effect changes in standards.
Here are the top five articles that the editors of LCGC International published this week.

In this edition of “Inside the Laboratory,” Pascal Cardinael and Valérie Agasse of the University of Rouen in Mont‑Saint-Aignan, France, discuss their laboratory’s work with miniaturizing gas chromatography (GC) columns and systems to improve on-site air analysis of volatile organic compounds (VOCs).

At Pittcon 2024, Massood Kadir, Business Development Manager at Syft Technologies, gave a live demonstration of real-time trace gas analysis by SIFT-MS, a direct mass spectrometry technique.
Chromatographic and spectroscopic techniques alike were reviewed for their current effectiveness and future potential in this lecture session at Analytica 2024.
Here are the top five articles that the editors of LCGC International published this week.

Pittcon convened in sunny San Diego, California, from February 24–28, 2024, and continued the trend of trade shows becoming smaller over the past several years.